

fig12
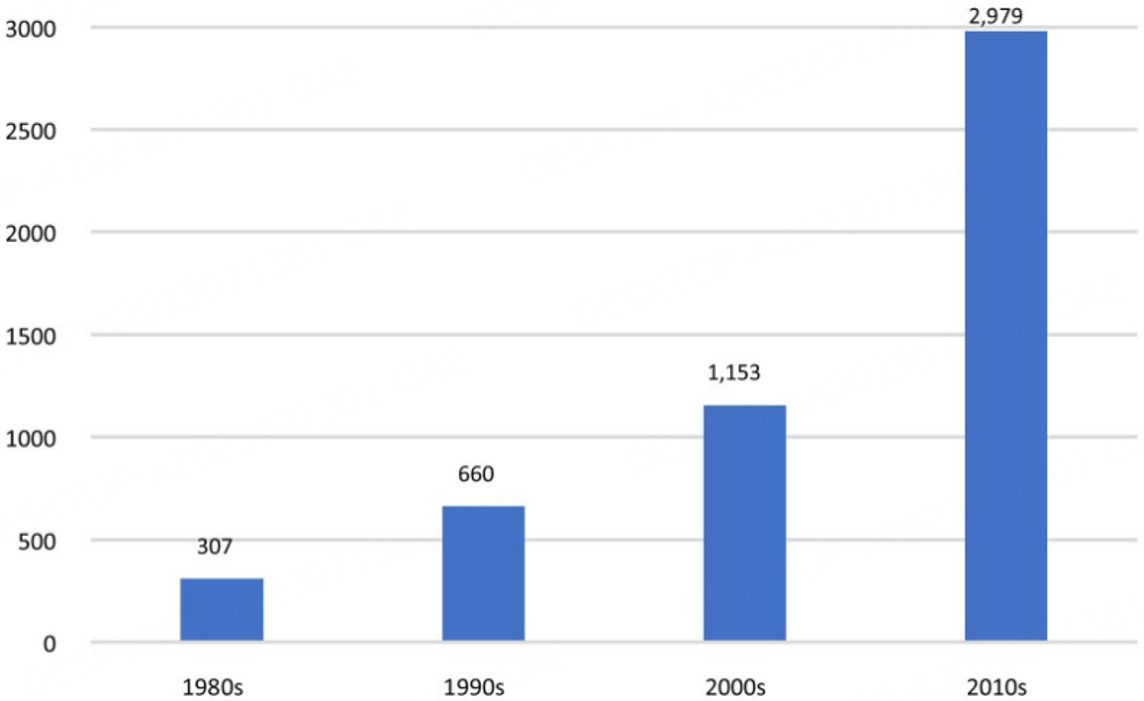
Figure 12. Histogram showing the progressive increase of FDA-approved orphan drugs by decade from the 1980s to 2010s. Reprinted with permission from[404]. Adhering to CC BY agreement.
Figure 12. Histogram showing the progressive increase of FDA-approved orphan drugs by decade from the 1980s to 2010s. Reprinted with permission from[404]. Adhering to CC BY agreement.

All published articles are preserved here permanently:
https://www.portico.org/publishers/oae/ All published articles are preserved here permanently:
https://www.portico.org/publishers/oae/