
fig5
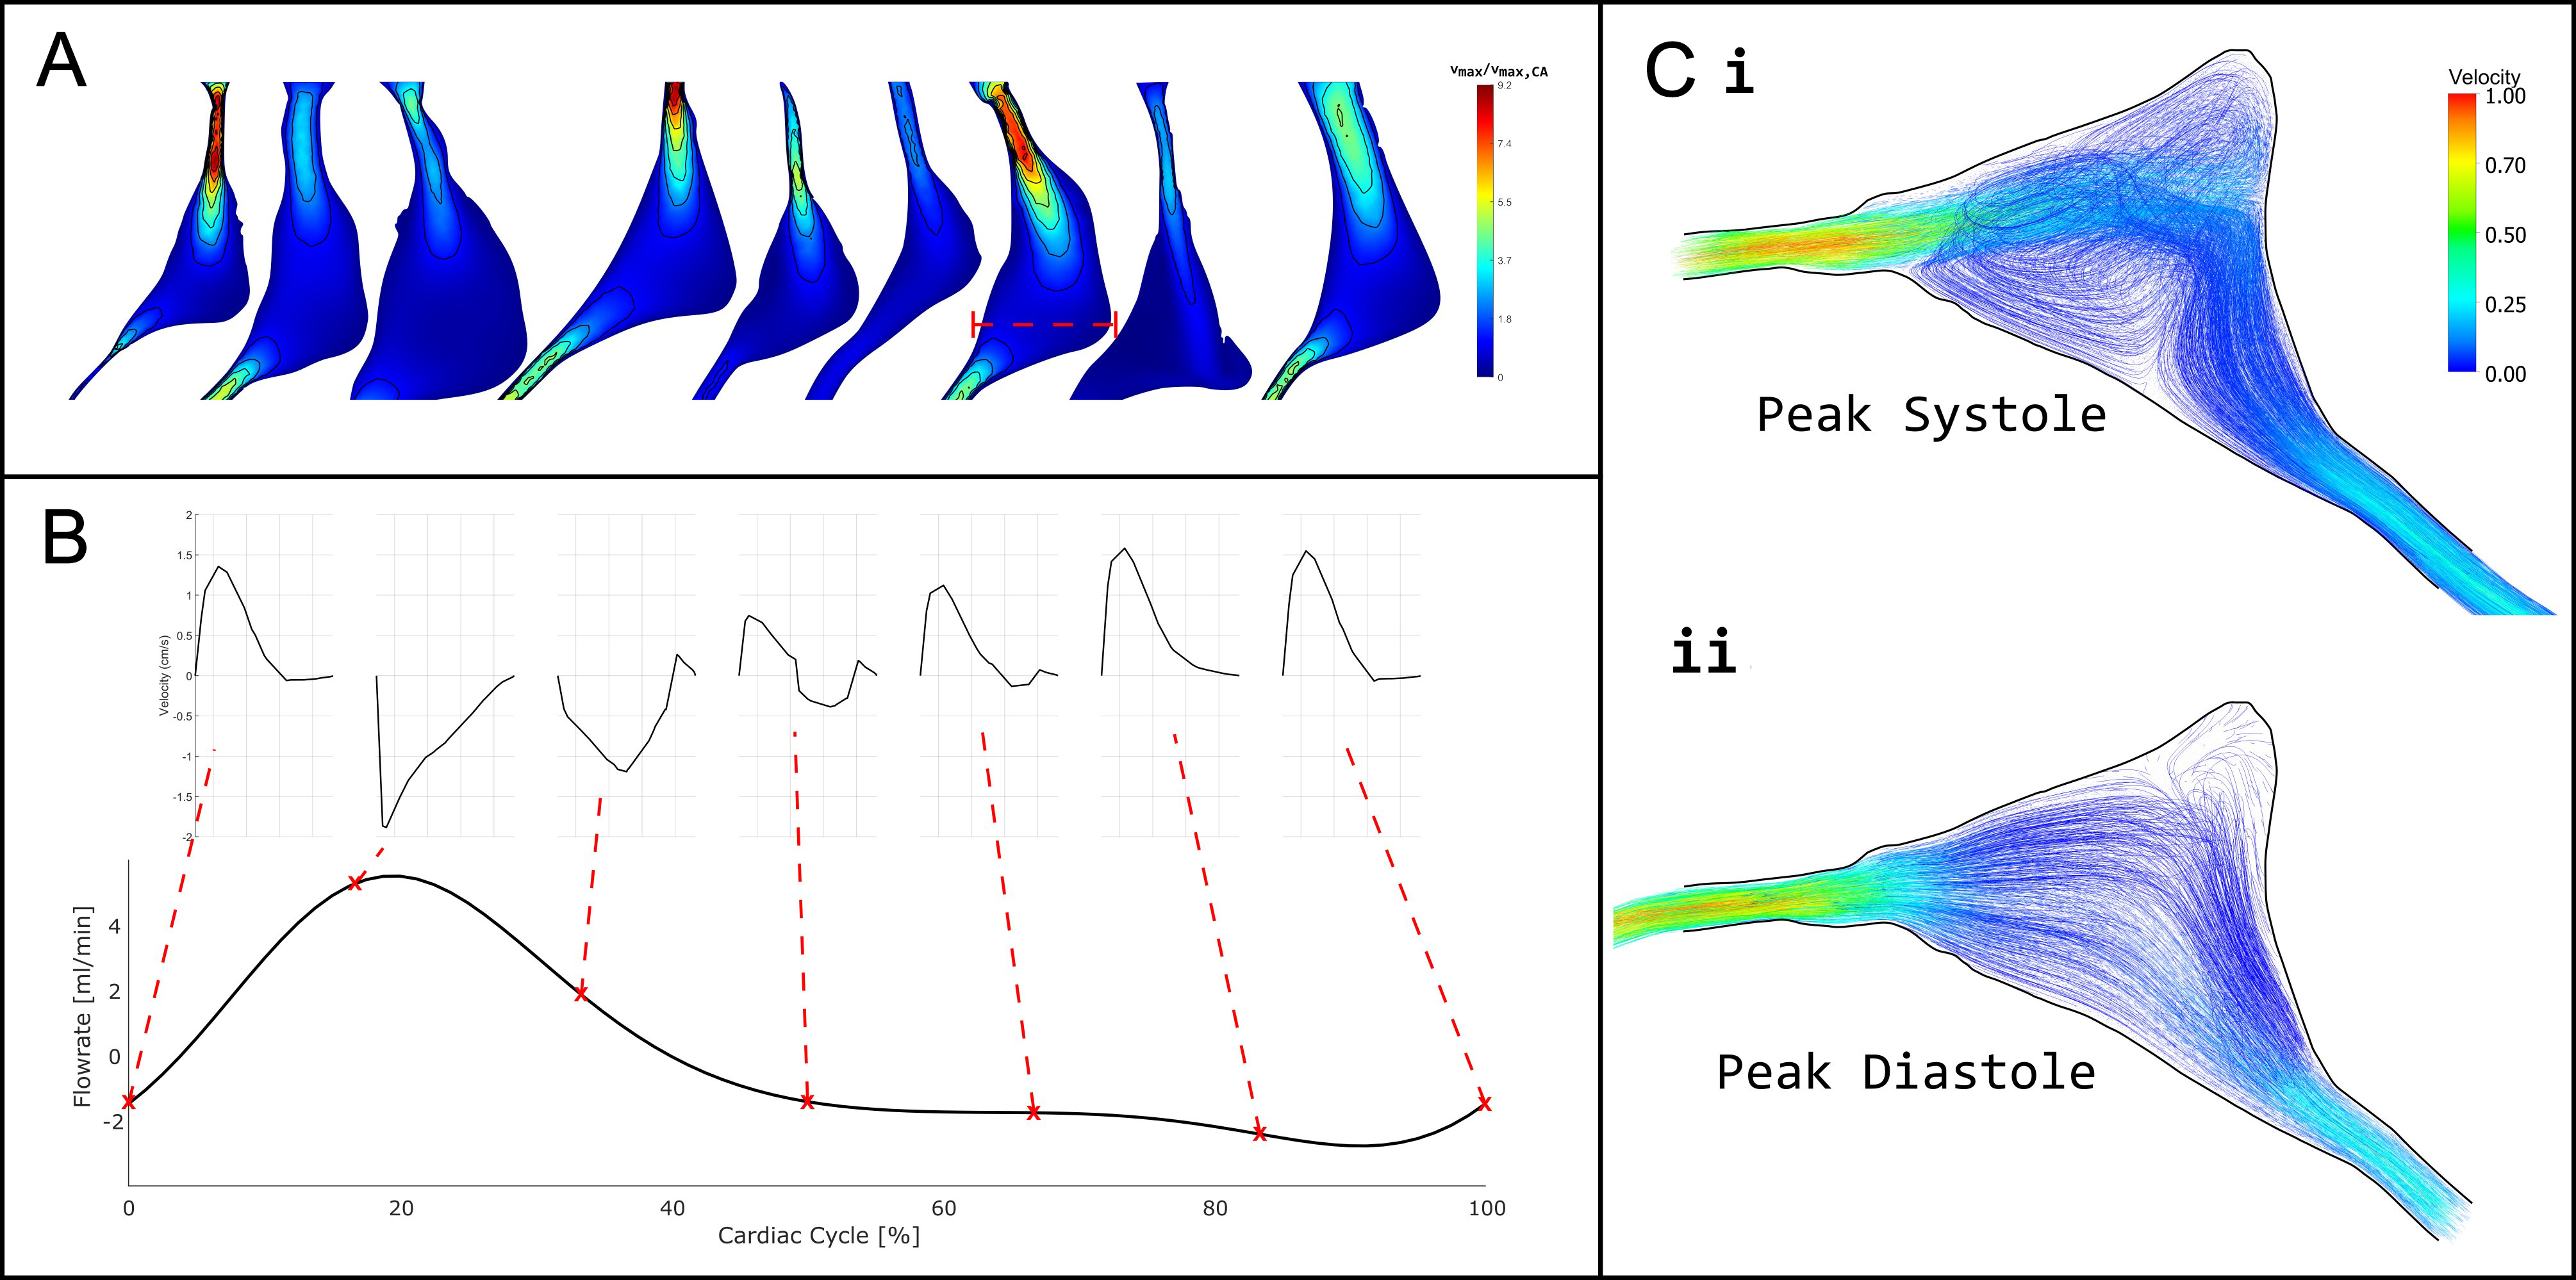
Figure 5. (A) Normalised CSF velocity magnitude within the cerebral aqueduct at peak systole (20% of the cardiac cycle), shown relative to the maximum velocity measured at a transverse slice through the mid-ampulla; (B) Flow rate through the transverse slice at the mid-ampulla of a single model shown as a red dashed line in (A), with the velocity profiles through the middle of the cross section shown at various points in the cardiac cycle; (C) Vector plot and streamlines of velocity magnitude in the mid-ampulla of the cerebral aqueduct at i. peak systole and ii. peak diastole relative to peak velocity in systole. CSF: Cerebrospinal fluid.