
fig2
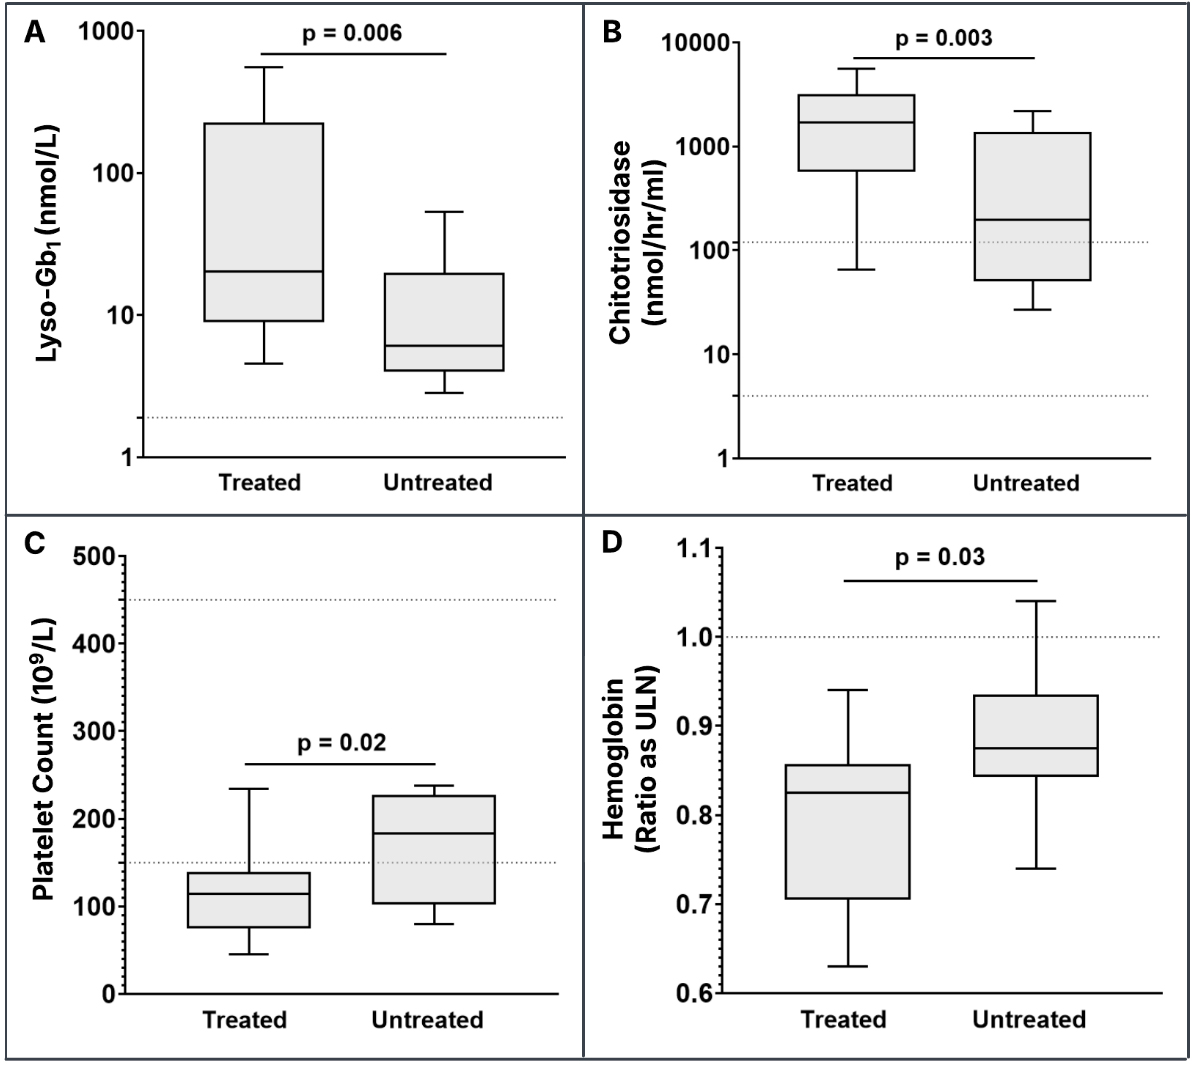
Figure 2. Baseline treatment-naïve biomarker values in treated patients and naïve biomarker values in untreated patients. The horizontal dashed line for lyso-Gb1 (A) denotes the upper limit of the normal reference range (≤ 2.05 nmol/L). The horizontal dashed lines for chitotriosidase (4-120 nmol/hr/mL) (B) and platelet count (150-450 × 109/L) (C) denote the lower and upper limits of the normal reference range. The horizontal dashed line for hemoglobin values (D) denotes the ratio as the ULN to account for age- and