


fig2
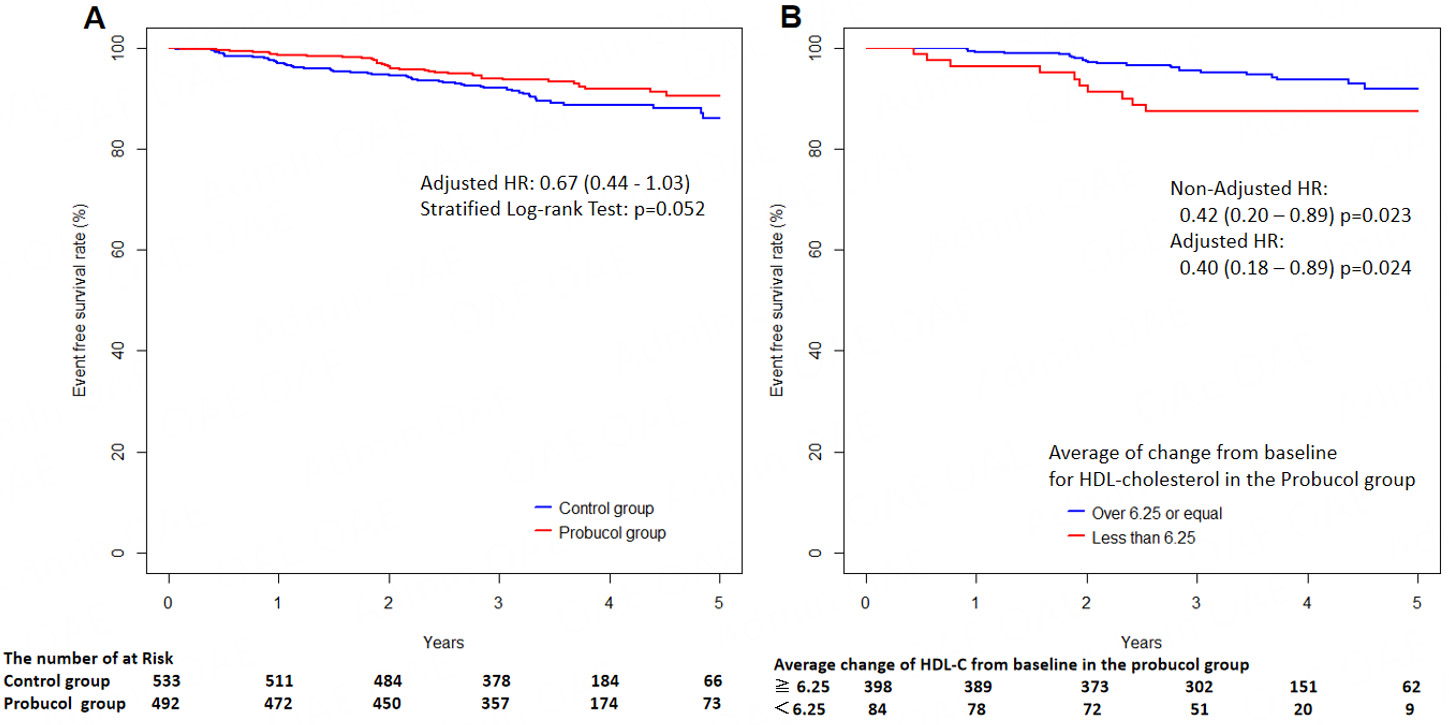
Figure 2. Kaplan-Meier curves for 5-year incidence of endpoint events. (A) Comparison of event-free survival between the probucol and control groups following randomization; (B) Subgroup analysis of the probucol group based on HDL-C reduction, stratified by an average decrease of ≥ 6.25 mg/dL versus < 6.25 mg/dL from baseline. Adapted from[85] (Licensed under CC BY-NC-SA 4.0).