

fig8
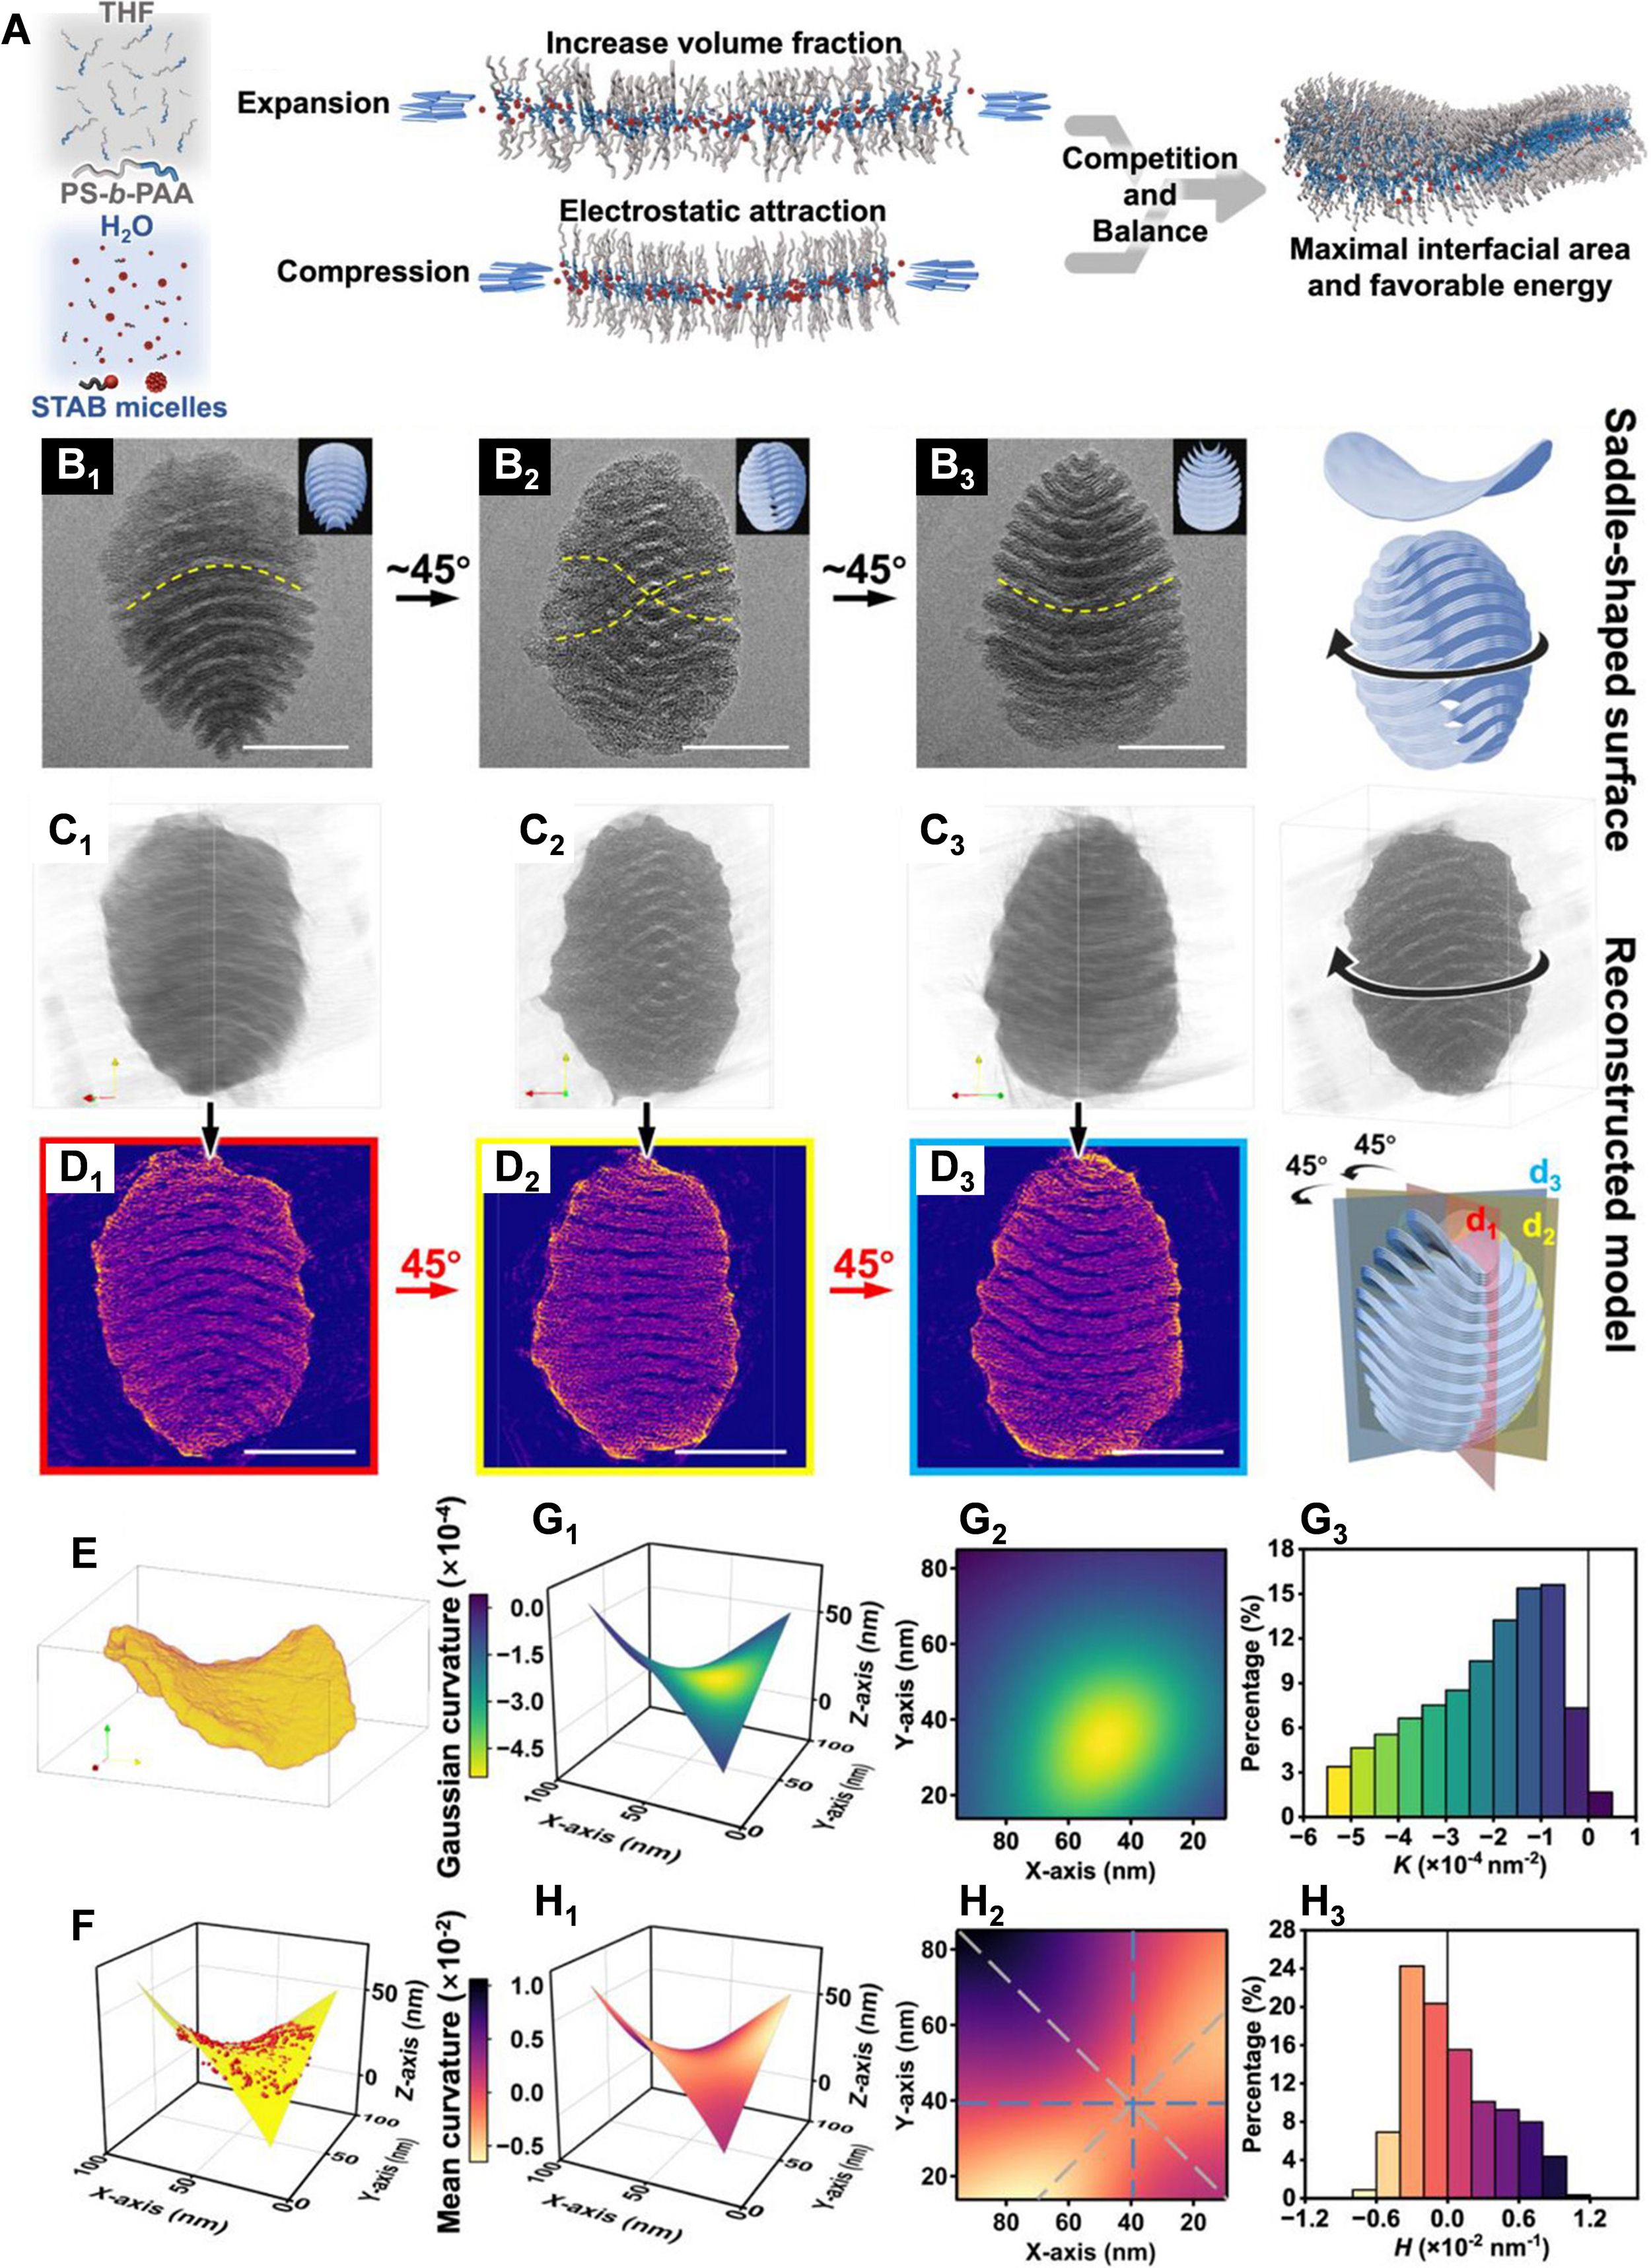
Figure 8. (A) Schematic diagram of the saddle-shaped structure formed by the competition and balance between the electrostatic screening and volume expansion effects; (B1-B3) TEM images of the saddle-shaped lamellar phase with secondary multilayer structure. The images were observed from different tilting directions along the long axis of the pupa-like nanoparticles. The corresponding structure model indicates the tilting directions; (C1-C3) Different viewpoints of the reconstruction model generated from the 2D TEM image series. The directions of the viewpoints are coincident with those in (B1-B3); (D1-D3) The corresponding central longitudinal sections obtained from different cross-section directions of the reconstructed model; (E) The single lamella segmented from the reconstructed model; (F) The point cloud extracted from the single lamella and the corresponding fitting surface; (G1-H3) The color-coded distributions of K (G1) and H (H1) on the saddle surface, their corresponding planar projections (G2 and H2) and histograms of K (G3) and H (H3), respectively. Scale bars: (B1-B3) and (D1-D3) 100 nm. This figure is reproduced with permission[207]. Copyright 2025, Wiley-VCH GmbH. THF: Tetrahydrofuran; PS-b-PAA: polystyrene-b-poly(acrylic acid); STAB: stearyltrimethylammonium bromide; TEM: transmission electron microscopy; 2D: two-dimensional.