

fig4
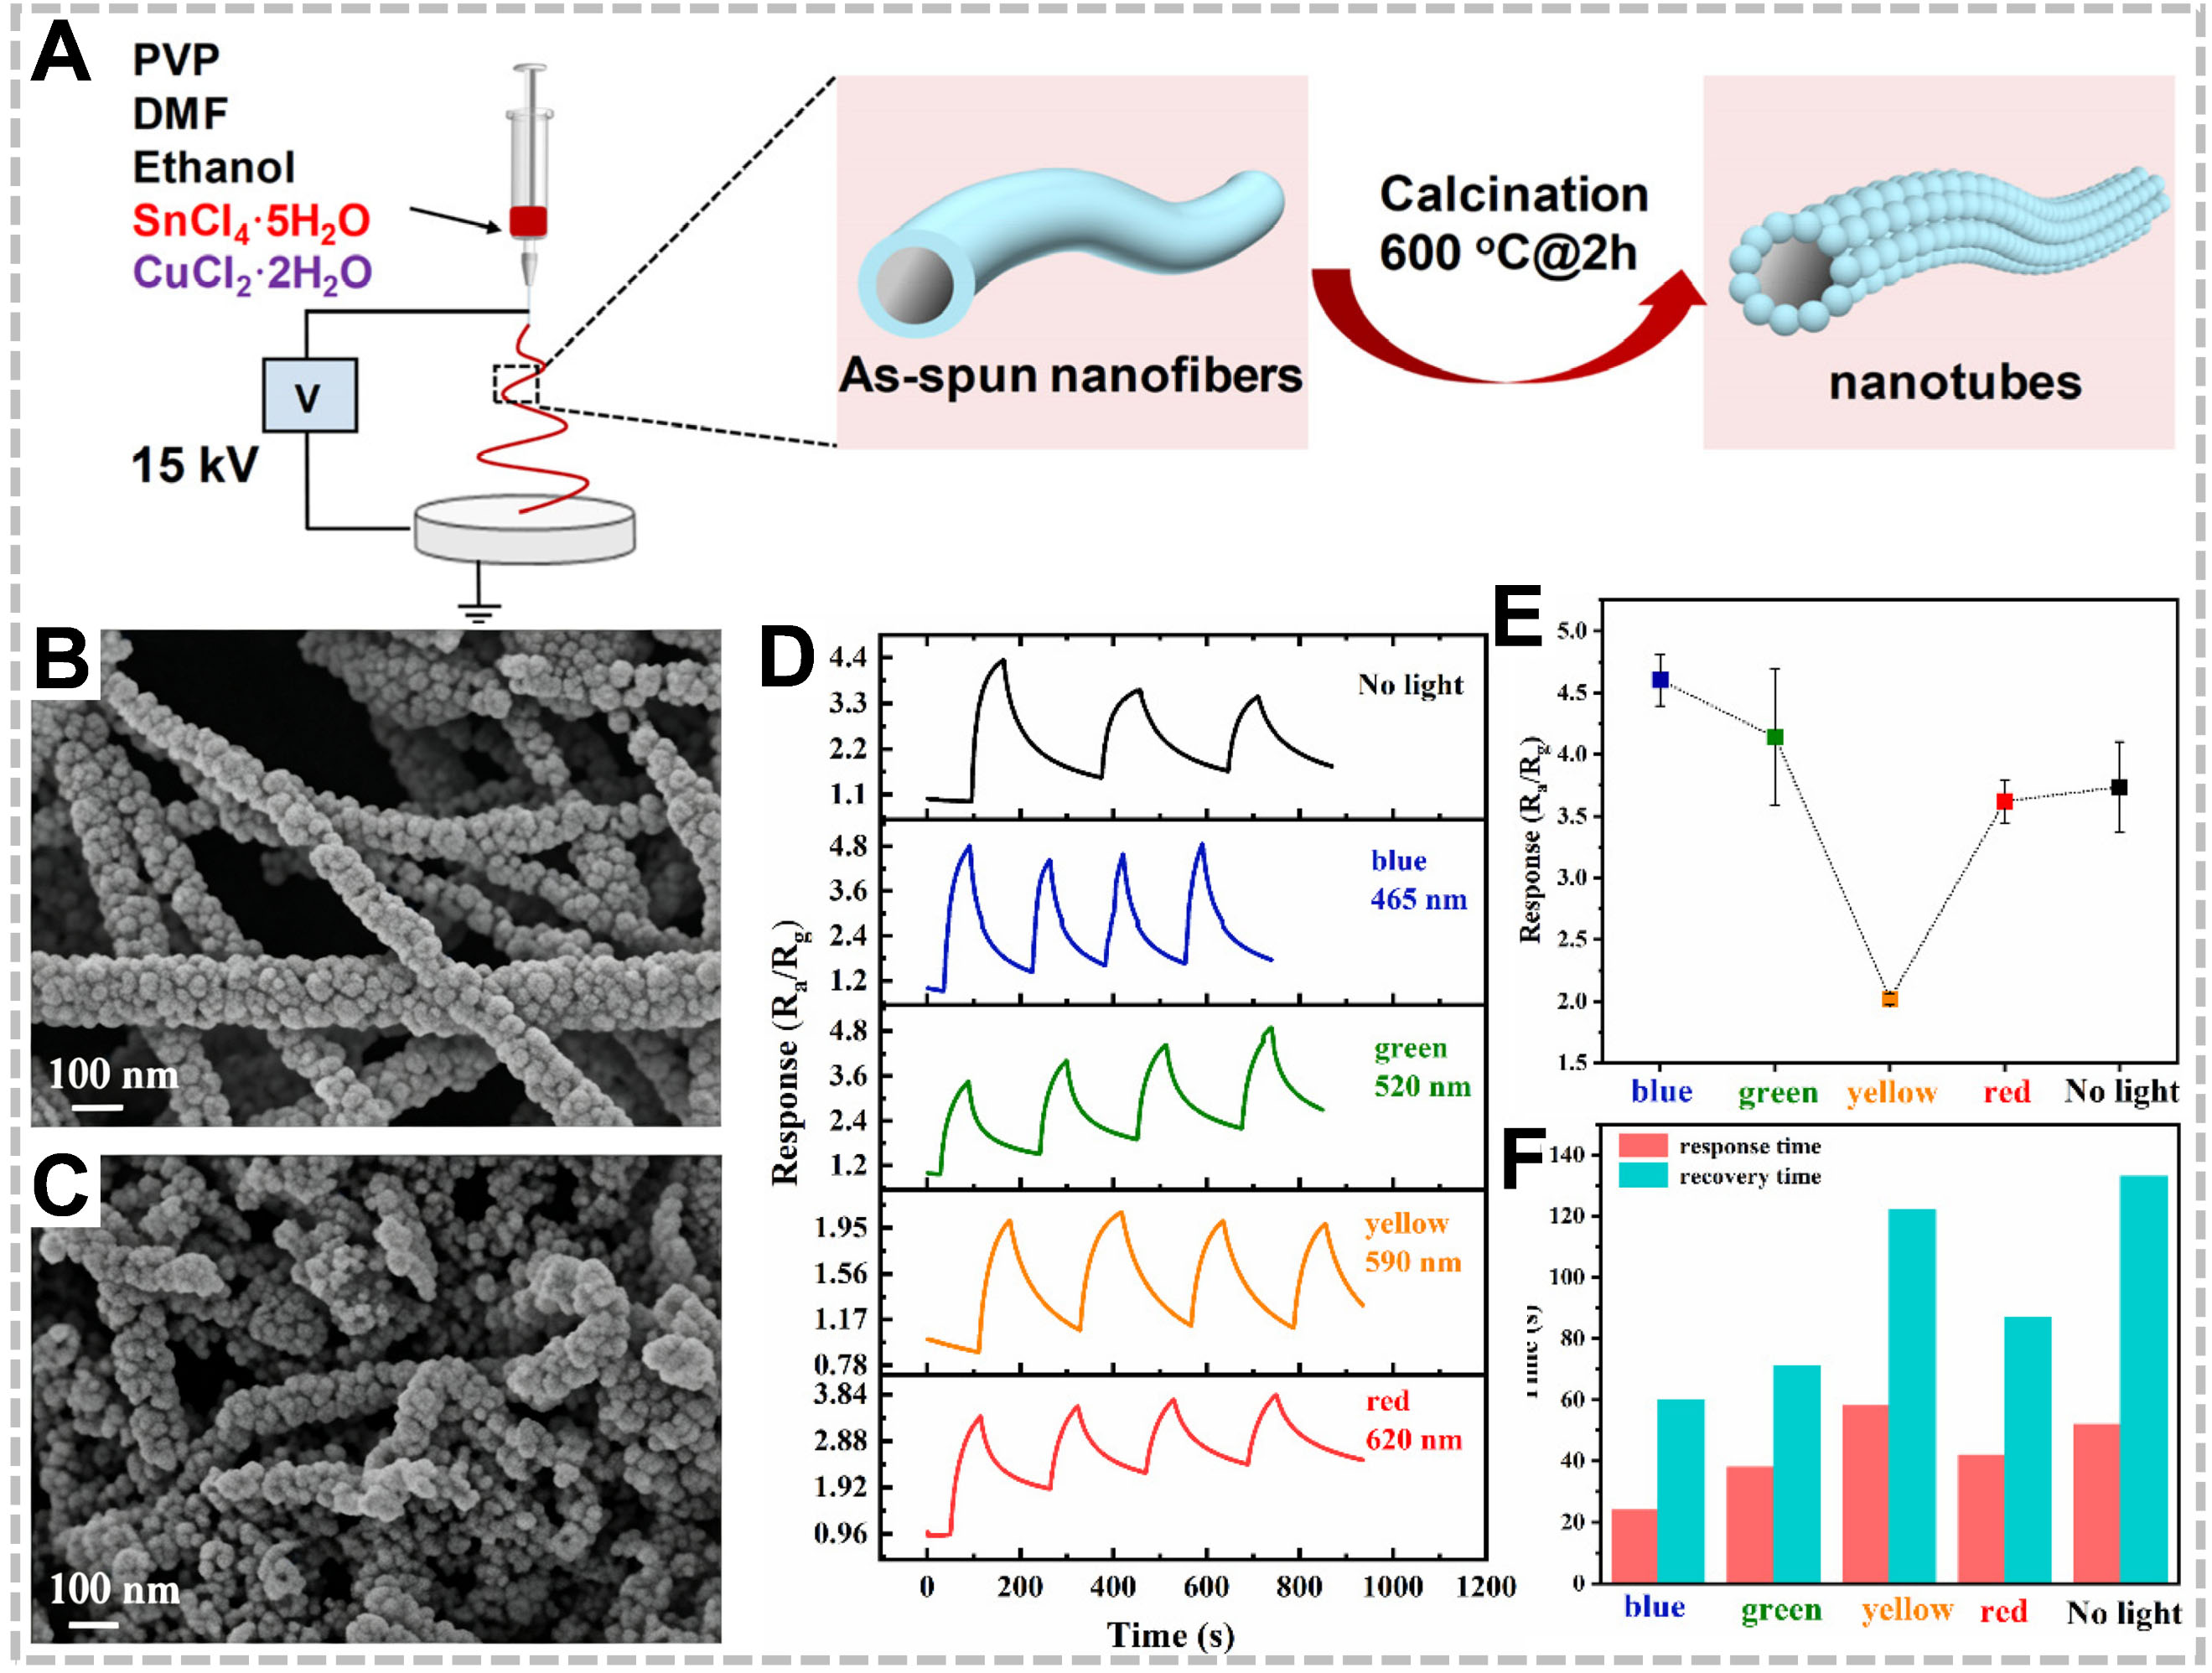
Figure 4. Performance of photoactivated-based H2S sensors. Schematic illustration of the material preparation process (A); SEM images of pure SnO2 (B) and CuO-SnO2 (C) samples; real-time response (D), mean response (E) and response/recovery times (F) for 10 ppm H2S under various visible-light activation. Figure 4 is reproduced from Ref.[154], under CC BY 4.0 license. PVP: Polyvinylpyrrolidone; DMF: N,N-dimethylformamide; SEM: scanning electron microscope; Ra/Rg: resistance in air/resistance in test gas; ppm: parts-per-million.

