

fig5
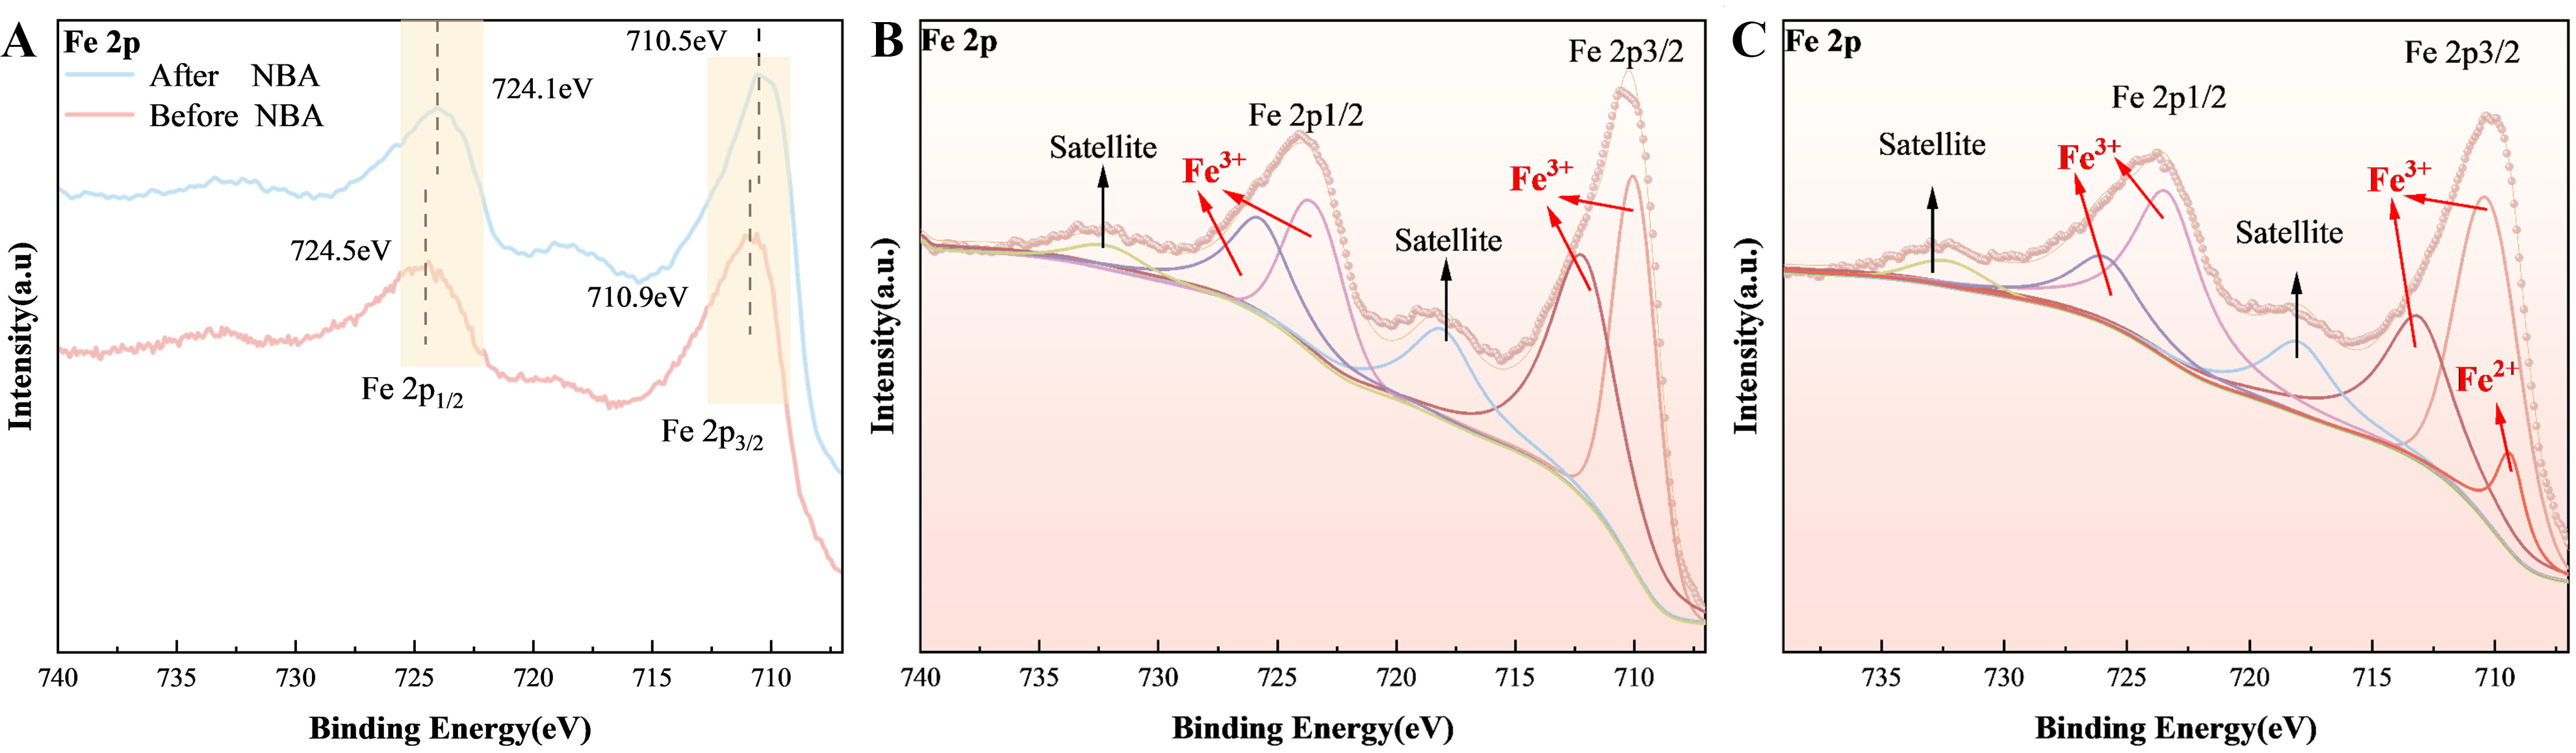
Figure 5. (A) XPS Fe 2p spectra of the 15%-Fe400 sample before and after exposure to n-butanol; (B) Deconvoluted XPS spectra and corresponding fitted peaks of the sample before n-butanol exposure; (C) XPS peak deconvolution results of the sample after contact with n-butanol. All subfigures are original and were plotted using Origin 2024. XPS: X-ray photoelectron spectroscopy.

