

fig5
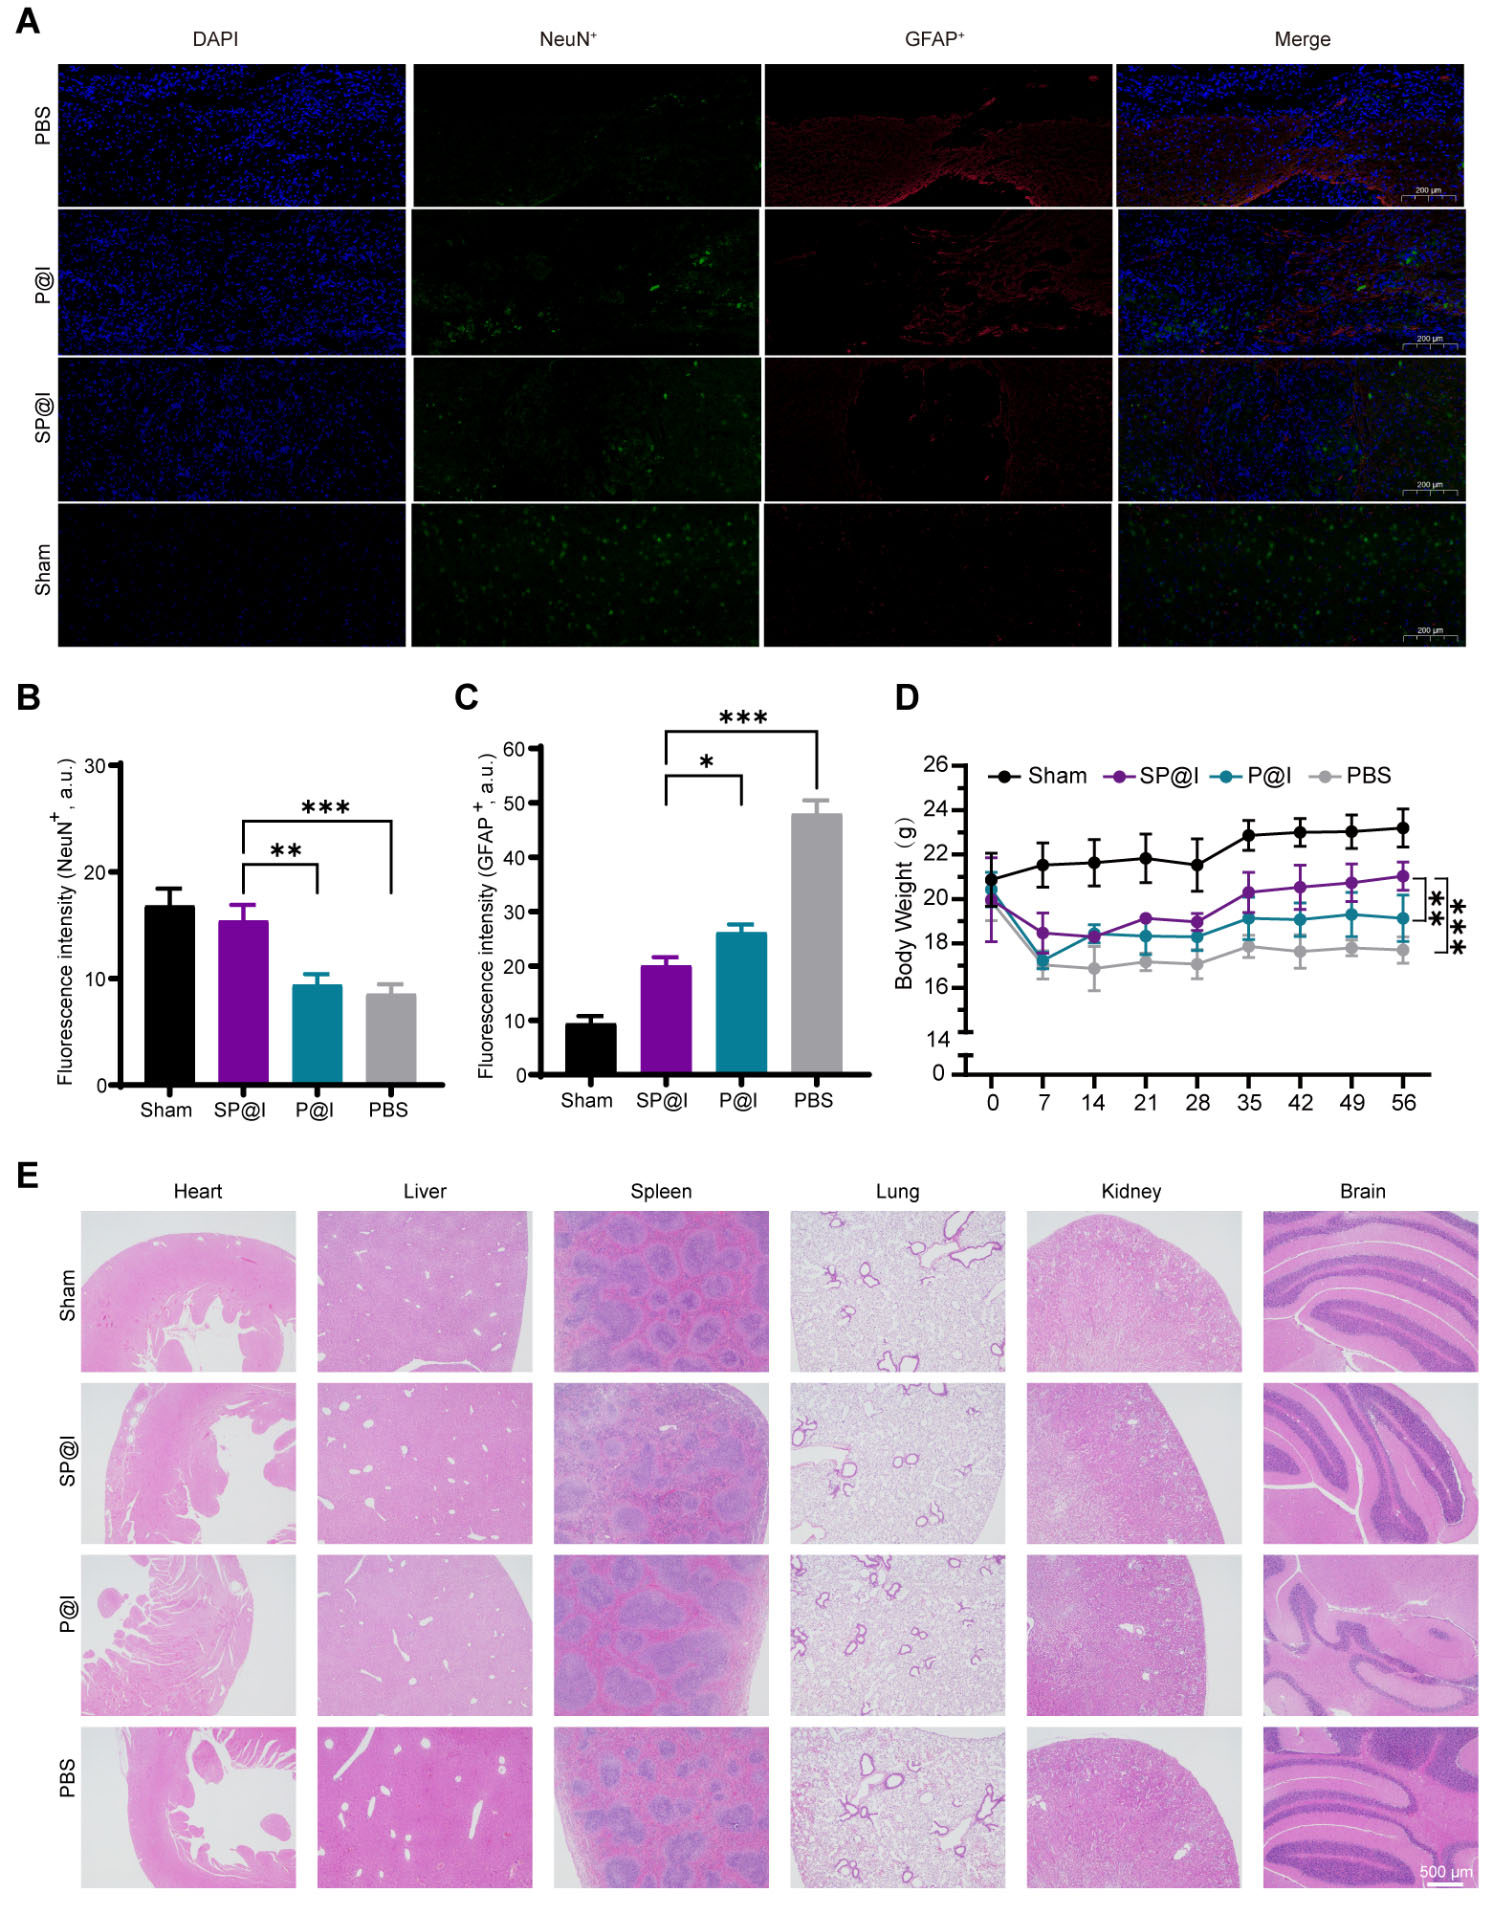
Figure 5. Evaluation of neuroprotective effects and systemic safety after SP@I treatment. (A) Representative immunofluorescence images showing NeuN+ (neurons) and GFAP+ (astrocytes) in the spinal cord sections of each group at day 56 post-injury. Scale bar: 200 μm; (B) Quantitative analysis of NeuN fluorescence intensity. Statistical significance: SP@I vs. P@I, P =0.0019; SP@I vs. PBS P =0.0008; (C) Quantitative analysis of GFAP fluorescence intensity. SP@I vs. P@I, P = 0.0124; SP@I vs. PBS, P < 0.0001; (D) Body weight changes of mice in each group were monitored for 8 weeks post-modeling. Significant differences were observed at day 56: SP@I vs. P@I, P = 0.0044; SP@I vs. PBS, P < 0.0001; (E) Representative H&E-stained sections of major organs (heart, liver, spleen, lung, kidney, and brain) from each treatment group at day 56. Scale bar: 500 μm. Data are expressed as the mean ± SD (n = 3). PBS: Phosphate buffered saline; GFAP: glial fibrillary acidic protein; SD: standard deviation.

