

fig4
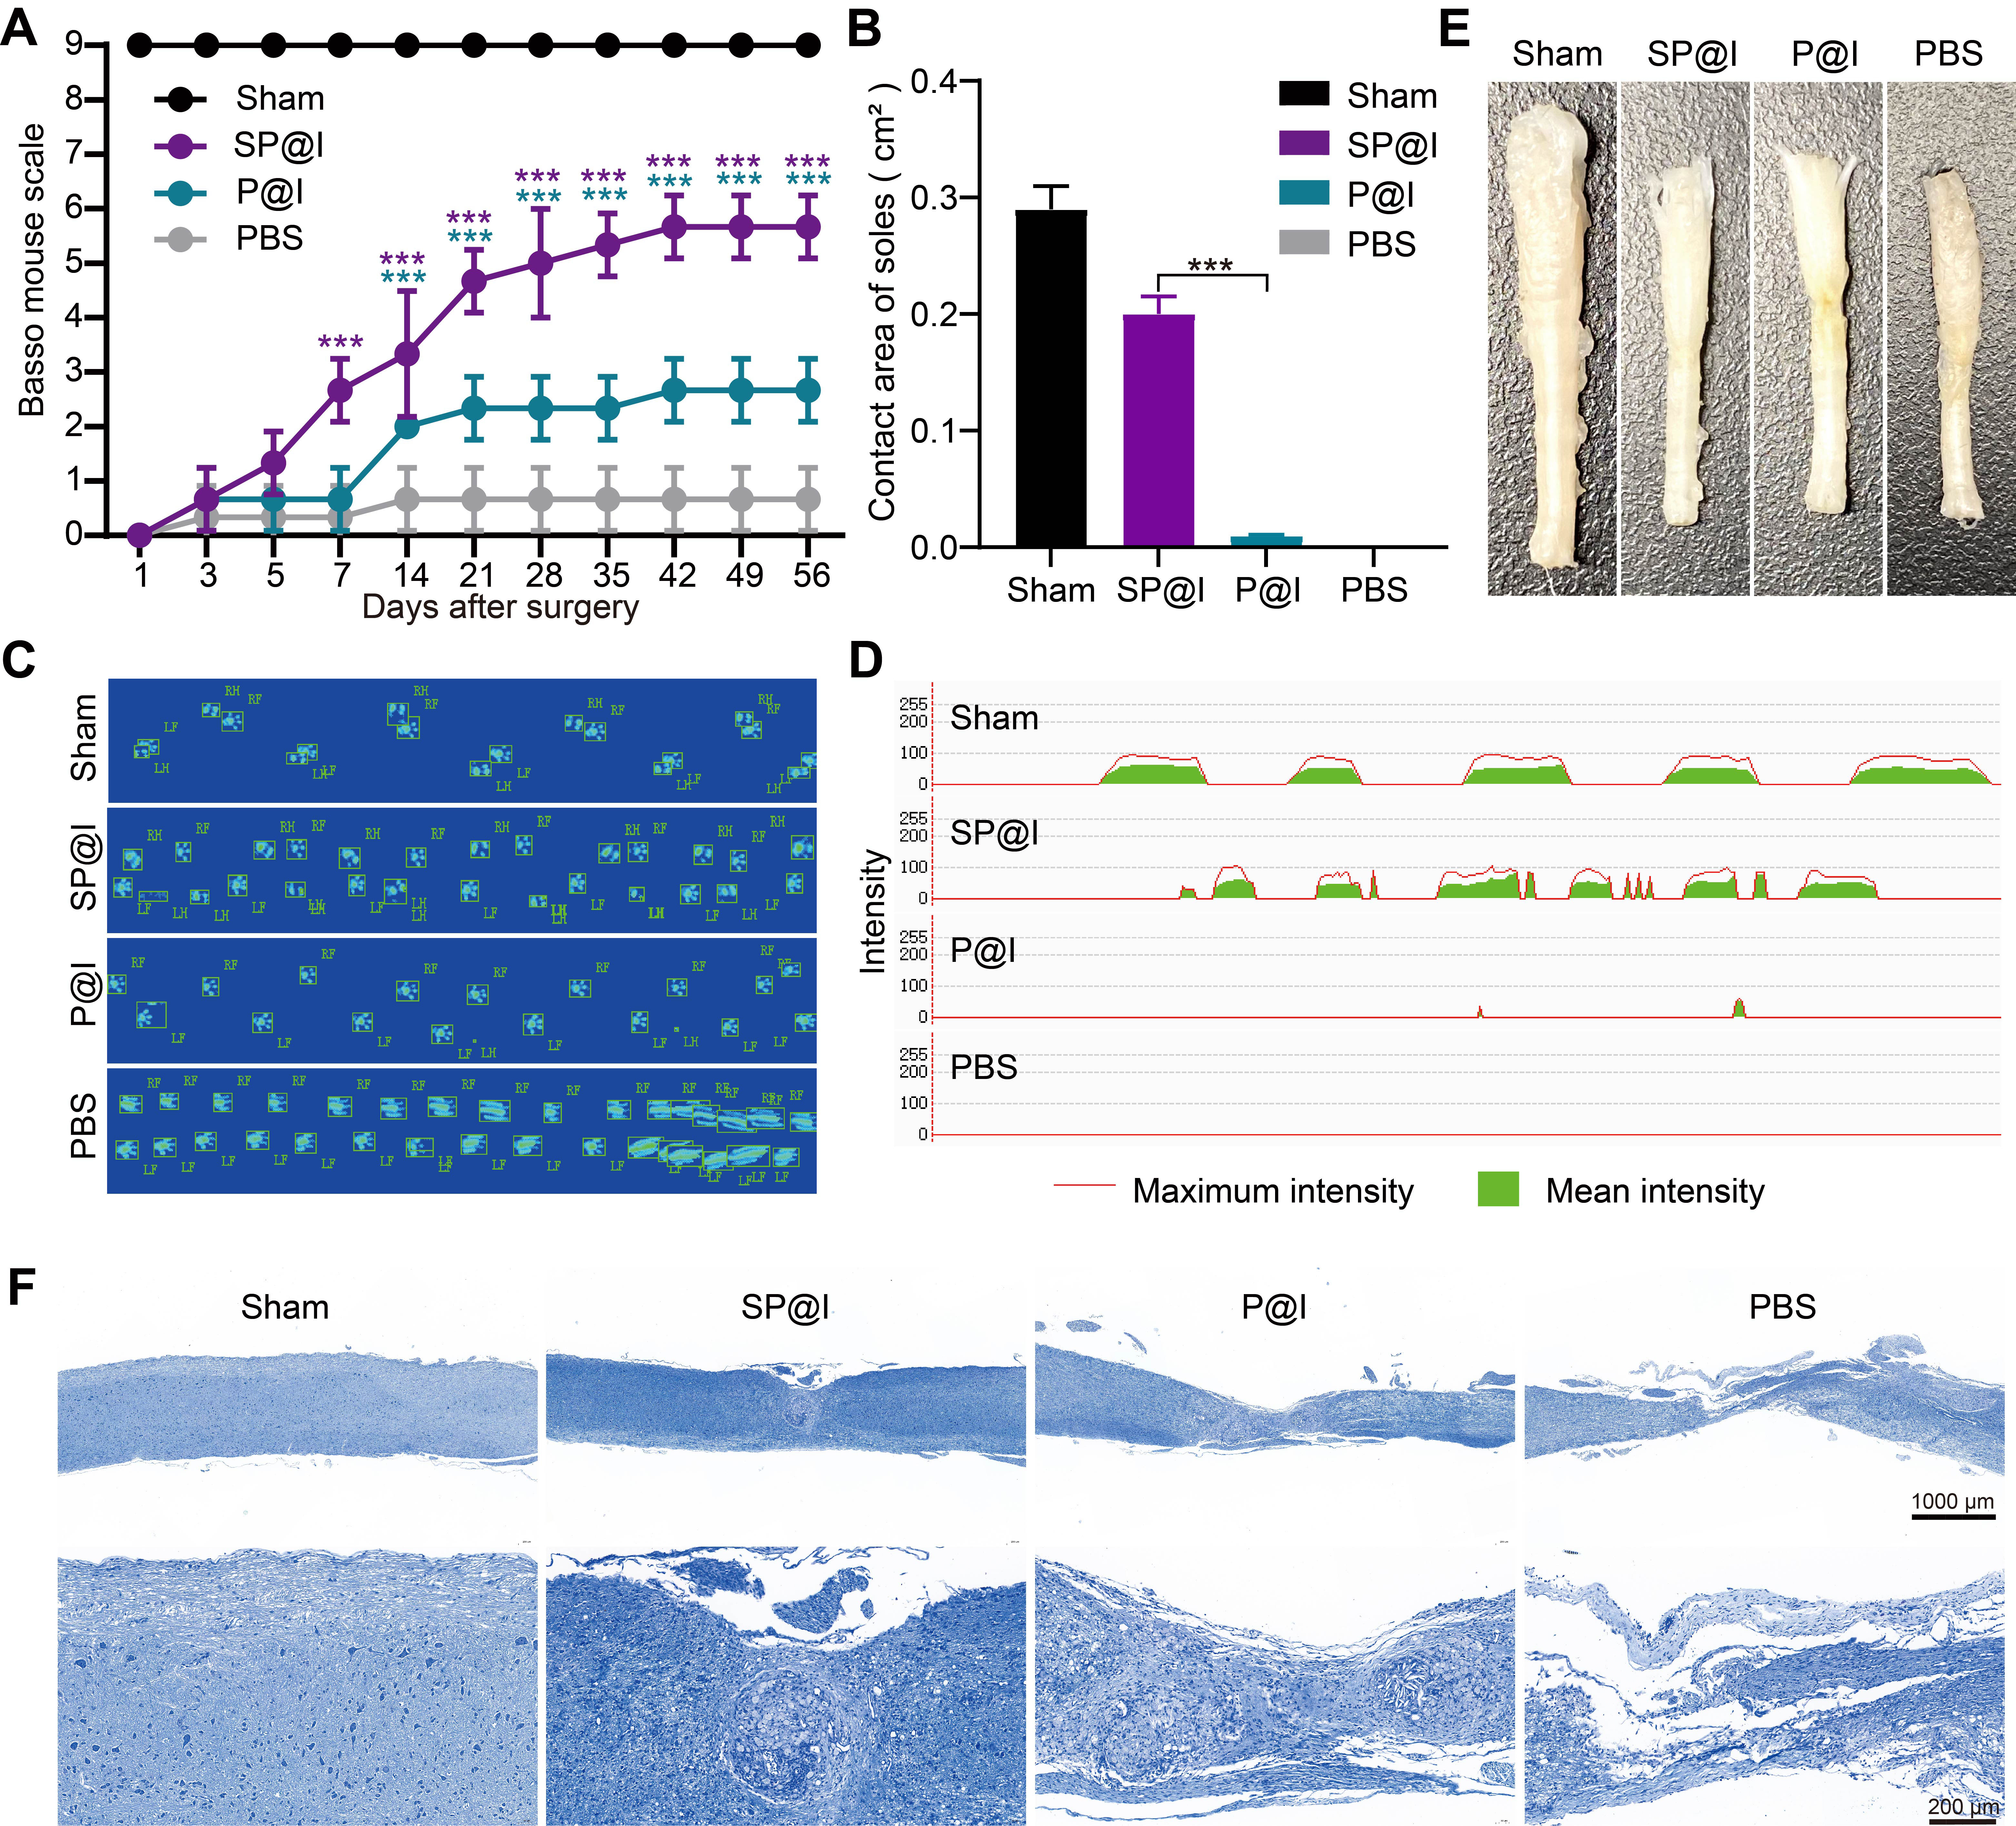
Figure 4. Functional and structural recovery after SCI. (A) BMS scores of each treatment group on the 1st, 3rd, 5th, and 7th day, and once a week until 8 weeks after model establishment. SP@I vs. P@I, P < 0.0001 (Day 7-56), P@I vs. PBS, P < 0.0001 (Day 14-56); (B) The area of the paw contacting the ground. SP@I vs. P@I, P < 0.001; (C) Footprints of mice in each treatment group on day 56; (D) The intensity of paw contact with the ground in each group on day 56; (E) Spinal cord morphology on day 56 for each treatment group; (F) Nissl staining of the spinal cord in each treatment group at 8 weeks. The upper scale bar is 1,000 μm, and the lower scale bar is 200 μm. Data are expressed as the mean ± SD (n = 3). PBS: Phosphate-buffered saline; LF: left forelimb; LH: Left hindlimb; RF: Right forelimb; RH: Right hindlimb. SCI: spinal cord injury; BMS: basso mouse scale; SD: standard deviation.

