

fig3
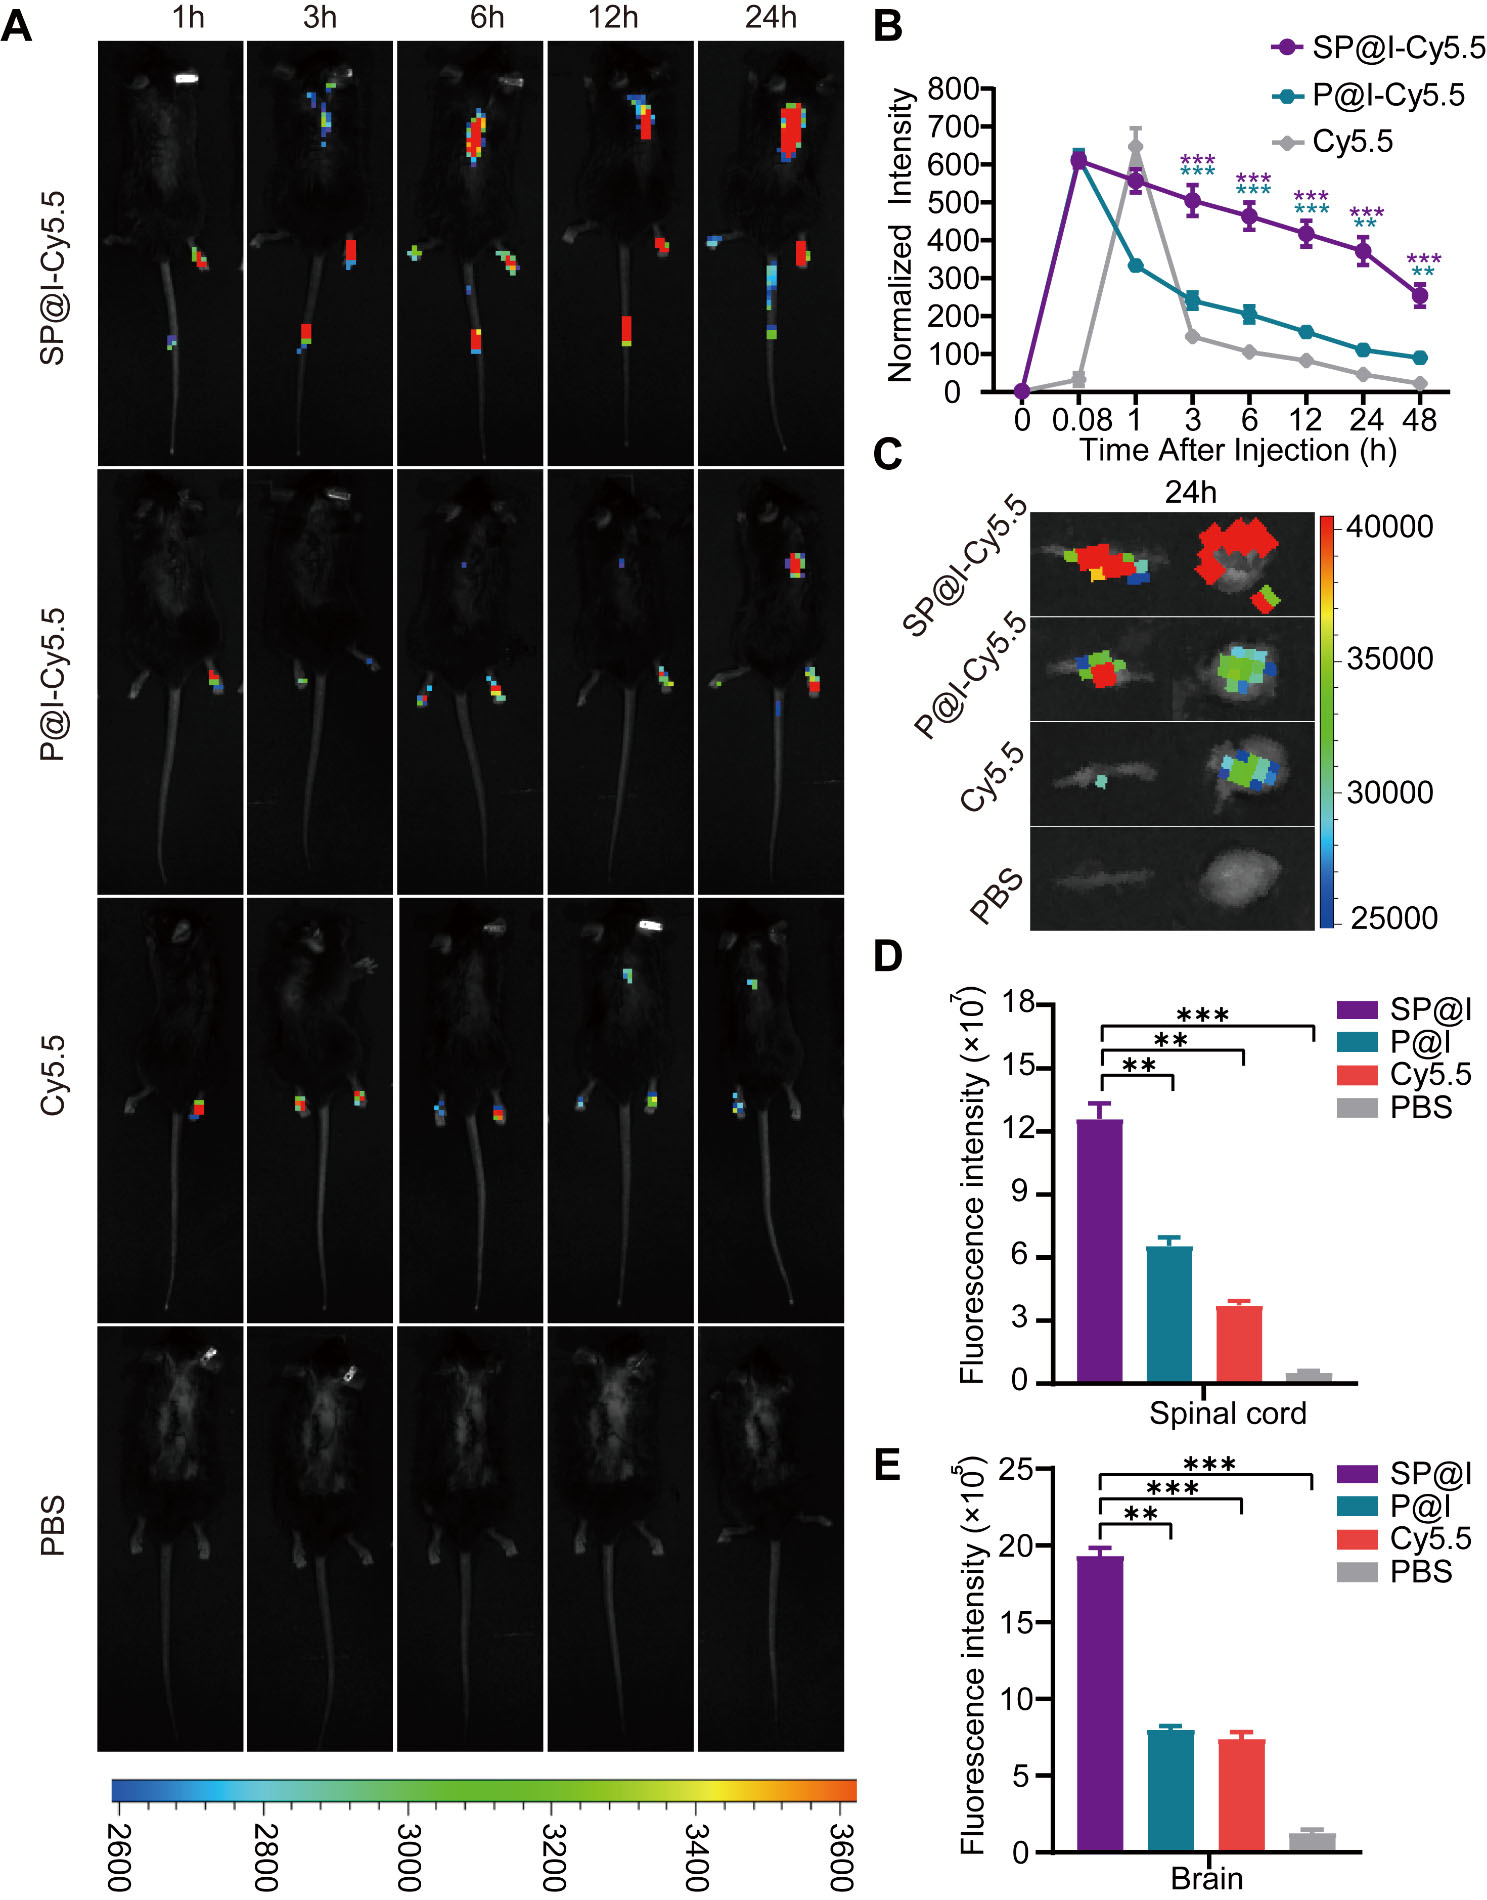
Figure 3. Pharmacokinetics and spinal cord enrichment of nanoparticles in mice. (A) In vivo imaging of mice at 1, 3, 6, 12, and 24 h after tail vein injection of [email protected], [email protected], Cy5.5, and PBS; (B) Plasma fluorescence intensity at 0 h, 5 min, 1 h, 3 h, 6 h, 12 h, 24 h, and 48 h after i.v. injection of [email protected], [email protected], Cy5.5. Statistical significance: [email protected] vs. [email protected], P < 0.001 (3-48 h); [email protected] vs. Cy5.5, P < 0.001 (3 h), P < 0.001 (6 h), P = 0.0006 (12 h), P = 0.0034 (24 h), P = 0.0022 (48 h). (C) Ex vivo imaging of the spinal cord and brain of mice at 24 h after tail vein injection of [email protected], [email protected], Cy5.5, and PBS. (D) Quantitative analysis of the spinal cord fluorescence at 24 h. SP@I vs. P@I, P = 0.0013; SP@I vs. Cy5.5, P = 0.0019; SP@I vs. PBS, P = 0.0010. (E) Quantitative analysis of the brain ex vivo imaging. SP@I vs. P@I, P = 0.0048; SP@I vs. Cy5.5, P = 0.0010; SP@I vs. PBS, P = 0.0004. Data are expressed as the mean ± SD (n = 3). PBS: Phosphate buffered saline; SD: standard deviation.

