

fig7
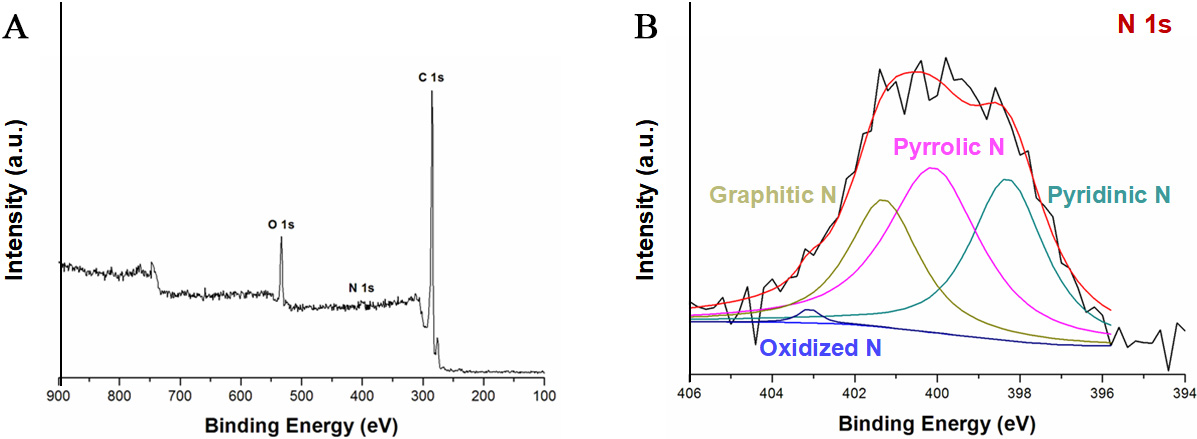
Figure 7. (A) XPS survey spectrum of Fe3O4@C-N microspheres; (B) High-resolution N 1s spectrum and peak deconvolution of Fe3O4@C-N: the black curve is the experimental data, the red curve is the overall fitted envelope, and the colored component peaks are assigned to pyridinic N (~ 398.3 eV), pyrrolic N (~ 400.0 eV), graphitic N (~ 401.3 eV), and oxidized N (~ 403.1 eV); the baseline/background used for fitting is also shown. XPS: X-ray photoelectron spectroscopy.

