


Zn-Ti-substituted M-type hexaferrites with large magnetocrystalline anisotropy and narrow ferromagnetic resonance linewidth for millimeter-wave self-biased application
 0
0 Abstract
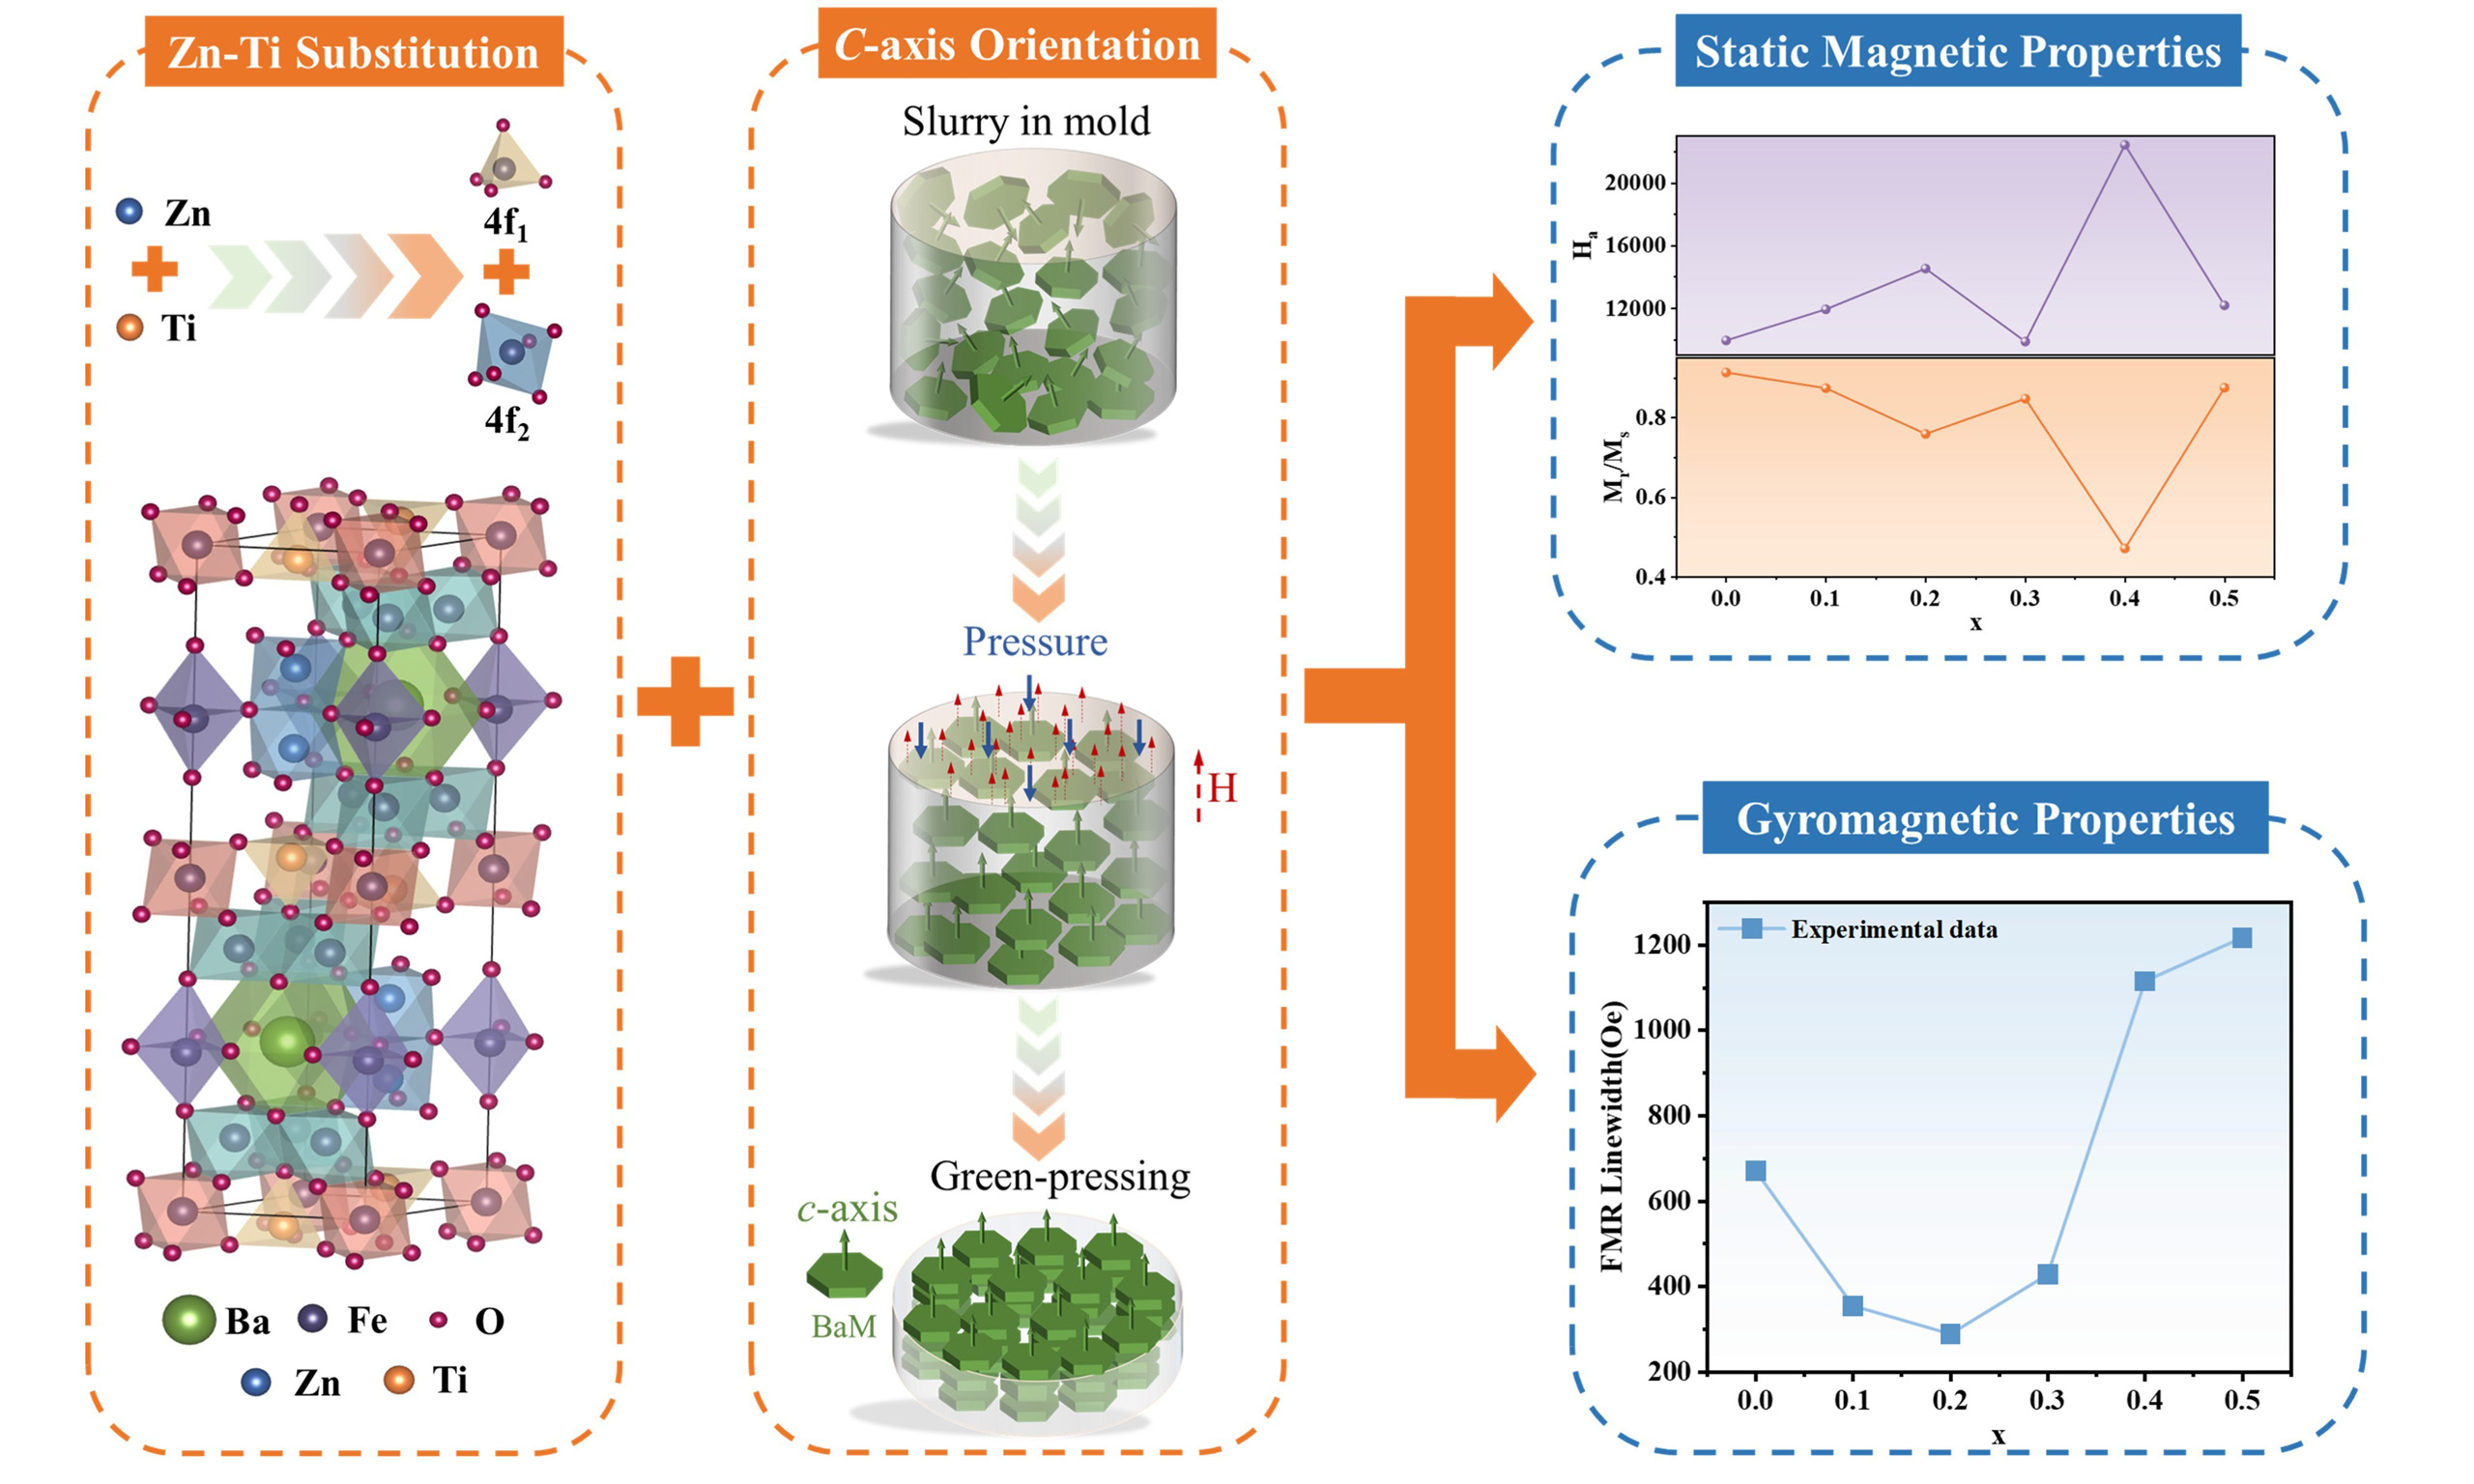
Large magnetocrystalline anisotropy field Ha and narrow ferromagnetic resonance (FMR) linewidth ΔH are obtained for M-type hexaferrites Ba(ZnTi)xFe12-2xO19 (BaM, x = 0.0 - 0.5) via the introduction of Zn-Ti co-substitution. Meanwhile, c-axis orientation provides effective access to the enhanced squareness ratio Mr/Ms. These gyromagnetic properties make the developed BaM particularly suitable as a substrate for a self-biased circulator at U band. Raman Spectroscopy indicates that Zn2+-Ti4+ ions tend to preferentially occupy the 4f1 and 4f2 sites as x < 0.1, and then gradually spread across all available sites as x increases, which is consistent with the trend observed in saturation magnetization Ms. Outstanding magnetic properties are simultaneously achieved at x=0.1, including Ms = 55.84 emu/g, Ha = 11,930 Oe, and Mr/Ms = 0.87. In particular, the narrowest FMR linewidth (ΔH = 289 Oe at 59 GHz) is realized as x = 0.2, lower than previously reported values for BaM.
Keywords
INTRODUCTION
The rapid development of active phased-array radar (APAR) and 5G massive multiple-input multiple-output (MIMO) technology has led to an increasing demand for microwave transmit/receive (T/R) modules in modern military and civilian communication systems[1,2]. In T/R modules, circulators are key non-reciprocal devices that enable unidirectional signal transmission and isolation, and their performance directly affects system stability and efficiency. Conventional circulators typically employ garnet or spinel ferrites as gyromagnetic materials and rely on external permanent magnets to provide a bias field because their magnetocrystalline anisotropy field (Ha) is insufficient. However, pushing operating frequencies into the millimeter-wave range demands significantly stronger bias fields, which in turn require permanent magnets with larger volumes and greater weight, making device planarization and integration increasingly difficult[3]. Consequently, the development of self-biased circulators that do not require or decrease the volume of external magnets has become an important research direction in microwave ferrite materials and devices. Hexaferrites are considered ideal materials for self-biased circulators due to their high magnetocrystalline anisotropy field (Ha), which can provide an equivalent internal bias field[4]. Among them, BaM hexaferrite (BaFe12O19) has attracted considerable attention because of its simple crystal structure, ease of synthesis, high Curie temperature, large saturation magnetization (Ms), and strong uniaxial anisotropy[5]. However, hexaferrite-based circulators exhibit higher insertion loss than traditional spinel or garnet-based circulators. To overcome this drawback, c-axis-oriented BaM polycrystalline materials are developed by magnetic-field alignment to achieve high remanence ratios (Mr/Ms) along the c-axis, which helps reduce low-field losses and improve circulator performance[6], as well as introducing ion substitution to regulate magnetic properties, especially for Ha and FMR linewidth ΔH.
At present, investigations into M-type hexaferrites are primarily directed toward tailoring magnetic properties through selective ionic substitution at the five distinct Fe3+ crystallographic sites (spin-up: 2a, 2b, 12k; spin-down: 4f1, 4f2)[7-9]. Among the various substitution strategies, introducing divalent and tetravalent cations simultaneously has proven especially effective in modulating the static and dynamic magnetic properties of hexaferrites. In this context, the Zn2+-Ti4+ co-substitution system has attracted considerable attention due to its pronounced ability to tune key magnetic parameters, including saturation magnetization, magnetocrystalline anisotropy, and coercivity. Achieving targeted property tailoring requires a clear understanding of where exactly the substituting ions preferentially occupy within the crystal structure and how their site preferences relate to the observed changes in magnetic properties. A range of approaches has been developed for this purpose. Among these, direct experimental evidence has been provided by spectroscopic and diffraction techniques. Mössbauer spectroscopy studies by González-Angeles et al. demonstrated that at low substitution levels, Zn2+ ions preferentially occupy the tetrahedral 4f1 down-spin site, whereas Ti4+ ions exhibit a marked tendency to enter the octahedral 4f2 down-spin site, with a secondary preference for the 2a up-spin site at higher substitution levels[10]. This selective occupation of the spin-down sublattices by non-magnetic cations reduces the negative contribution to the net magnetization, thereby leading to an initial enhancement in saturation magnetization (Ms). Complementary neutron diffraction measurements performed by Wartewig et al. confirmed that nearly all Zn2+ cations reside on the 4f1 tetrahedral site. However, Ti4+ cations are distributed with comparable probability between the 4f2 and 12k octahedral sites[11]. The incorporation of non-magnetic Ti4+ ions into the 12k up-spin sublattice at elevated substitution levels progressively weakens the overall superexchange interactions, leading to a reduction in both the saturation magnetization and the magnetocrystalline anisotropy field (Ha). In contrast, an alternative class of studies infers ion occupation indirectly from changes in macroscopic magnetic behavior. More recently, Solizoda et al. investigated the aliovalent substitution of Ti4+ in BaM and proposed that Ti4+ ions primarily enter the 12k octahedral site. At the same time, the charge compensation mechanism induces partial reduction of Fe3+ to Fe2+ at the 4f2 site[12]. This redistribution of cation valences and the associated modification of Fe-O-Fe superexchange pathways further influence the magnetic anisotropy and contribute to the observed reduction in coercivity.
Even with these investigations, the precise site preference of Ti4+ ions, especially whether they favor the 4f2 or the 12k site, has not yet been conclusively determined. Moreover, the existing studies have primarily focused on static magnetic properties. However, from the perspective of millimeter-wave gyromagnetic applications, a critical parameter is the ferromagnetic resonance (FMR) linewidth (ΔH), which directly dictates the intrinsic insertion loss of self-biased devices. Although the studies mentioned above offer useful insights into controlling static magnetic properties, systematic research on Zn2+-Ti4+ co-substituted, c-axis-oriented BaM hexaferrites, with a specific focus on reducing the FMR linewidth, remains very limited. This study aims to synthesize c-axis-oriented Ba(ZnTi)xFe12-2xO19 (x = 0.0 - 0.5 in increments of 0.1) through a high-temperature solid-state reaction combined with magnetic-field orientation. The effect of Zn2+-Ti4+ doping on the properties of M-type hexaferrites is investigated primarily by tailoring magnetic parameters such as the anisotropy field Ha, the squareness ratio Mr/Ms, and the FMR linewidth ΔH, and exploring their potential as gyromagnetic materials for millimeter-wave self-biased circulators.
EXPERIMENTAL
A series of Ba(ZnTi)xFe12-2xO19 samples with x = 0.0 - 0.5, in increments of 0.1, were synthesized through a high-temperature solid-state reaction, the detailed flow chart of which is presented in Figure 1. Stoichiometric ratios of raw materials, BaCO3, ZnO, TiO2, and Fe2O3 with a purity of 99% (MACKLIN), were weighed and transferred into six ball-milling jars. To each jar, 300 mL of deionized water was added, and the mixture was milled in a planetary ball mill at 300 rpm for 12 h. After drying at 100 °C, the mixed powders underwent pre-sintering at 1,250 °C in air for 4 h. Next, 8 wt% dispersant (C21H14Na2O6S2, NNO, MACKLIN) was introduced into each batch, and a secondary milling step was performed at 500 rpm for 24 h. The resulting slurry was then poured into a mold and compacted into cylindrical bodies with a diameter of
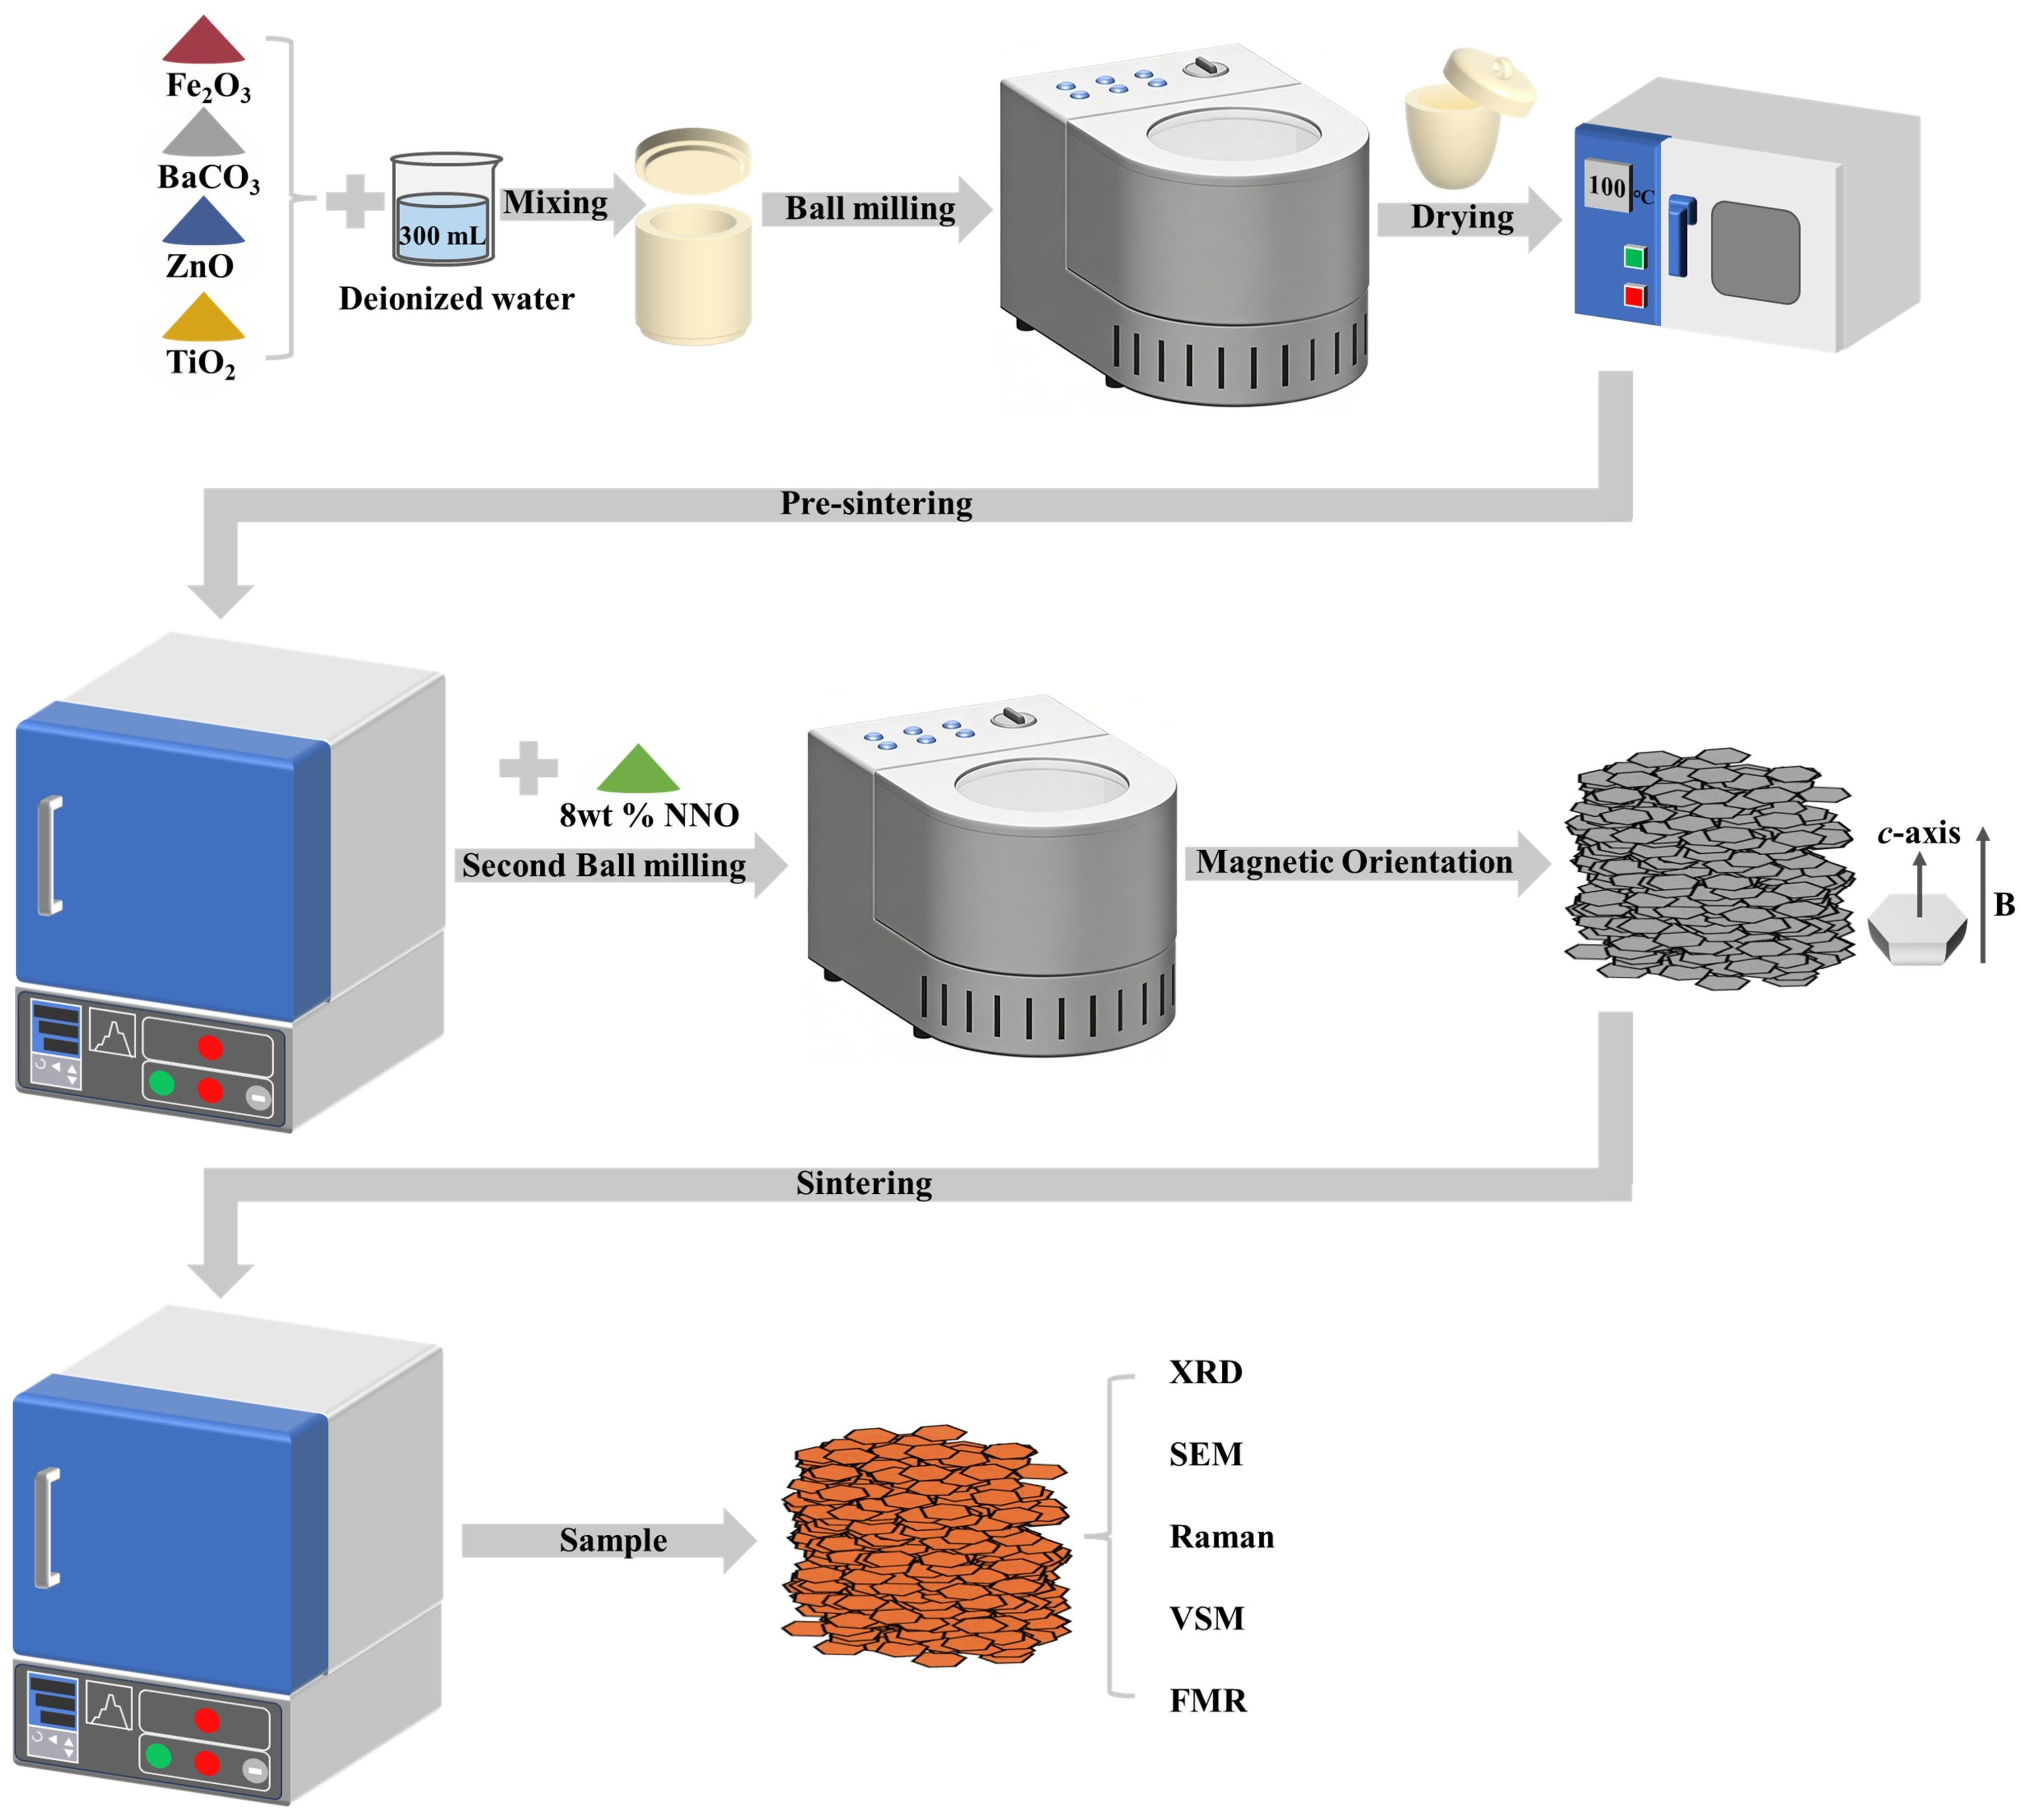
Figure 1. Preparation and magnetic field orientation process details. XRD: X-ray diffraction; SEM: scanning electron microscopy; VSM: vibrating sample magnetometer; FMR: ferromagnetic resonance.
After the secondary ball-milling step, the particle size distribution of the resulting slurry was determined by wet laser diffraction on a Mastersizer 2000 (Malvern Panalytical, UK). The volume fraction corresponding to each particle size interval was then evaluated. According to magnetic-domain theory, the dominant magnetization mechanism in single-domain or quasi-single-domain particles is irreversible spin rotation. In the absence of domain walls, magnetic moments readily align along the crystallographically easy axis (c-axis) under an applied magnetic field and retain this orientation after the field is removed, thereby enabling a high remanence ratio (Mr/Ms). In comparison, multi-domain particles magnetize through irreversible domain-wall displacement accompanied by Barkhausen jumps, a process strongly influenced by internal stress fluctuations and grain-boundary effects, resulting in a weaker magnetic response that is generally unfavorable for achieving high c-axis orientation and remanence. Hence, controlling the particle size through the second ball-milling step to obtain a majority of single-domain or quasi-single-domain particles is crucial. According to Figure 2, particles smaller than 10.67 μm and 18.28 μm account for cumulative volume fractions of 50% and 90%, respectively. Even though most particles exceed the single-domain size threshold of < 1.3 μm[13], the overall size distribution remains relatively homogeneous. A relatively uniform particle size distribution reduces the variation in alignment resistance that typically arises from size disparities during magnetic field orientation, thereby improving overall texture quality and promoting a higher degree of c-axis alignment in the final material.
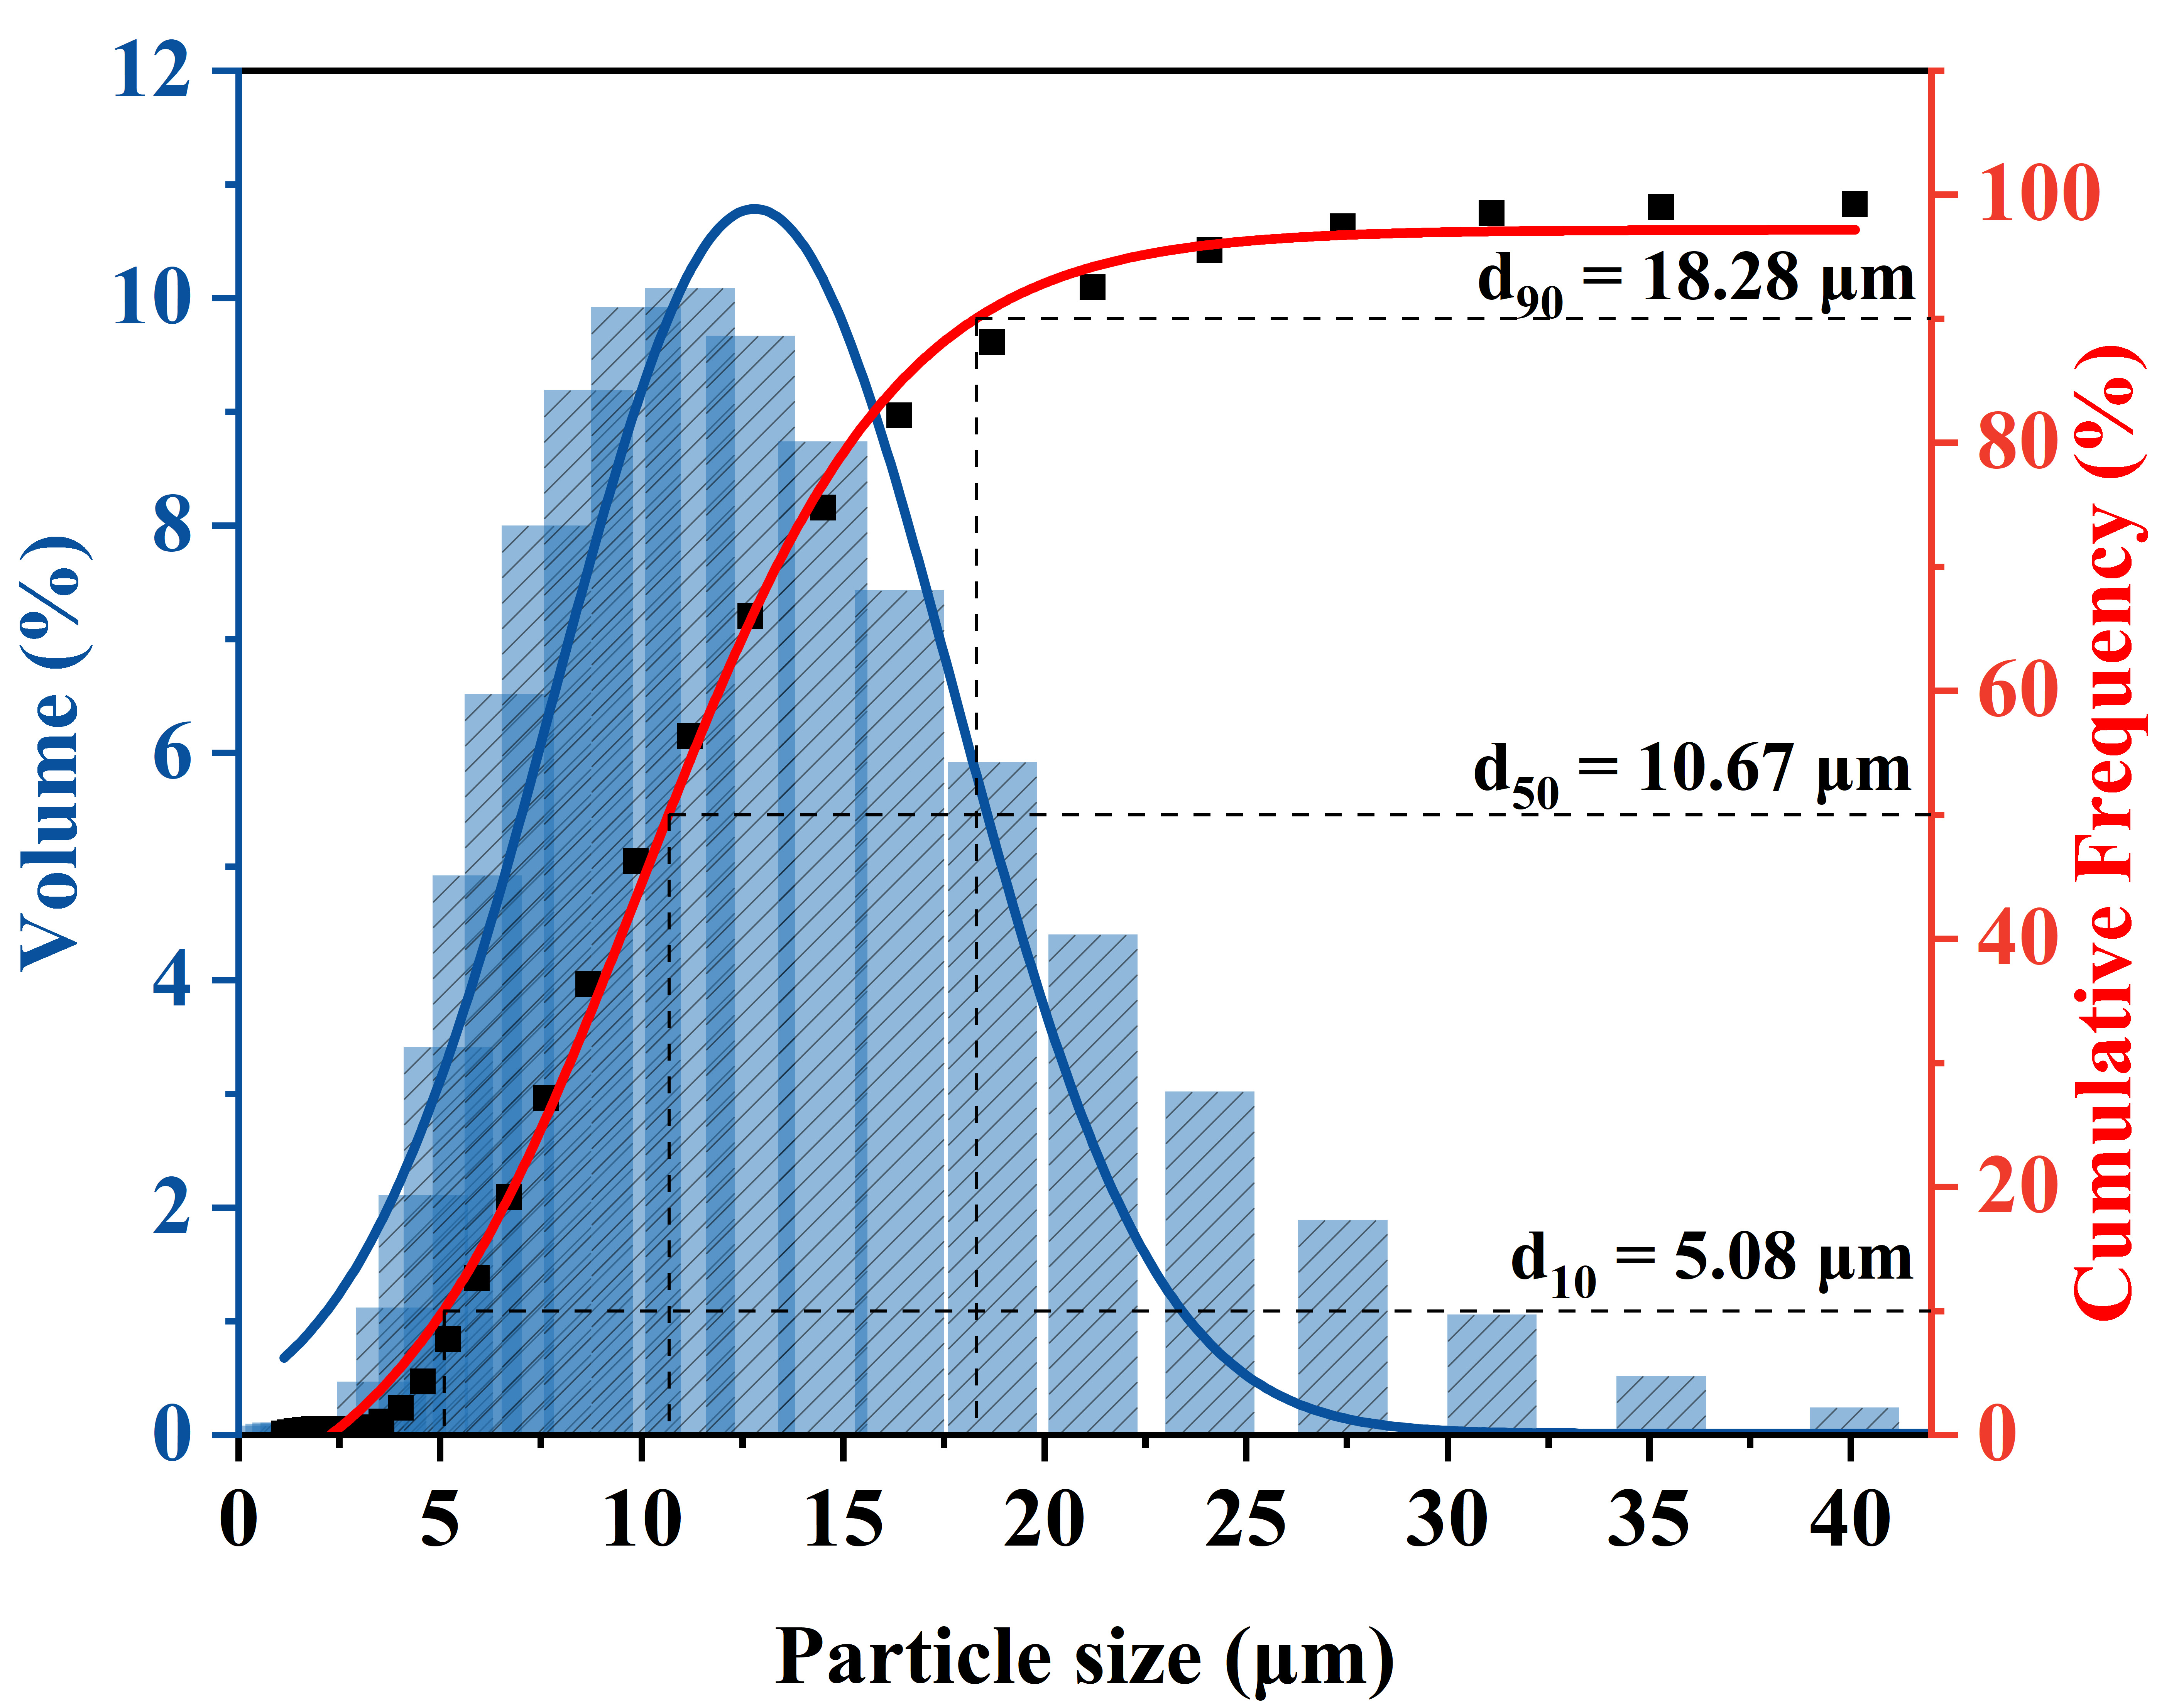
Figure 2. Particle size distribution of Ba(ZnTi)xFe12-2xO19 (x = 0.3).
X-ray diffraction (XRD, D8 Advance, Bruker, Germany) was employed for phase analysis over a 2θ range of 20°-80°. Rietveld refinement was then performed to determine the lattice parameters. Field-emission scanning electron microscopy (SEM, Apreo 2C, Thermo Scientific, USA) was used to examine the microstructure. Raman spectroscopy (DXR3, Thermo Scientific, USA) was conducted with a 532 nm laser excitation source. Magnetic hysteresis loops were recorded using a vibrating sample magnetometer (VSM, 8600, Lake Shore, USA), with the external field oriented along the crystallographic c-axis. Saturation magnetization (Ms), coercivity (Hc), and remanence ratio (Mr/Ms) were determined. For FMR measurements, samples were cut into plates measuring 4.0 × 4.0 × 0.8 mm3 and attached to a coplanar waveguide (CPW). The fixture was then carefully positioned at the geometric center of the electromagnet pole gap, ensuring the sample was exposed to a highly uniform static magnetic field throughout the measurement. Resonance absorption was detected by monitoring the S21 transmission parameter using a vector network analyzer (VNA, Ceyear 3674G) while a static magnetic field was applied to the sample through an electromagnet.
RESULTS AND DISCUSSION
Phase formation and microstructure
XRD patterns of oriented and non-oriented BaM (x = 0.3) are compared in Figure 3A. Both sets of diffraction peaks match well with the standard BaM-type hexaferrites pattern (PDF#27-1029), confirming the formation of a pure M-type hexaferrite phase with space group P63/mmc. After normalization to the strongest peak, the oriented sample shows increased relative intensities of the (00l) reflections. Combined with the Lotgering factor fL = 0.57 calculated from the XRD patterns, these results confirm a well-developed c-axis texture. Figure 3B shows XRD patterns of oriented Ba(ZnTi)xFe12-2xO19 with different x. All samples exhibit single-phase M-type structure, but diffraction intensities vary irregularly, reaching a maximum at x = 0.3. Figure 3C displays a magnified view of the (203) peak. The ionic radius of Zn2+ (0.74 Å) is larger than that of Fe3+ (0.64 Å), while that of Ti4+ (0.60 Å) is smaller[14]. If ionic size alone governed the structural response, the interplanar spacing of the (203) plane would be expected to shift monotonically as the substitution level x increases. However, as shown in Figure 3C, the (203) peak exhibits a non-monotonic angular variation: it shifts progressively to higher angles for x = 0.1 - 0.3. Then it shifts back to lower angles for x = 0.4 and 0.5. The underlying mechanism responsible for this behavior involves composition-dependent site occupancy by Zn2+ and Ti4+ ions and is discussed in detail in Section 3.2, supported by Raman spectroscopy analysis. Nevertheless, the observed irregular shift of the (203) peak already confirms the successful doping of Zn2+ and Ti4+ ions into the BaM lattice.
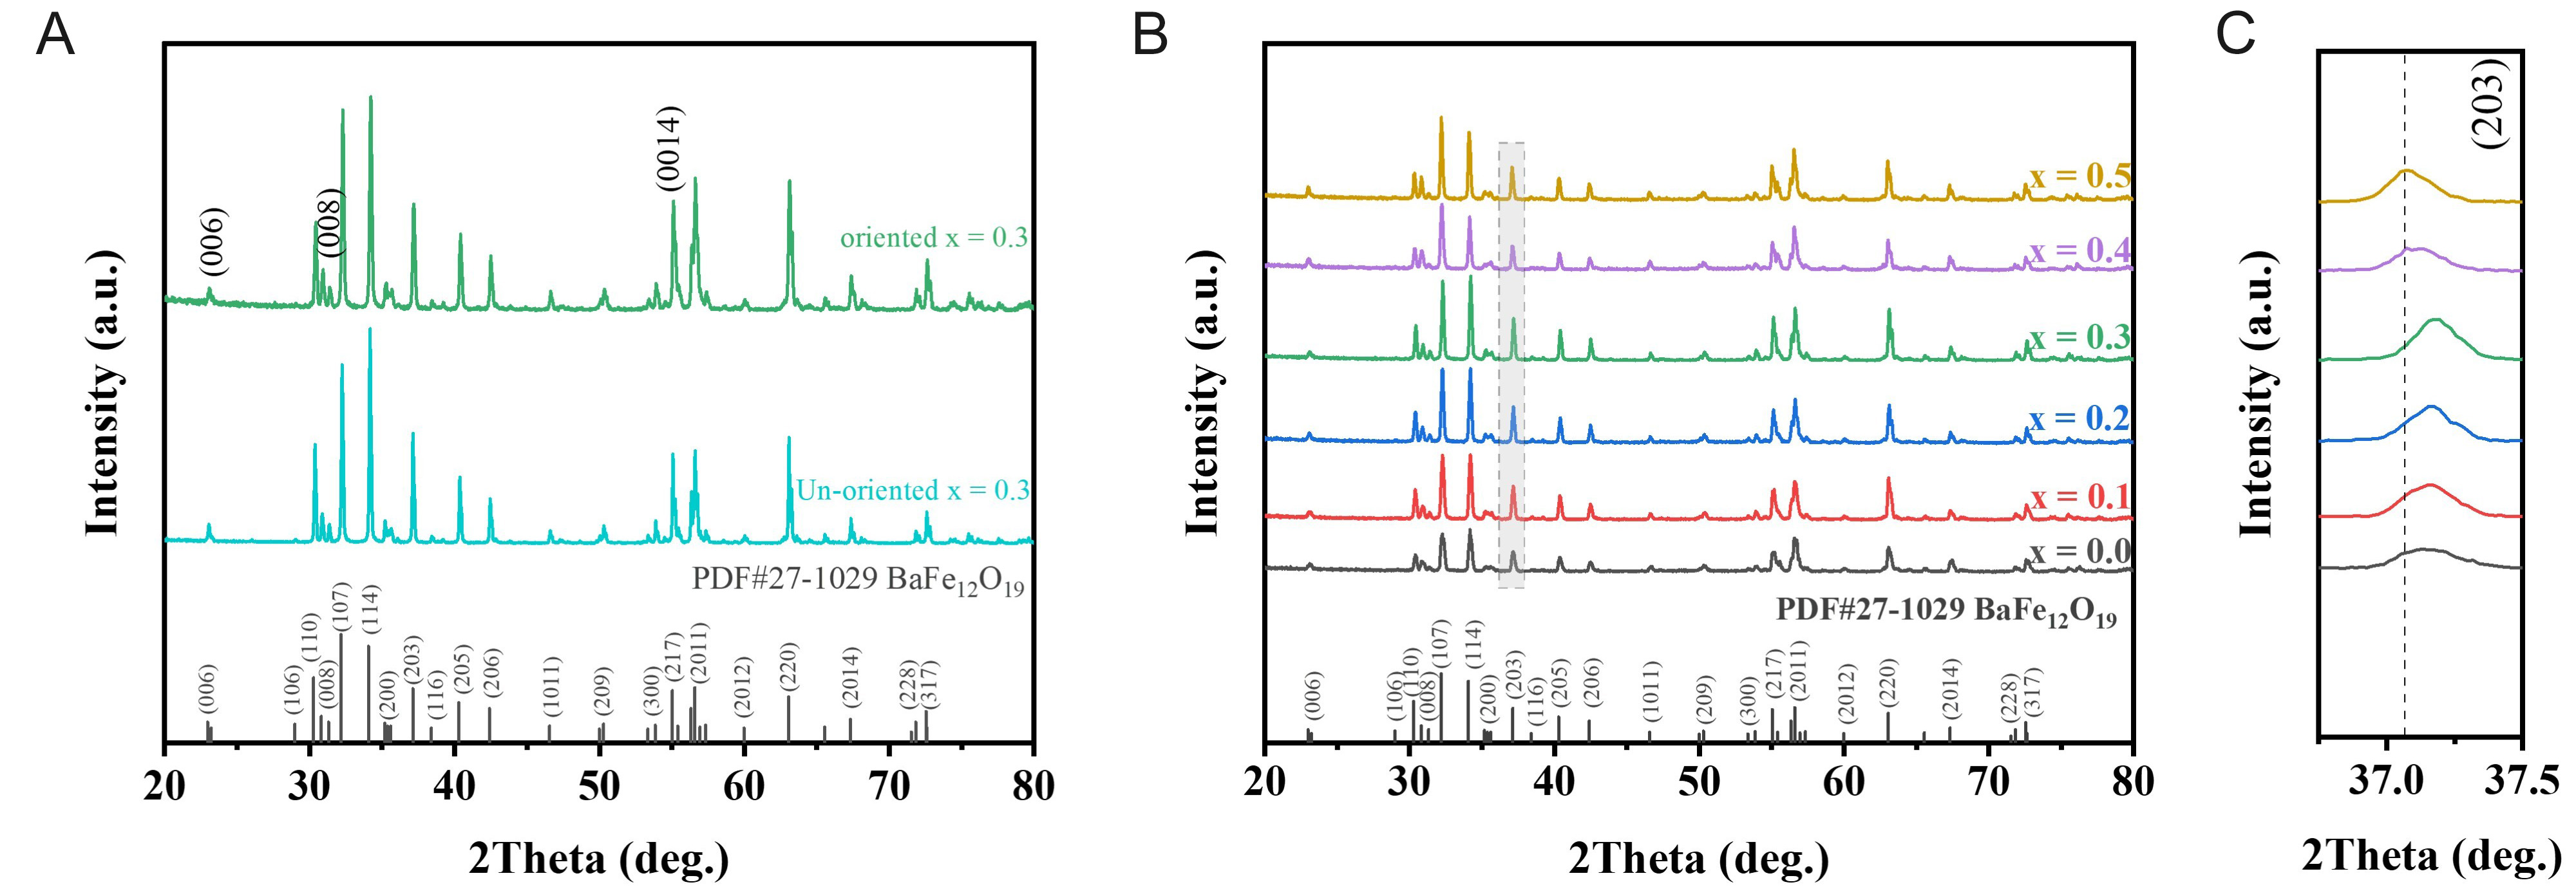
Figure 3. (A) Comparison of the oriented and non-oriented XRD patterns of BaM (x = 0.3); (B) XRD patterns of Ba(ZnTi)xFe12-2xO19 hexaferrites; (C) Magnified view of the XRD diffraction peak of the (203) crystal plane. XRD: X-ray diffraction.
Rietveld refinement was carried out using the General Structure Analysis System (GSAS) program. Figure 4A-F presents the Rietveld refinement patterns for all compositions, where the observed data (Obs) are shown as × symbols, the calculated profile (Cal) as a red curve, the difference curve (Obs-Cal) as a blue curve, and the Bragg peak positions (Bragg) as vertical purple tick marks. Refined lattice parameters (a, c, c/a, Vcell) and the corresponding goodness of fit (χ2) are listed in Table 1. The relatively low χ2 values confirm the reliability of the refined lattice parameters. The c/a ratios are all below 3.98, confirming the hexagonal structure[15]. Notably, the lattice parameters exhibit a non-monotonic variation with increasing substitution level x. This behavior can be rationalized by the combined effects of site-occupation preference and doping level, a point that will be further clarified in Section 3.2 using Raman spectroscopy.
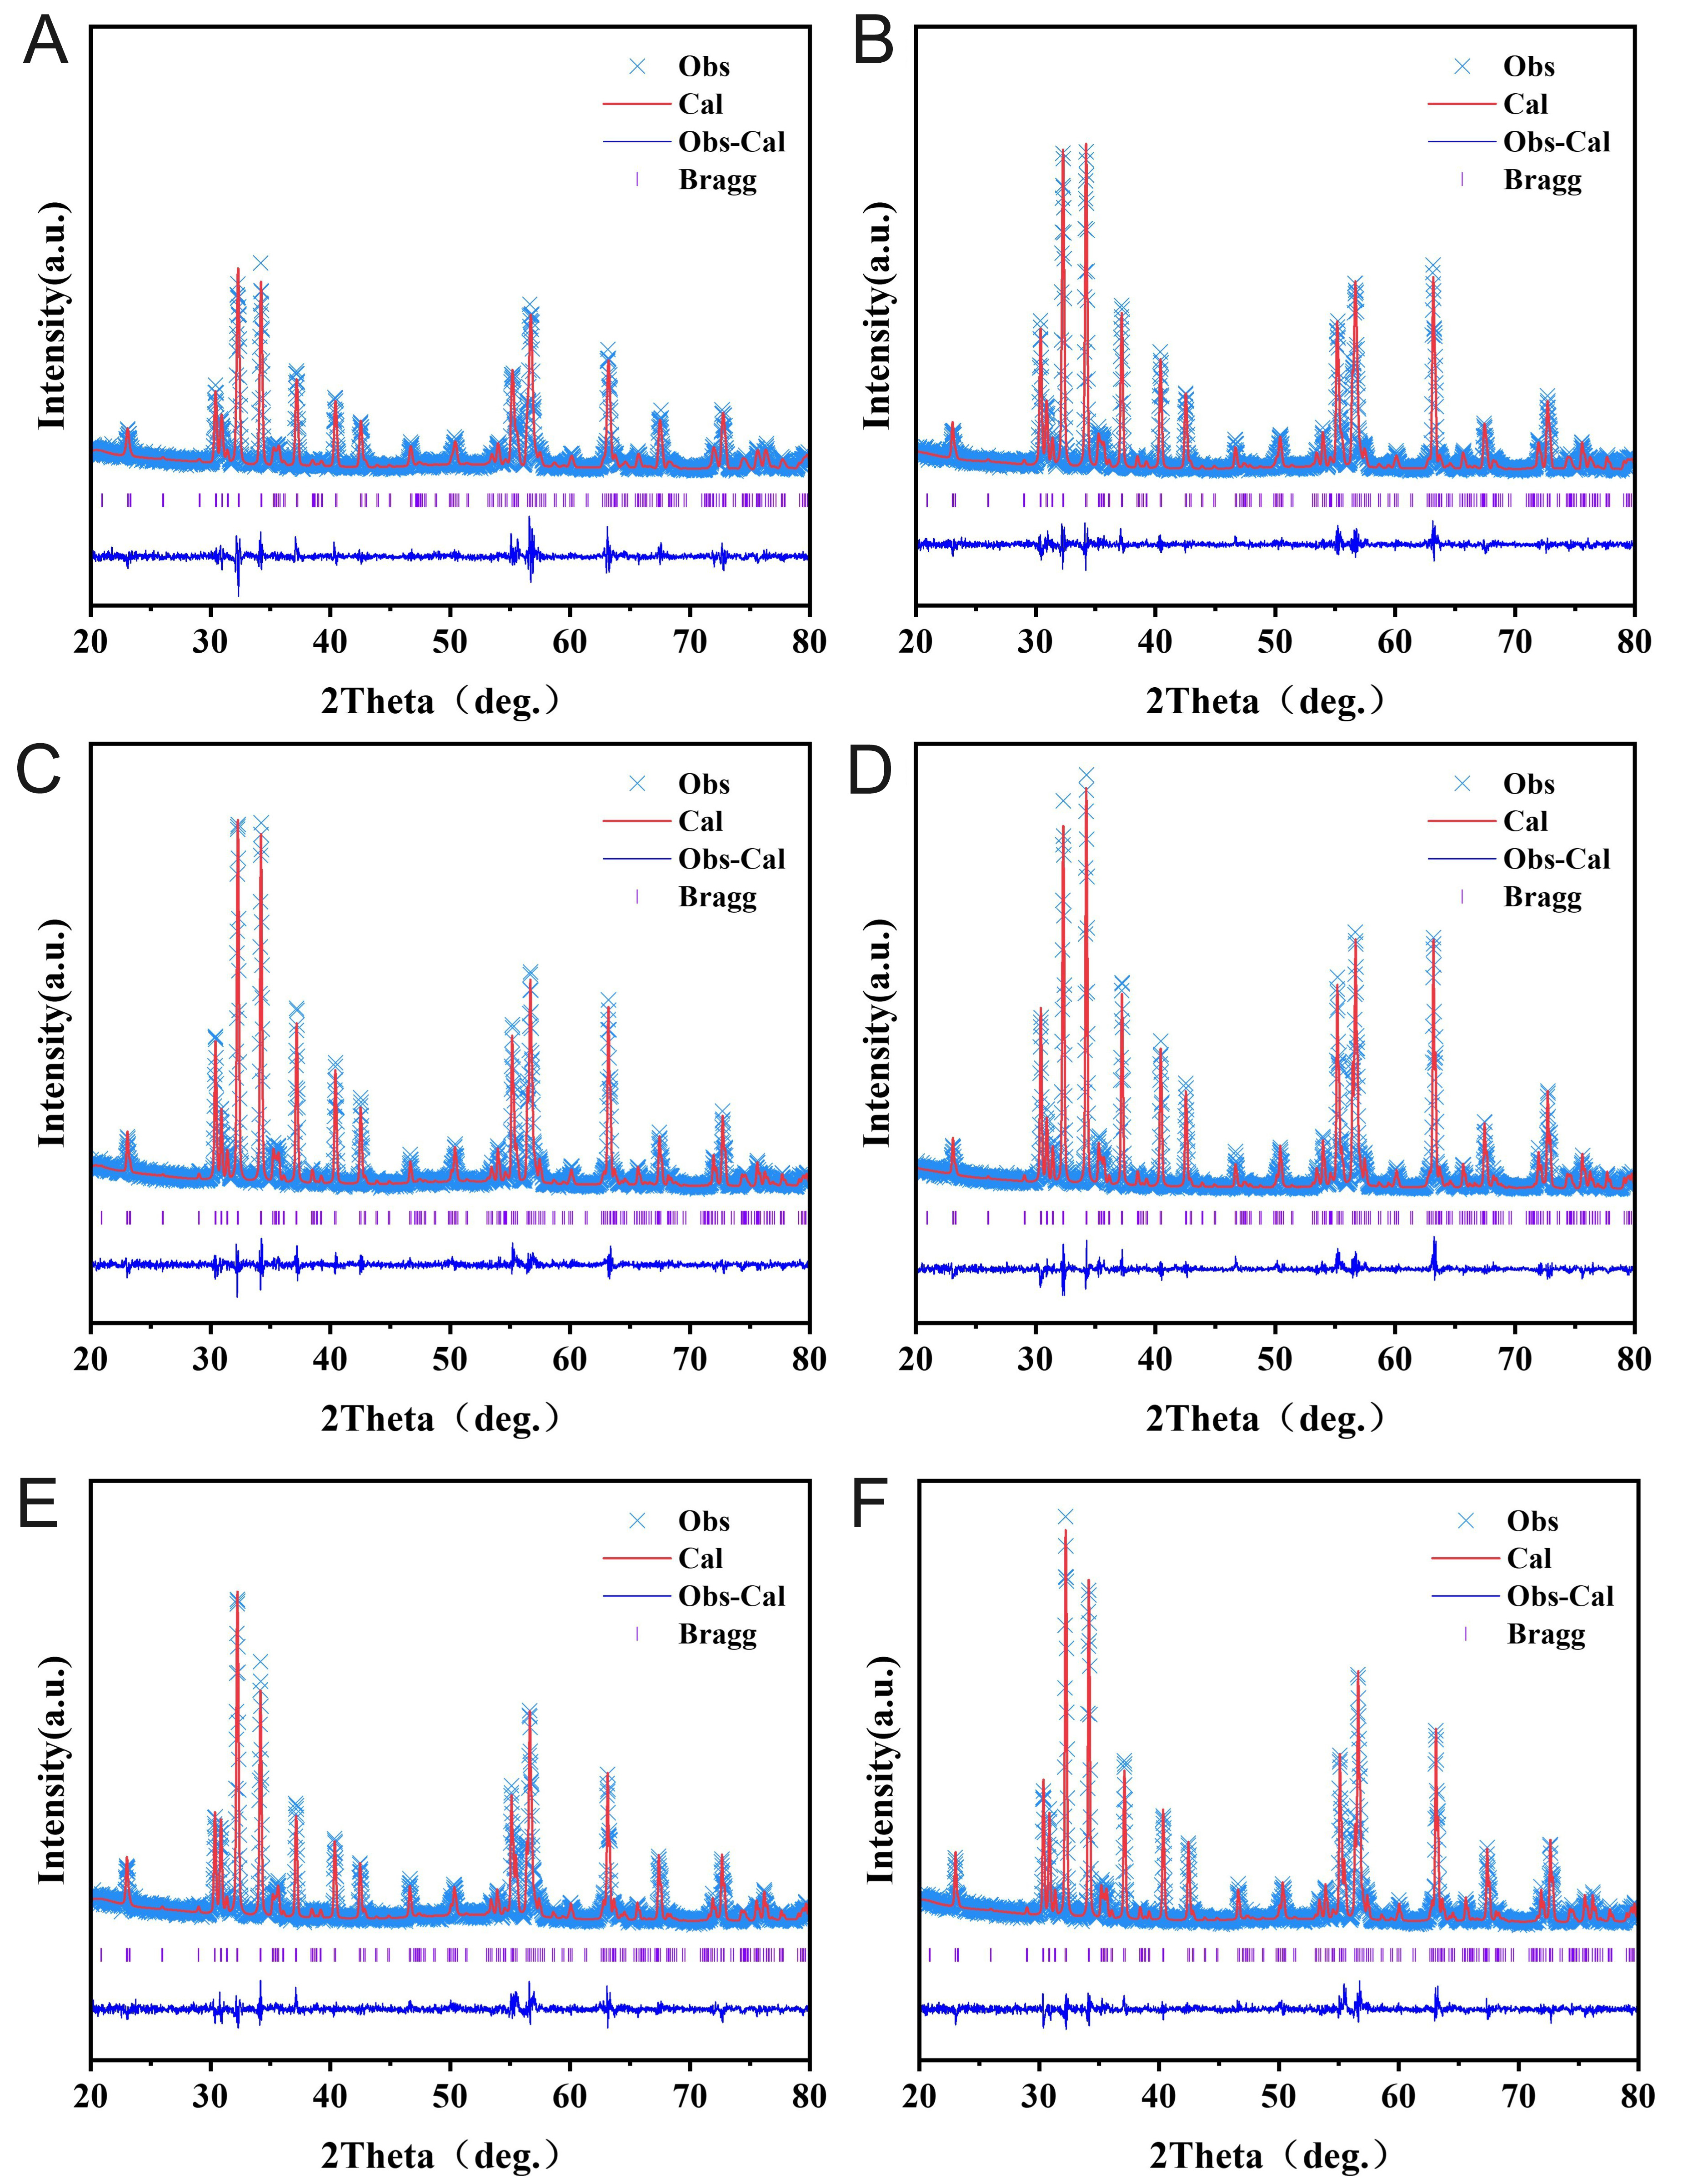
Figure 4. Rietveld refined XRD pattern of Ba(ZnTi)xFe12-2xO19: (A) x = 0.0, (B) x = 0.1, (C) x = 0.2, (D) x = 0.3, (E) x = 0.4 and (F) x = 0.5. XRD: X-ray diffraction.
Lattice parameters, goodness of fit, and texture metrics of all samples
| x | Lattice parameters | Goodness of fit | Texture metrics | |||||
| a (Å) | c (Å) | c/a | Vcell (Å) | χ2 | fL | ρ (g/cm3) | p (%) | |
| 0.0 | 5.8901 (6) | 23.1942 (1) | 3.9378 | 696.89 (7) | 1.51 | 0.57 | 4.72 | 7.39 |
| 0.1 | 5.8904 (2) | 23.1919 (5) | 3.9372 | 696.87 (4) | 1.35 | 0.57 | 4.73 | 7.21 |
| 0.2 | 5.8898 (1) | 23.1857 (7) | 3.9365 | 696.55 (6) | 1.30 | 0.59 | 4.75 | 6.91 |
| 0.3 | 5.8876 (7) | 23.1696 (3) | 3.9353 | 696.56 (4) | 1.36 | 0.49 | 4.56 | 10.50 |
| 0.4 | 5.8908 (0) | 23.1900 (5) | 3.9366 | 696.91 (8) | 1.42 | 0.48 | 4.30 | 15.68 |
| 0.5 | 5.8919 (2) | 23.1960 (5) | 3.9369 | 697.36 (2) | 1.34 | 0.47 | 4.14 | 18.70 |
The Lotgering factor (fL), defined by Equation (1) [16], provides a quantitative measure of the degree of c-axis texture in BaM as follows.
Here, ∑I (00l)/∑I (hkl) represents the ratio of the sum of XRD intensities from (00l) planes to that from all (hkl) planes for the oriented sample. Moreover, ∑I0 (00l)/∑I0 (hkl) is the corresponding ratio for randomly oriented BaM without preferred orientation. Based on the equation and XRD patterns, the calculated fL values are summarized in Table 1. For instance, at x = 0.1, fL reaches 0.57. Generally, fL increases with a higher c-axis orientation[17]. While a high degree of c-axis orientation plays an important role in achieving a high remanence ratio, the extent of grain growth during sintering also has a strong influence on the final remanence ratio of the material. Bulk density (ρ) was determined using the drainage method of Archimedes [Table 1]. Moreover, the overall porosity (p) is defined by Equation (2) as follows[18].
In these expressions, ρx denotes the X-ray density as given in Equation (3)[18]. At the same time, the symbols Z, M, NA, and Vcell correspond to the number of formula units per unit cell, the molecular weight, Avogadro’s constant, and the unit cell volume, respectively. Previous studies have consistently shown that porosity significantly influences the FMR behavior of hexaferrites, with lower-porosity samples exhibiting narrower FMR linewidths[19]. A quantitative analysis of the FMR linewidth and its dependence on porosity is presented below.
SEM images of oriented Ba(ZnTi)xFe12-2xO19 are presented in Figure 5A-F. The microstructural morphology shows a clear dependence on the amount of Zn2+ and Ti4+ incorporated into the BaM lattice. A typical hexagonal platelet morphology is observed across the entire sample surface, consistent with the c/a ratio obtained from XRD refinement. Moreover, no obvious agglomeration is observed in the SEM images, resulting in a compact microstructure. The sample with x = 0.1 shows the most uniform distribution of hexagonal grains with minimal inter-grain voids. As shown in the cross-sectional images in Figure 5G and H, the grains tend to develop mainly along the direction normal to the sample surface. As shown in Figure 5G, the x = 0.1 sample displays noticeably more compact grain packing with fewer visible voids than the x = 0.5 sample shown in Figure 5H, which is in good agreement with its higher bulk density and lower porosity values listed in Table 1. As shown in Figure 6, the grain size distributions for both compositions exhibit a pronounced concentration, confirming their uniform grain size. Statistical analysis in Figure 6A-F indicates an overall trend of an initial increase and subsequent decrease in the average grain size, despite some irregular fluctuations.
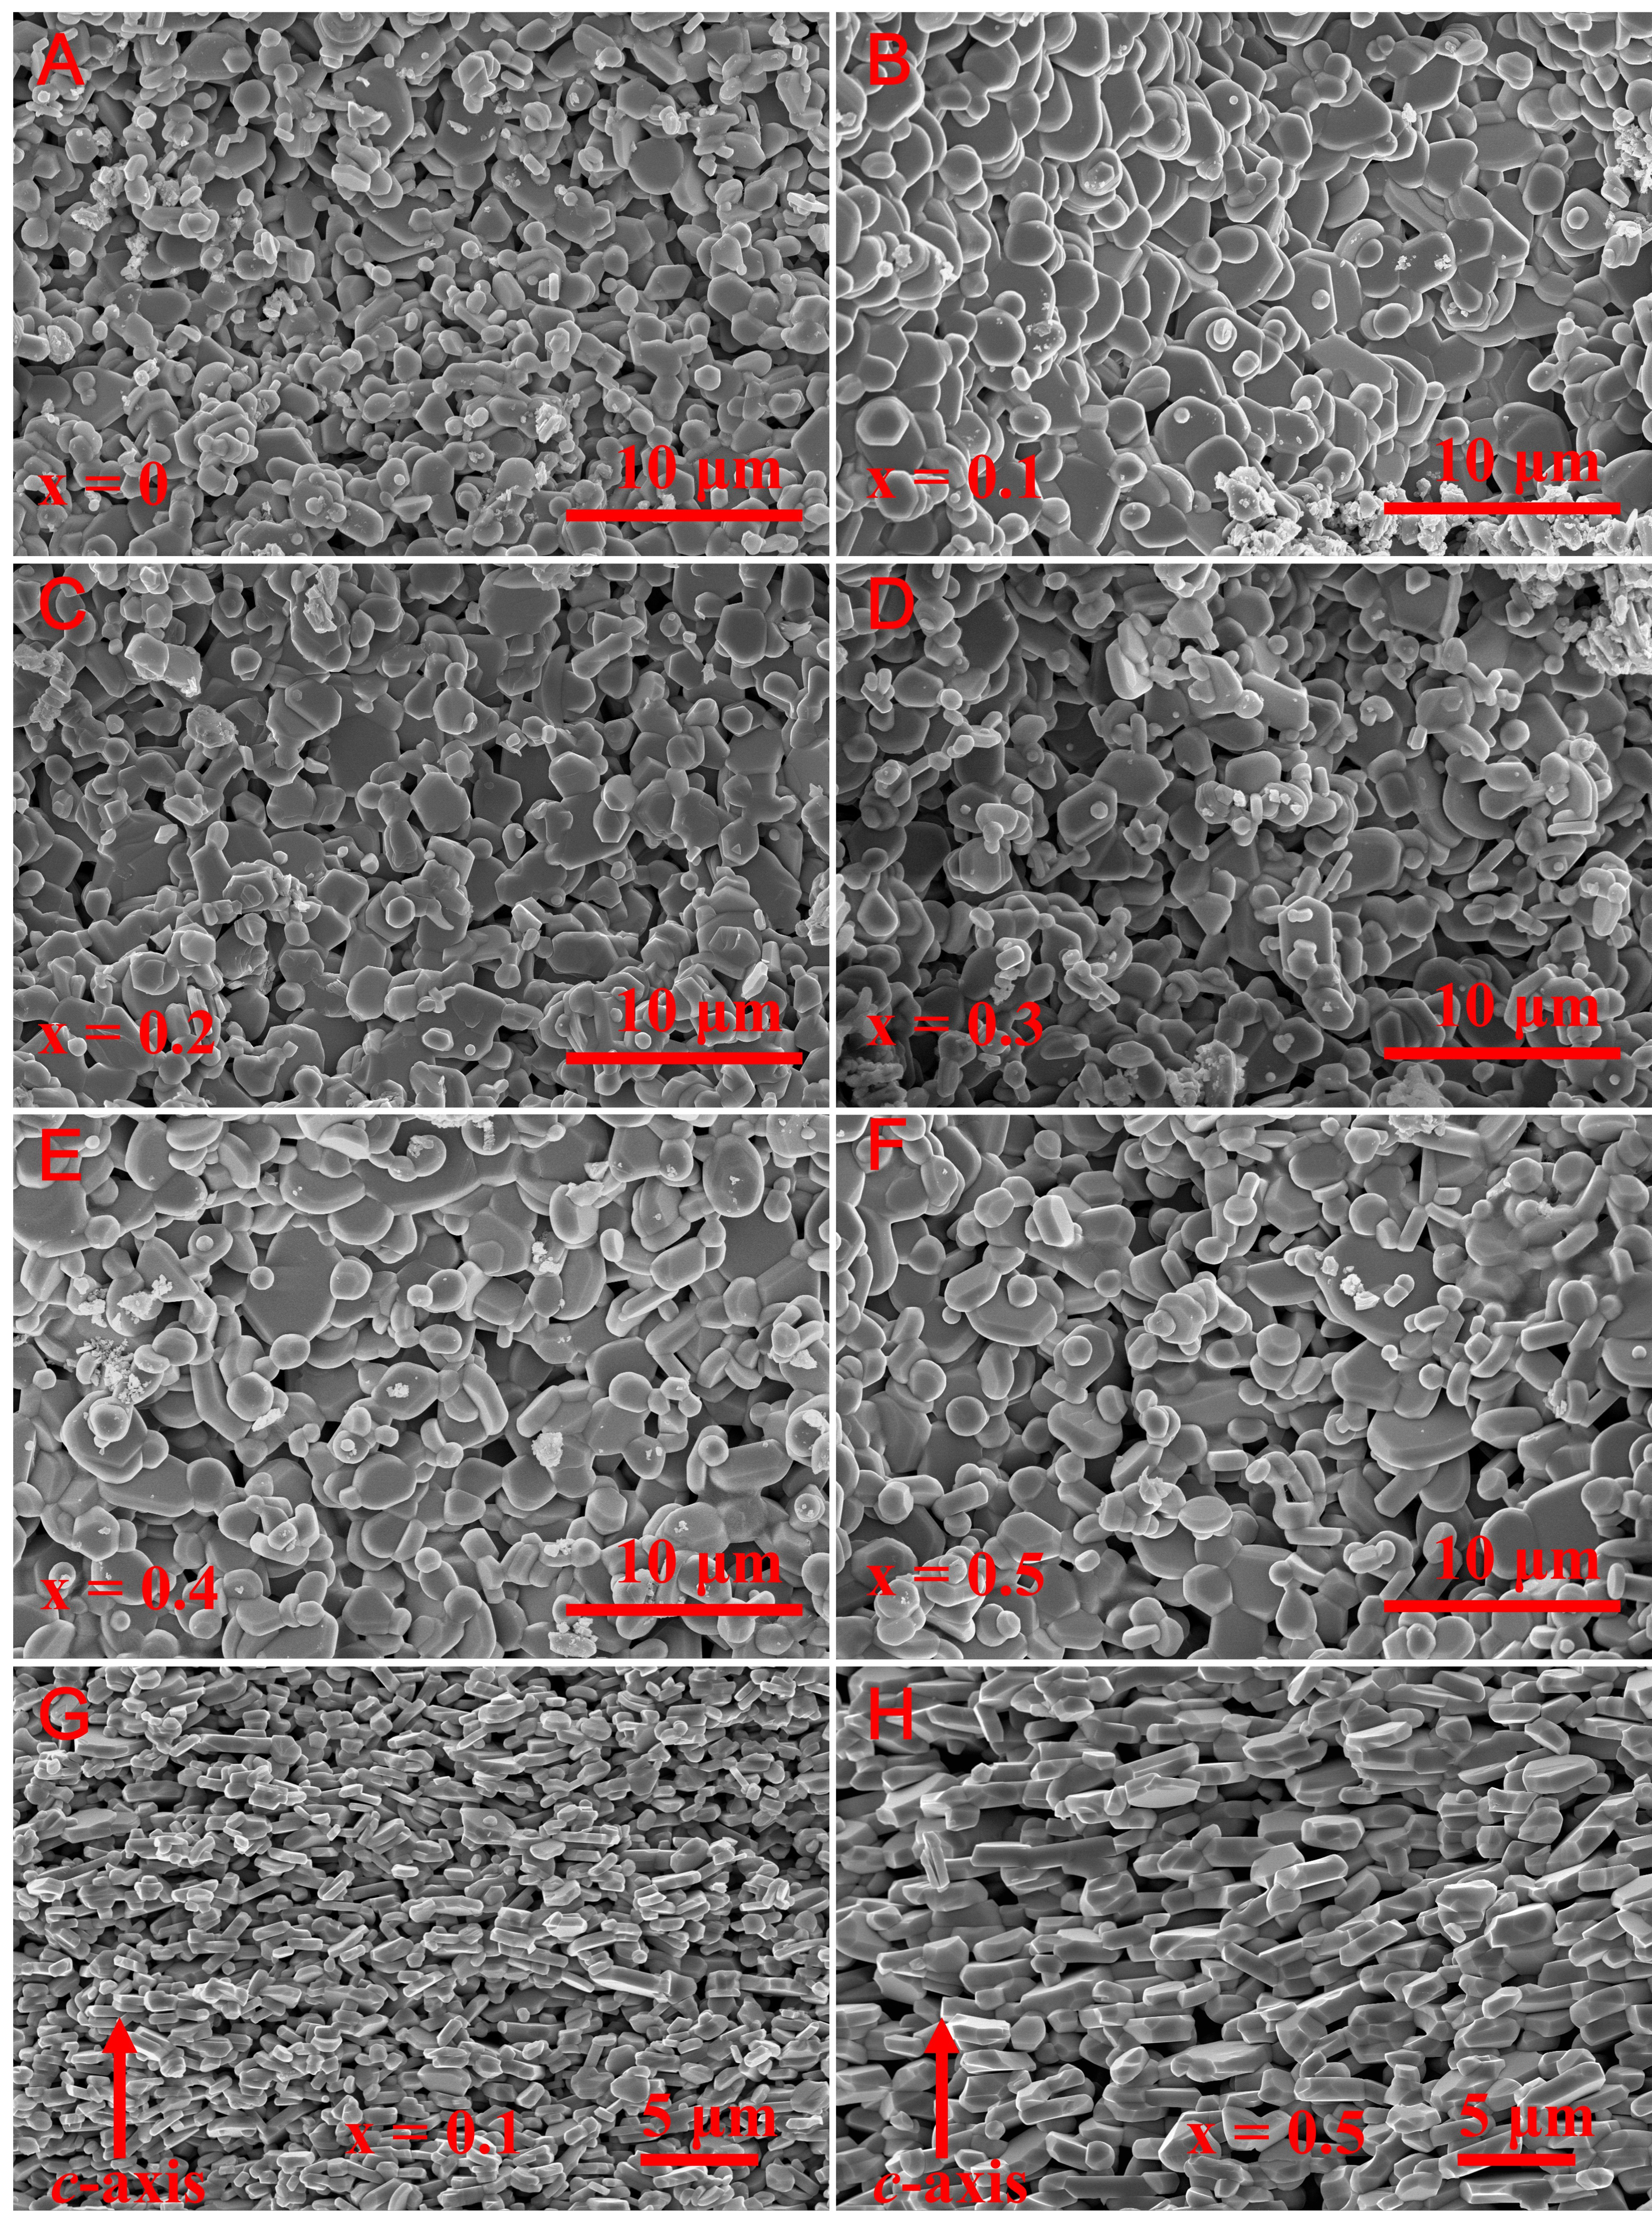
Figure 5. Microscopic morphology of oriented Ba(ZnTi)xFe12-2xO19 hexaferrites. Panels (A-F) show the surface morphology for x = 0.0 - 0.5, while panels (G) and (H) show cross-sectional images for x = 0.1 and x = 0.5, respectively.
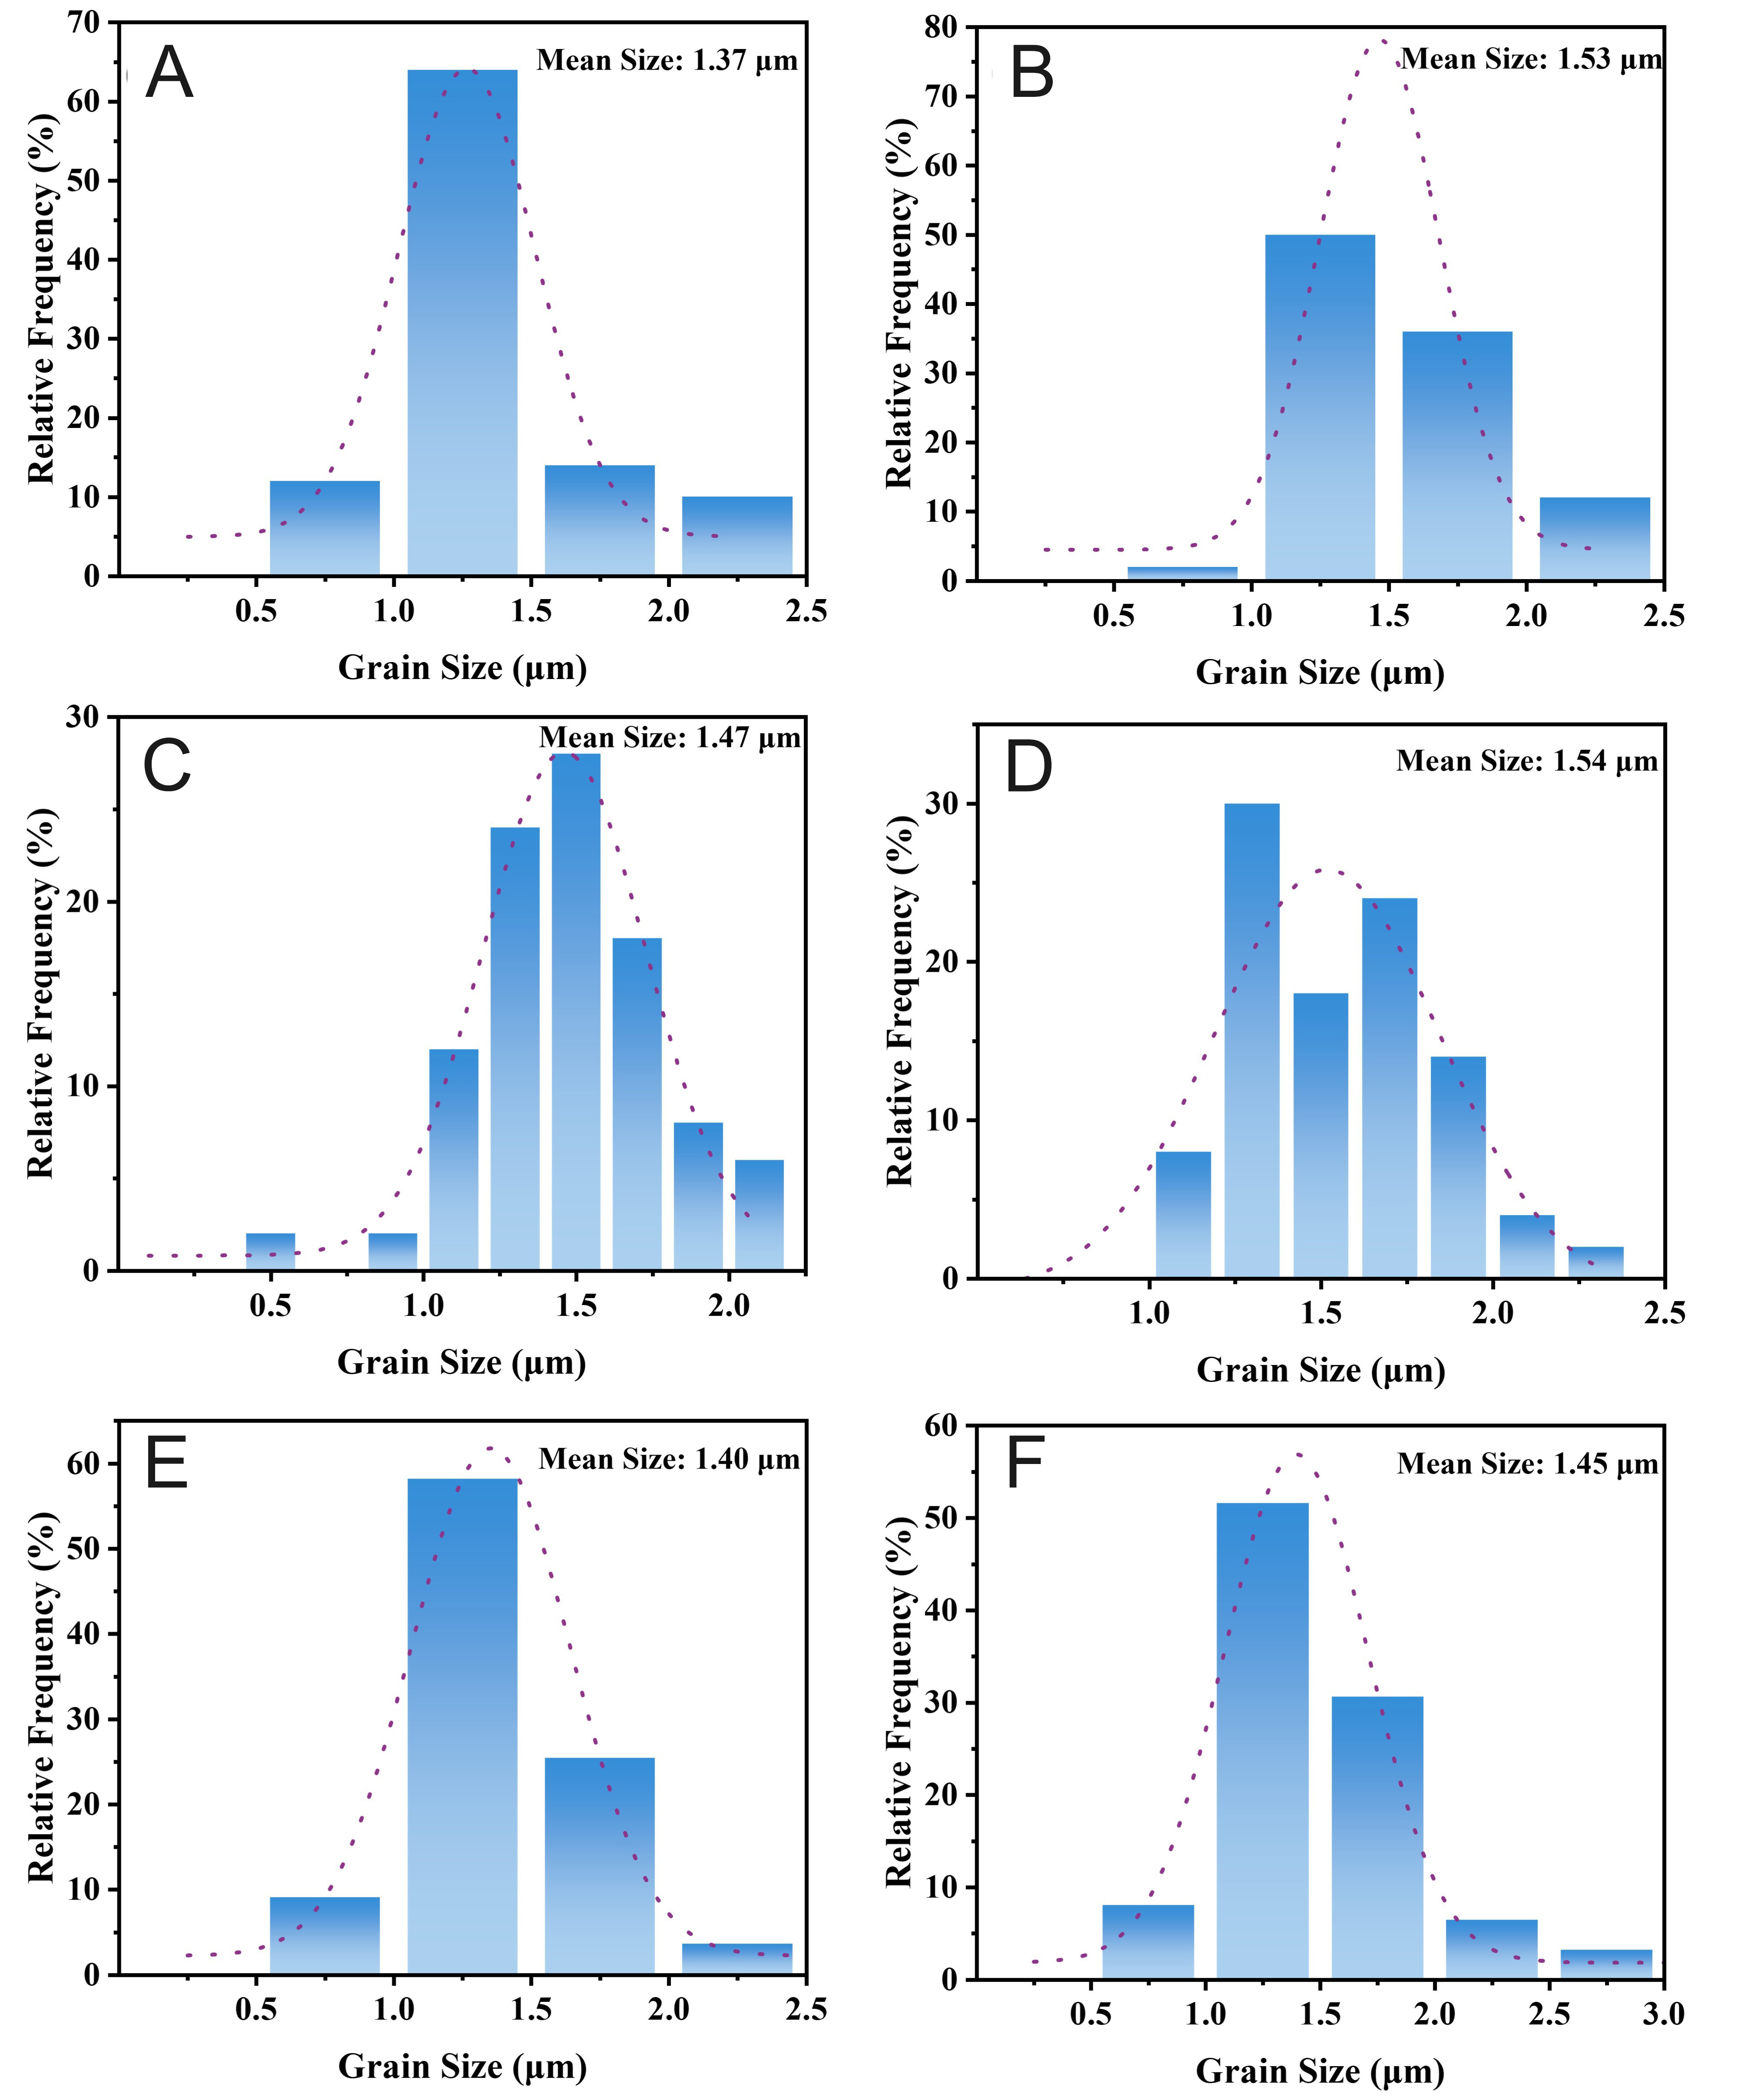
Figure 6. Grain size of oriented Ba(ZnTi)xFe12-2xO19: (A-F) hexaferrites surface at x = 0.0 - 0.5.
Raman spectroscopy analysis
Raman spectroscopy arises from the inelastic scattering of incident photons by material constituents, a process that involves energy transfer. This method is capable of probing local structural features, such as vibrational modes and bond strengths[20]. Group theory analysis based on D6h symmetry indicates that M-type hexaferrites possess 42 Raman-active modes (11A1g + 14E1g + 17E2g), 30 infrared-active modes (13A2u + 17E1u), and 54 silent modes (3A1u + 4A2g + 13B1g + 4B1u + 3B2g + 12B2u + 15E2u). The letters A, B, and E label different optical modes, while the subscripts g (gerade) and u (ungerade) indicate whether a given mode is symmetric or antisymmetric with respect to the inversion center[21,22].
As shown in Figure 7A, the BaM crystal structure consists of alternating rhombohedral (R) and spinel (S) blocks stacked along the c-axis. This arrangement is conventionally denoted as RSR*S*, where the asterisk indicates a 180° rotation of the corresponding block about the c-axis[13]. Within the oxygen interstices of the R and S blocks, Fe3+ ions occupy five distinct crystallographic sites: three octahedral sites (2a, 12k, 4f2), one bipyramidal site (2b), and one tetrahedral site (4f1), among which 2a, 12k, and 2b spin up, while 4f1 and 4f2 spin down[23].
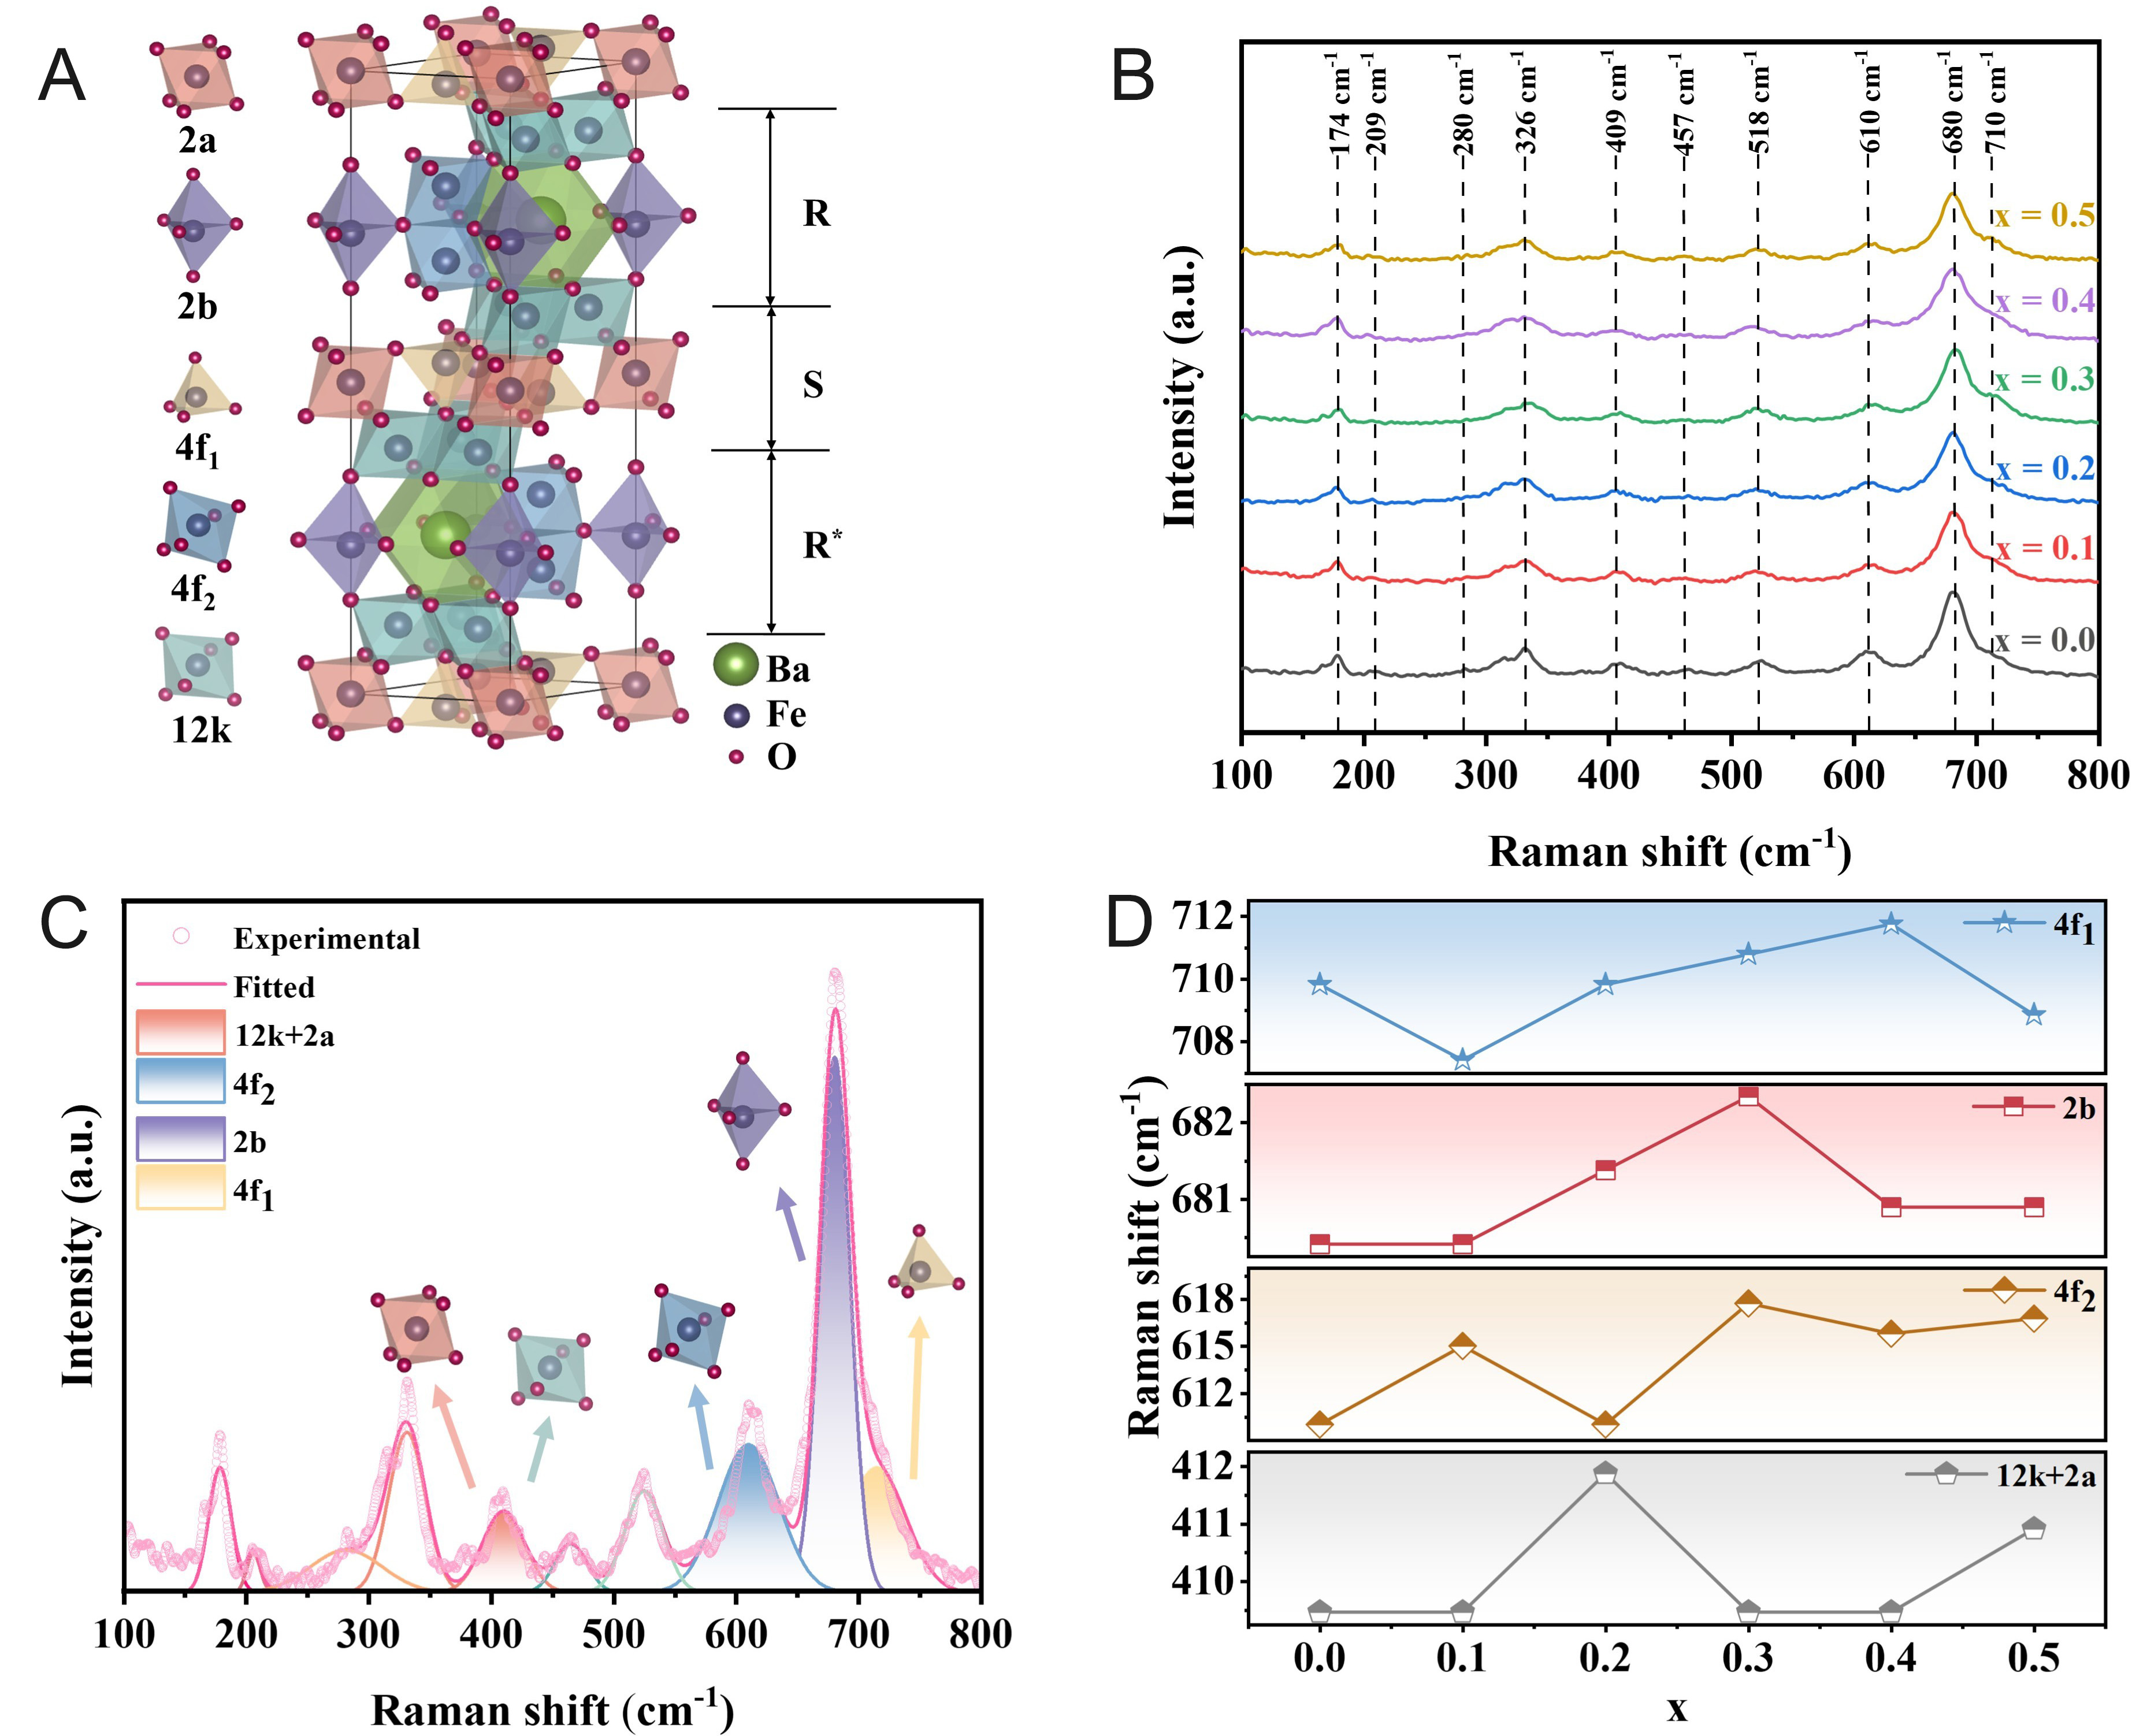
Figure 7. (A) Crystal structures of BaM (BaFe12O19); (B) Raman spectra of Ba(ZnTi)xFe12-2xO19; (C) Fitted Raman spectrum of Ba(ZnTi)xFe12-2xO19 (x = 0.0); (D) The Raman shifts of five sites as a function of Zn2+-Ti4+ substitution.
For M-type hexaferrites, the octahedra (FeO6), bipyramids (FeO5), and tetrahedra (FeO4) each give rise to characteristic Raman vibration modes. The Raman spectra acquired from our samples in the range of 100-800 cm-1 are presented in Figure 7B. Their peak positions and intensities agree well with the literature values for typical BaM[18]. Furthermore, Figure 7C depicts the result of applying a Gaussian fit to the Raman spectrum. The major Raman peak parameters, such as frequencies (Freq) and intensities (cts), are summarized in Table 2 based on the fitting results. The Raman peaks corresponding to the tetrahedral (4f1) and octahedral (4f2) sites show the most pronounced trend: as x increases, the peak intensity (cts) generally decreases, indicating that Zn2+-Ti4+ preferentially substitute Fe3+ at these lattice positions. This substitution disrupts crystal symmetry, increases disorder, and induces local strain[24]. No additional peaks are observed in the Raman spectra, confirming the phase purity of the samples and consistent with the XRD results.
Observed frequency (Freq) and Counts (cts) of Raman peaks of Ba(ZnTi)xFe12-2xO19 (x = 0.0 - 0.5)
| Associated polyhedra | Symmetry | Item | x = 0.0 | x = 0.1 | x = 0.2 | x = 0.3 | x = 0.4 | x = 0.5 |
| Whole spinel blocks | E1g | Freq | 174 | 176 | 177 | 178 | 175 | 176 |
| cts | 28.04 | 25.76 | 24.36 | 20.77 | 21.81 | 20.22 | ||
| O-Fe-O bridge | A1g | Freq | 209 | 205 | 206 | 206 | 210 | 209 |
| cts | 9.83 | 8.34 | 7.03 | 5.00 | 5.56 | 4.47 | ||
| Octahedron (2a) | E1g | Freq | 280 | 287 | 284 | 282 | 283 | 284 |
| cts | 9.20 | 10.29 | 10.80 | 9.12 | 7.02 | 6.78 | ||
| Octahedron (mixed) | E2g | Freq | 326 | 328 | 330 | 330 | 327 | 326 |
| cts | 40.75 | 38.79 | 36.81 | 32.75 | 33.06 | 27.19 | ||
| Octahedron (12k + 2a) | A1g | Freq | 409 | 409 | 412 | 409 | 409 | 411 |
| cts | 19.53 | 19.72 | 19.16 | 15.48 | 10.87 | 9.70 | ||
| Octahedron (mixed) | A1g | Freq | 457 | 459 | 464 | 464 | 459 | 461 |
| cts | 10.49 | 10.65 | 12.08 | 6.56 | 3.75 | 2.15 | ||
| Octahedron (mixed) | E2g | Freq | 518 | 520 | 520 | 518 | 519 | 521 |
| cts | 21.13 | 20.67 | 20.87 | 21.14 | 17.68 | 14.03 | ||
| Octahedron (4f2) | A1g | Freq | 610 | 615 | 610 | 618 | 616 | 617 |
| cts | 37.05 | 34.27 | 30.51 | 25.67 | 26.90 | 18.92 | ||
| Bipyramid (2b) | A1g | Freq | 680 | 680 | 681 | 682 | 680 | 680 |
| cts | 124.29 | 120.57 | 121.46 | 114.43 | 105.39 | 103.97 | ||
| Tetrahedron (4f1) | A1g | Freq | 710 | 707 | 710 | 711 | 712 | 709 |
| cts | 36.68 | 30.70 | 24.72 | 34.45 | 35.10 | 28.86 |
Figure 7D presents a more detailed view of the Raman shifts of the five crystallographic sites as a function of Zn2+-Ti4+ substitution. As x increases, the Raman vibrational modes associated with the 4f1 and 4f2 sites show a noticeable shift. However, the mode positions corresponding to the remaining sites, namely 12k, 2a, and 2b, remain essentially unchanged until x reaches 0.1. It suggests that Zn2+-Ti4+ initially occupy the 4f1 and 4f2 sites in BaM. Although Raman spectroscopy probes local bonding environments and does not directly measure cation site occupancy, the clear shifts observed in the vibrational modes of the 4f1 and 4f2 polyhedra strongly suggest that these two sites are the most affected by the introduction of Zn2+ and Ti4+ ions into the BaM lattice. As discussed in the Introduction, the site preference of Ti4+ in M-type hexaferrites remains unsettled. The site-occupation tendencies for Zn2+ and Ti4+ inferred from these Raman shifts are qualitatively consistent with the model proposed by González-Angeles et al.[10]. According to this model, Zn2+ and Ti4+ tend to occupy the 4f1 and 4f2 sites, respectively, thereby reducing the spin-down contribution and leading to an initial enhancement of the saturation magnetization. Upon further increase in x, Raman shifts are observed for all five sites, indicating that Zn2+-Ti4+ progressively occupy all five positions.
Based on the site occupation evolution revealed by Raman spectroscopy, the non-monotonic variations of both the (203) diffraction peak angle in Figure 3C and the lattice parameters in Table 1 can be understood in terms of site occupation preference and doping level. For x = 0.1, where Zn2+ and Ti4+ preferentially occupy the 4f1 and 4f2 sites, the smaller Ti4+ substituting Fe3+ produces a dominant local contraction, leading to a slight right-shift of the (203) peak and relatively stable lattice parameters. For x = 0.2 and 0.3, the (203) peak continues to shift rightwards, and the lattice parameters show a slight further contraction, indicating that the contraction effect from Ti4+ remains dominant during this stage. For x = 0.4 and 0.5, the dopant ions gradually occupy all five Fe3+ sites. The larger Zn2+ (0.74 Å) now exerts a net expansion effect that overcomes the contraction from Ti4+, causing the (203) peak to shift leftwards and the lattice parameters to expand, reaching their maximum at x = 0.5. The non-monotonic trends observed in both the lattice parameters and the (203) peak angle, therefore, directly reflect a transition from preferential site occupation at low doping levels to broad multi-site substitution at higher doping levels, driven by the competing size effects of the larger Zn2+ and the smaller Ti4+ ions[25].
Static magnetic properties
Room-temperature magnetic characterization of the oriented samples was performed using a VSM. Figure 8A shows the hysteresis loops recorded for x = 0.0 under two field orientations: perpendicular and parallel to the hexagonal plane. When the magnetic field was applied perpendicular to the natural surface plane, which corresponds to the crystallographic easy axis, the sample reached magnetic saturation more readily. It showed a remanence ratio (Mr/Ms) of 0.91. This value is substantially higher than the theoretical upper limit of 0.5 expected for randomly oriented, non-interacting grains[13]. In contrast, when the field was applied parallel to the hexagonal plane along the hard axis, the remanence ratio fell sharply to just 0.20, and a much stronger applied field was needed before the sample reached saturation. These observations indicate that after magnetic-field alignment, the material displays strong direction-dependent magnetic anisotropy. Specifically, the anisotropy field is lower along the c-axis but higher within the basal plane. The hysteresis loops measured with the VSM field parallel to the c-axis for oriented samples at various x values are shown in Figure 8B. From these curves, we extracted the coercivity (Hc) and remanent magnetization (Mr) for each composition, and the results are compiled in Table 3.
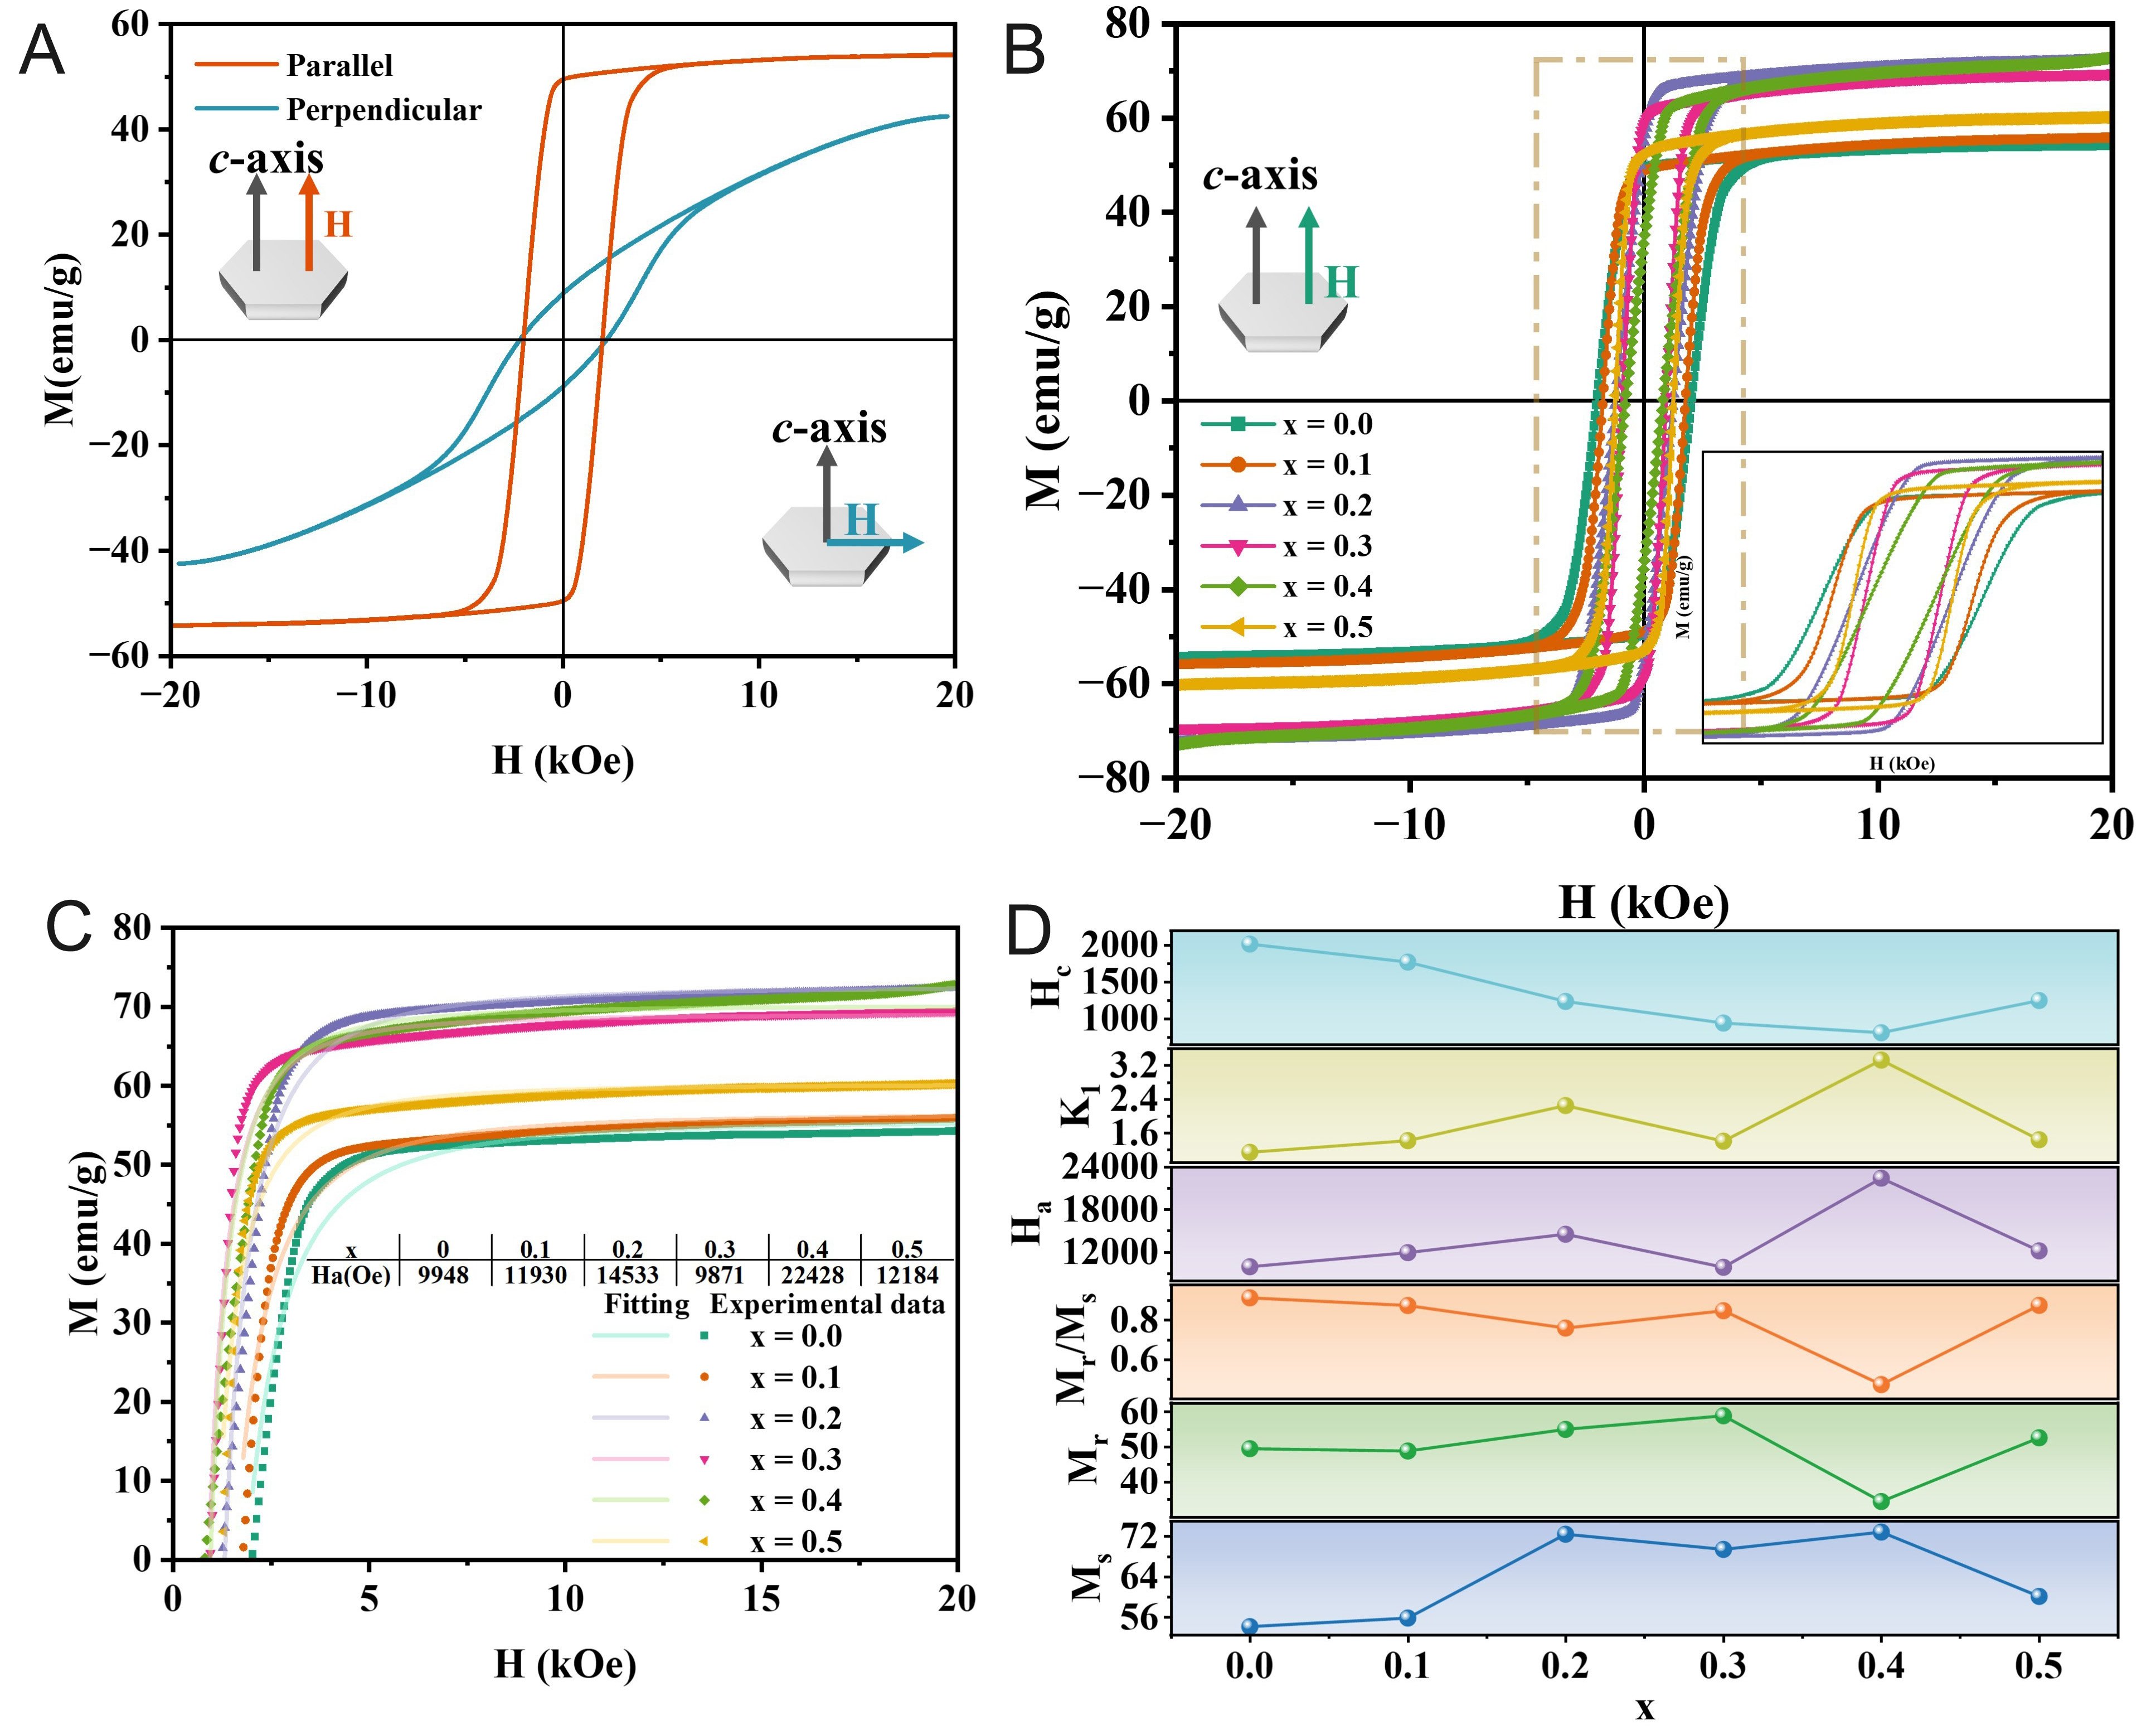
Figure 8. (A) Typical hysteresis loops of oriented Ba(ZnTi)xFe12-2xO19 at x = 0.0; (B) Hysteresis loops of oriented Ba(ZnTi)xFe12-2xO19 as functions of x; (C) The fitting lines of magnetic hysteresis loops along the easy axis according to the approaching saturation law; (D) Variation in magnetic properties as functions of x.
Magnetic parameters of oriented Ba(ZnTi)xFe12-2xO19 (x = 0.0 - 0.5) hexaferrites
| Sample | Ms (emu/g) | Mr (emu/g) | Mr/Ms | Ha (Oe) | K1 (× 106 erg/cm3) | Hc (Oe) |
| x = 0.0 | 54.17 | 49.47 | 0.91 | 9948 | 1.15 | 2014 |
| x = 0.1 | 55.84 | 48.80 | 0.87 | 11930 | 1.42 | 1769 |
| x = 0.2 | 72.43 | 55.00 | 0.76 | 14533 | 2.25 | 1233 |
| x = 0.3 | 69.43 | 58.85 | 0.84 | 9871 | 1.41 | 938 |
| x = 0.4 | 72.84 | 34.37 | 0.47 | 22428 | 3.32 | 807 |
| x = 0.5 | 60.12 | 52.61 | 0.87 | 12184 | 1.44 | 1245 |
When the applied field is sufficiently strong, the magnetization curves of polycrystalline magnetic materials gradually converge toward a common shape as the material approaches saturation. This behavior can be well described by the Law of Approach to Saturation (LAST) as follows[26].
In Equation (4), the parameters A and B denote material-dependent coefficients with dimensions of Oe and Oe2, respectively. They are associated with the resistance to magnetization during the technical magnetization process. Where χp denotes the paramagnetic susceptibility, and H is the applied magnetic field. For M-type hexaferrites, A is close to zero, and B is given as follows[27].
Here, μ0 is the permeability of free space. In strongly magnetic materials like BaM, the paramagnetic susceptibility is sufficiently weak that the term χpH can be omitted[28]. Thus, the LAST expression can be simplified to the form given in Equation (6) as follows.
Here, M varies linearly with 1/H2. Under high-field conditions (19-20 kOe), the values of Ms, a material constant for a given composition, and B are obtained by linearly fitting M against 1/H2, as illustrated in Figure 8C. The anisotropy constant K1 and the anisotropy field Ha are then determined using
As seen in the data, the trends of Ha and K1 are essentially identical, consistent with the theoretical expectation that a larger Ha corresponds to a larger K1. The saturation magnetization (Ms) of the samples initially rises to a peak of 72.84 emu/g at x = 0.4, then declines. It should be noted that although the highest Ms (72.84 emu/g) is attained at x = 0.4, its remanence ratio drops sharply to 0.47 as shown in Table 3, which is unfavorable for self-biased operation. Therefore, Ms must be evaluated together with Mr/Ms when assessing composition suitability for self-biased circulators. All Zn-Ti substituted compositions show higher Ms values than their undoped counterparts. It suggests that the ionic composition plays a key role in determining the hysteresis loop shape and associated magnetic parameters[31]. This overall enhancement in Ms is primarily due to the preferential occupation of the tetrahedral 4f1 and octahedral 4f2 sites by non-magnetic Zn2+ and Ti4+ ions, which replace the original spin-down Fe3+ moments at these positions, reducing the total spin-down contribution and increasing the net magnetization. However, with increasing Zn2+-Ti4+ substitution, both Mr and Ms show non-monotonic, irregular trends, with Ms peaking at x = 0.4, and then decreasing. These trends can be attributed to the site preference of the dopant ions and their different ionic radii relative to those of the host ions, which alter interatomic distances and consequently modify the superexchange interactions of Fe-O-Fe[32]. Such modifications lead to either an enhancement or a reduction in magnetic properties, thereby explaining the irregular changes in both Mr and Ms[30]. The remanence ratio (Mr/Ms) reaches its maximum value of 0.87 after doping at x = 0.1 and x = 0.5. It is also reflected in the SEM images shown in Figure 5G and H, which reveal the most distinct and uniform layered morphology for Ba(ZnTi)xFe12-2xO19 at these compositions, features generally associated with improved magnetic performance. Differences in cross-sectional morphology correlate with different Mr/Ms values. Specifically, a more pronounced layered structure is associated with a higher remanence ratio. The increase in Mr/Ms from the theoretical maximum of 0.5 for randomly oriented non-interacting grains to 0.87 is mainly due to the effective c-axis grain alignment achieved by magnetic-field orientation during pressing. The high Lotgering factors and the cross-sectional SEM images in Figure 5G and H confirm that the platelet-like grains are aligned perpendicular to the sample plane.
Coercivity (Hc) is a key parameter distinguishing hard from soft magnetic behavior. Its variation in polycrystalline ferrites can be understood using Equation (7)[27]:
An increase in grain size D reduces the total grain boundary area and weakens the overall pinning effect, thus lowering Hc. However, a larger K1/Ms ratio strengthens pinning and acts in the opposite direction[33]. In the samples studied here, the observed non-monotonic behavior of Hc, which first decreases and then increases, is governed by the competition between these two factors. The minimum Hc does not strictly coincide with the maximum grain size D because the K1/Ms ratio varies considerably with composition. When this ratio decreases sufficiently, it becomes the dominant factor controlling pinning behavior, driving Hc to lower values even as the grain size decreases. The subsequent rise in Hc at higher substitution levels is then driven by the combined effect of increasing K1/Ms and decreasing D.
Gyromagnetic properties
In polycrystalline hexaferrites, the total FMR linewidth ΔH can be expressed as the sum of intrinsic linewidth ΔHi, magnetocrystalline anisotropy contribution ΔHa, porosity-related contribution ΔHp, and surface roughness contribution ΔHoth[34,35], as follows.
ΔHi is typically negligible for M-type hexaferrites, while ΔHoth can be minimized by careful surface polishing[36]. Therefore, the following analysis focuses mainly on ΔHa and ΔHp. Importantly, ΔHa and ΔHp are positively related to the crystalline anisotropy and porosity-induced linewidth broadening contributions[37]. Because the samples consist of polycrystalline assemblies of oriented grains, the experimentally measured ΔH reflects an average of the collective gyromagnetic response arising from a large number of individual crystallites. Figure 9A-D displays the FMR absorption spectra of the BaM sample (x = 0.1) obtained by sweeping the external field (H0) at different frequencies (f). H0 was applied perpendicular to the sample plane, parallel to the c-axis. The experimental data measured in the 64-67 GHz frequency range are plotted as circular markers. The orange curve represents a fit using a Gaussian (GaussAmp) lineshape, while the green curve corresponds to a Lorentzian fit. Quantitatively, the Gaussian fit yields a higher coefficient of determination (R2 = 0.975) than the Lorentzian fit (R2 = 0.968) for the 64 GHz spectrum, indicating a better agreement with the experimental data. Therefore, the FMR linewidth (ΔH) was extracted from the Gaussian fit. The FMR peak position shifts with the external field across different frequencies.
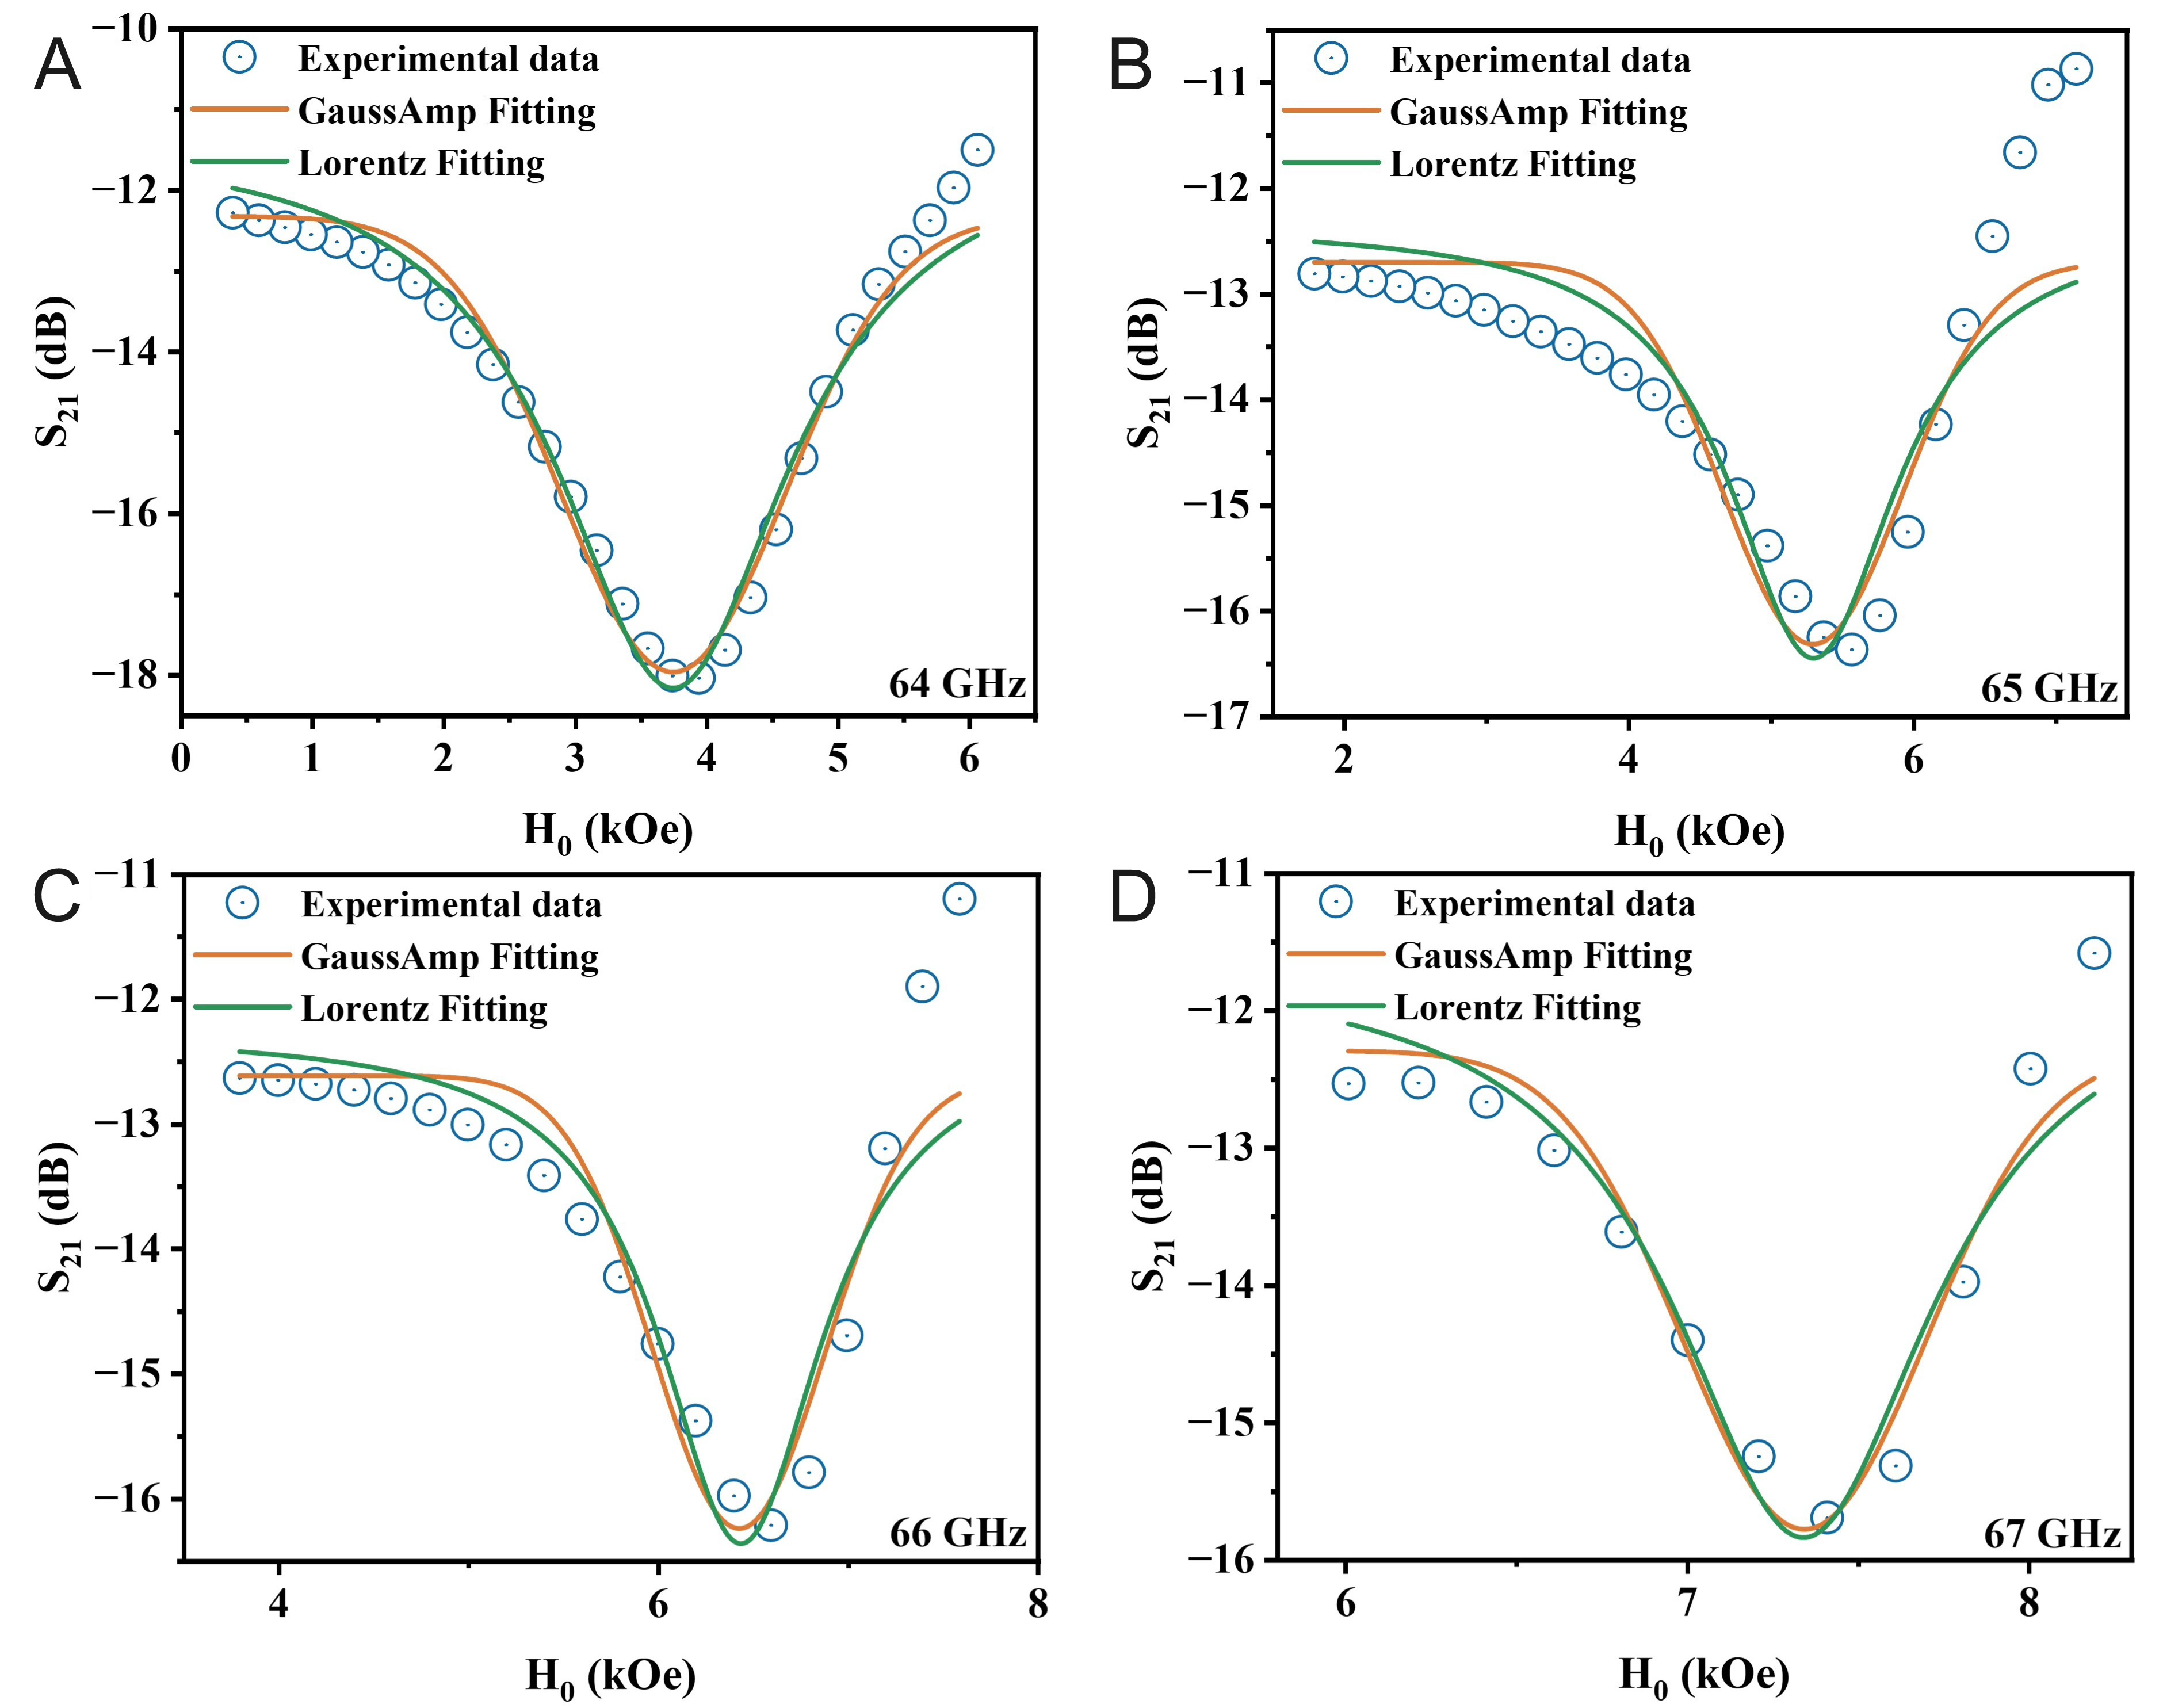
Figure 9. FMR absorption spectra of the BaM sample (x = 0.1) measured by sweeping the external field at different frequencies: (A) 64 GHz, (B) 65 GHz, (C) 66 GHz, and (D) 67 GHz. FMR: Ferromagnetic resonance.
To comprehensively evaluate the effect of Zn2+-Ti4+ co-substitution on high-frequency magnetic losses, the FMR linewidths of all compositions (x = 0.0 - 0.5) were measured across the 40-67 GHz range. Figure 10 summarizes the dependence of ΔH on substitution level x, where ΔH was measured at a representative frequency for each sample. The ΔH exhibits a clear non-monotonic trend where it initially decreases with increasing x, reaches a minimum at x = 0.2, and then increases significantly at higher substitution levels. Specifically, the narrowest linewidth of 289 Oe was achieved at 59 GHz for x = 0.2, while the broadest linewidth of 1,322 Oe was observed at 48 GHz for x = 0.5.
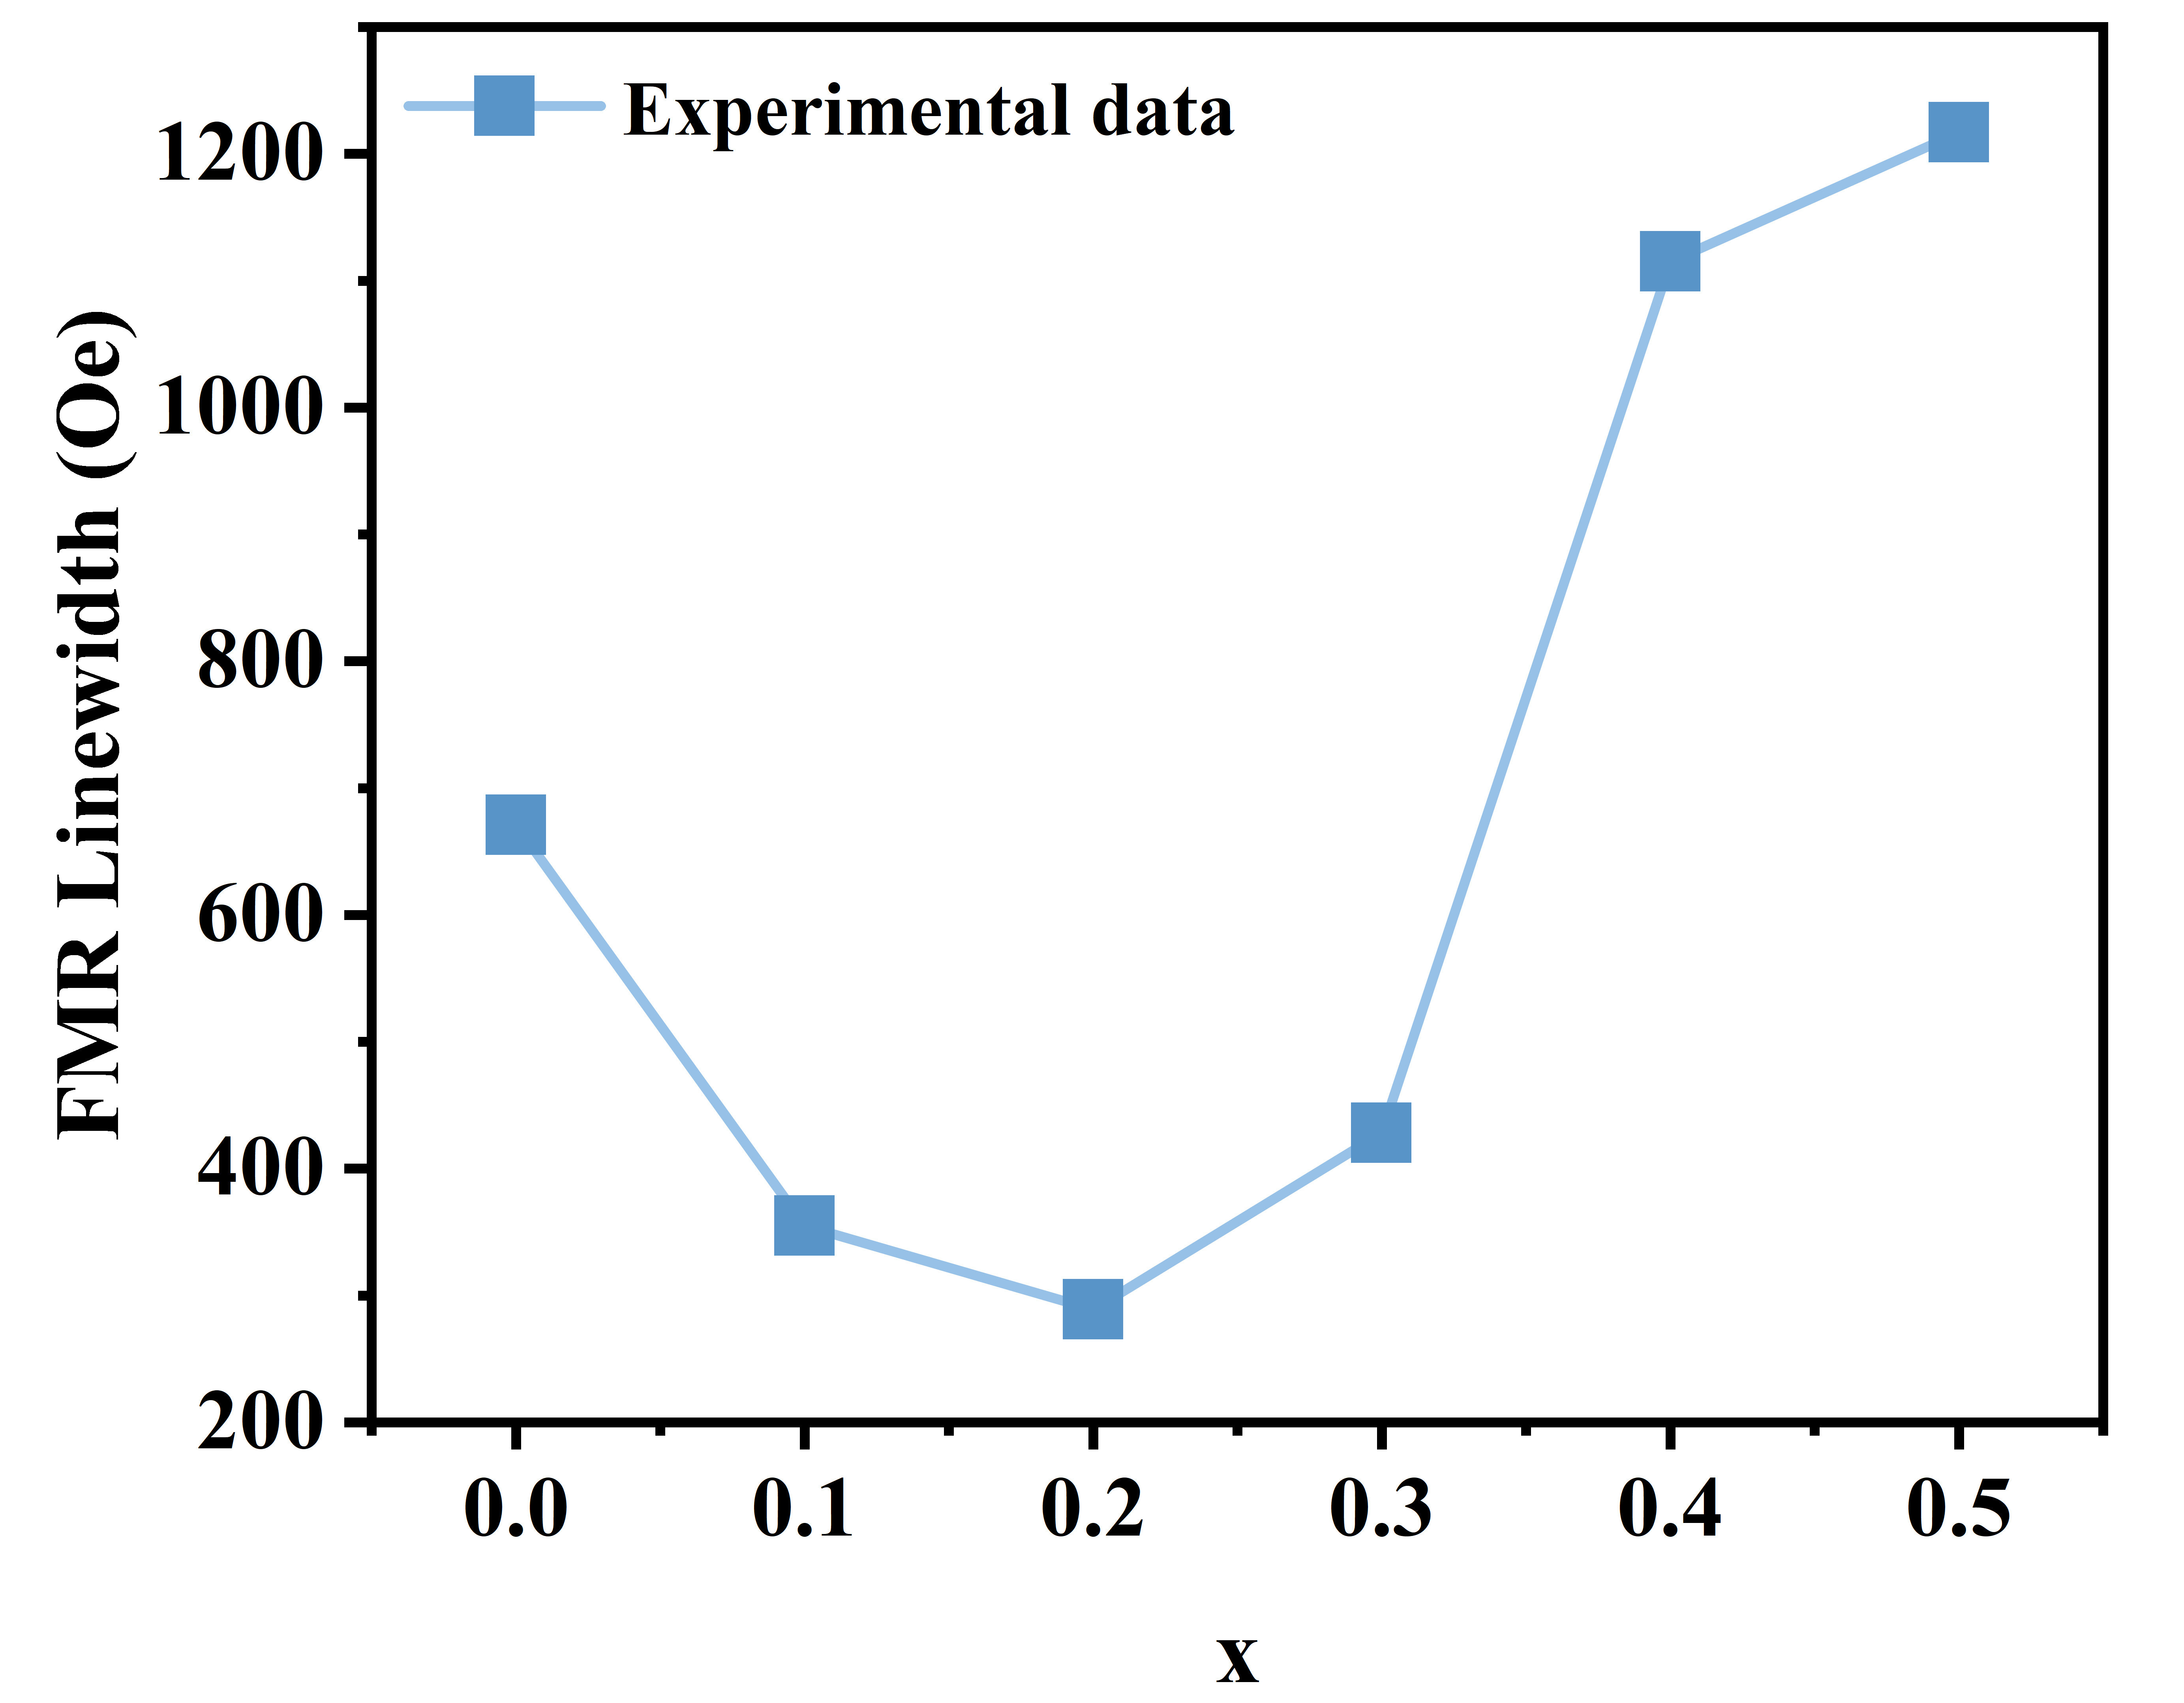
Figure 10. The dependence of ΔH on the substitution level x.
To quantitatively evaluate the role of porosity, Table 1 lists the porosity p of each oriented BaM sample. A direct comparison of the porosity data with the ΔH values shown in Figure 10 reveals a clear correlation between the two, as both quantities follow the same trend with increasing x and reach their lowest values at x = 0.2. As x increases beyond 0.3, porosity rises sharply to 18.70% at x = 0.5, accompanied by a sharp increase of ΔH to 1,322 Oe (at 48 GHz). In addition to porosity, the magnetocrystalline anisotropy field Ha also plays a role. As listed in Table 3, the Ha values for x = 0.1 (11,930 Oe) and x = 0.2 (14,533 Oe) are among the lower levels across all substituted samples, especially when compared with the much higher value at x =
For a finite rectangular plate sample, the internal demagnetizing field Hd = -Nz·Ms is spatially nonuniform, where Nz is the position-dependent demagnetizing factor and Ms the saturation magnetization, due to magnetic surface charges at the sample boundaries[38]. For the 4.0 × 4.0 × 0.8 mm3 specimens measured here (Ms ≈ 344 emu/cm3, x = 0.2), a surface-integral calculation yields Nz = 0.825 at the center, decreasing to approximately 0.47 at the edge midpoint and approximately 0.41 near the corners. The standard deviation of the internal field across the midplane is approximately 40 Oe, contributing approximately 14% to the narrowest FMR linewidth (ΔHmin = 289 Oe). Within the central 70% of the sample area, the field variation is only about 12 Oe, which is approximately 4% of ΔHmin. The edge demagnetizing effect is therefore a measurable but non-dominant source of linewidth broadening in our samples.
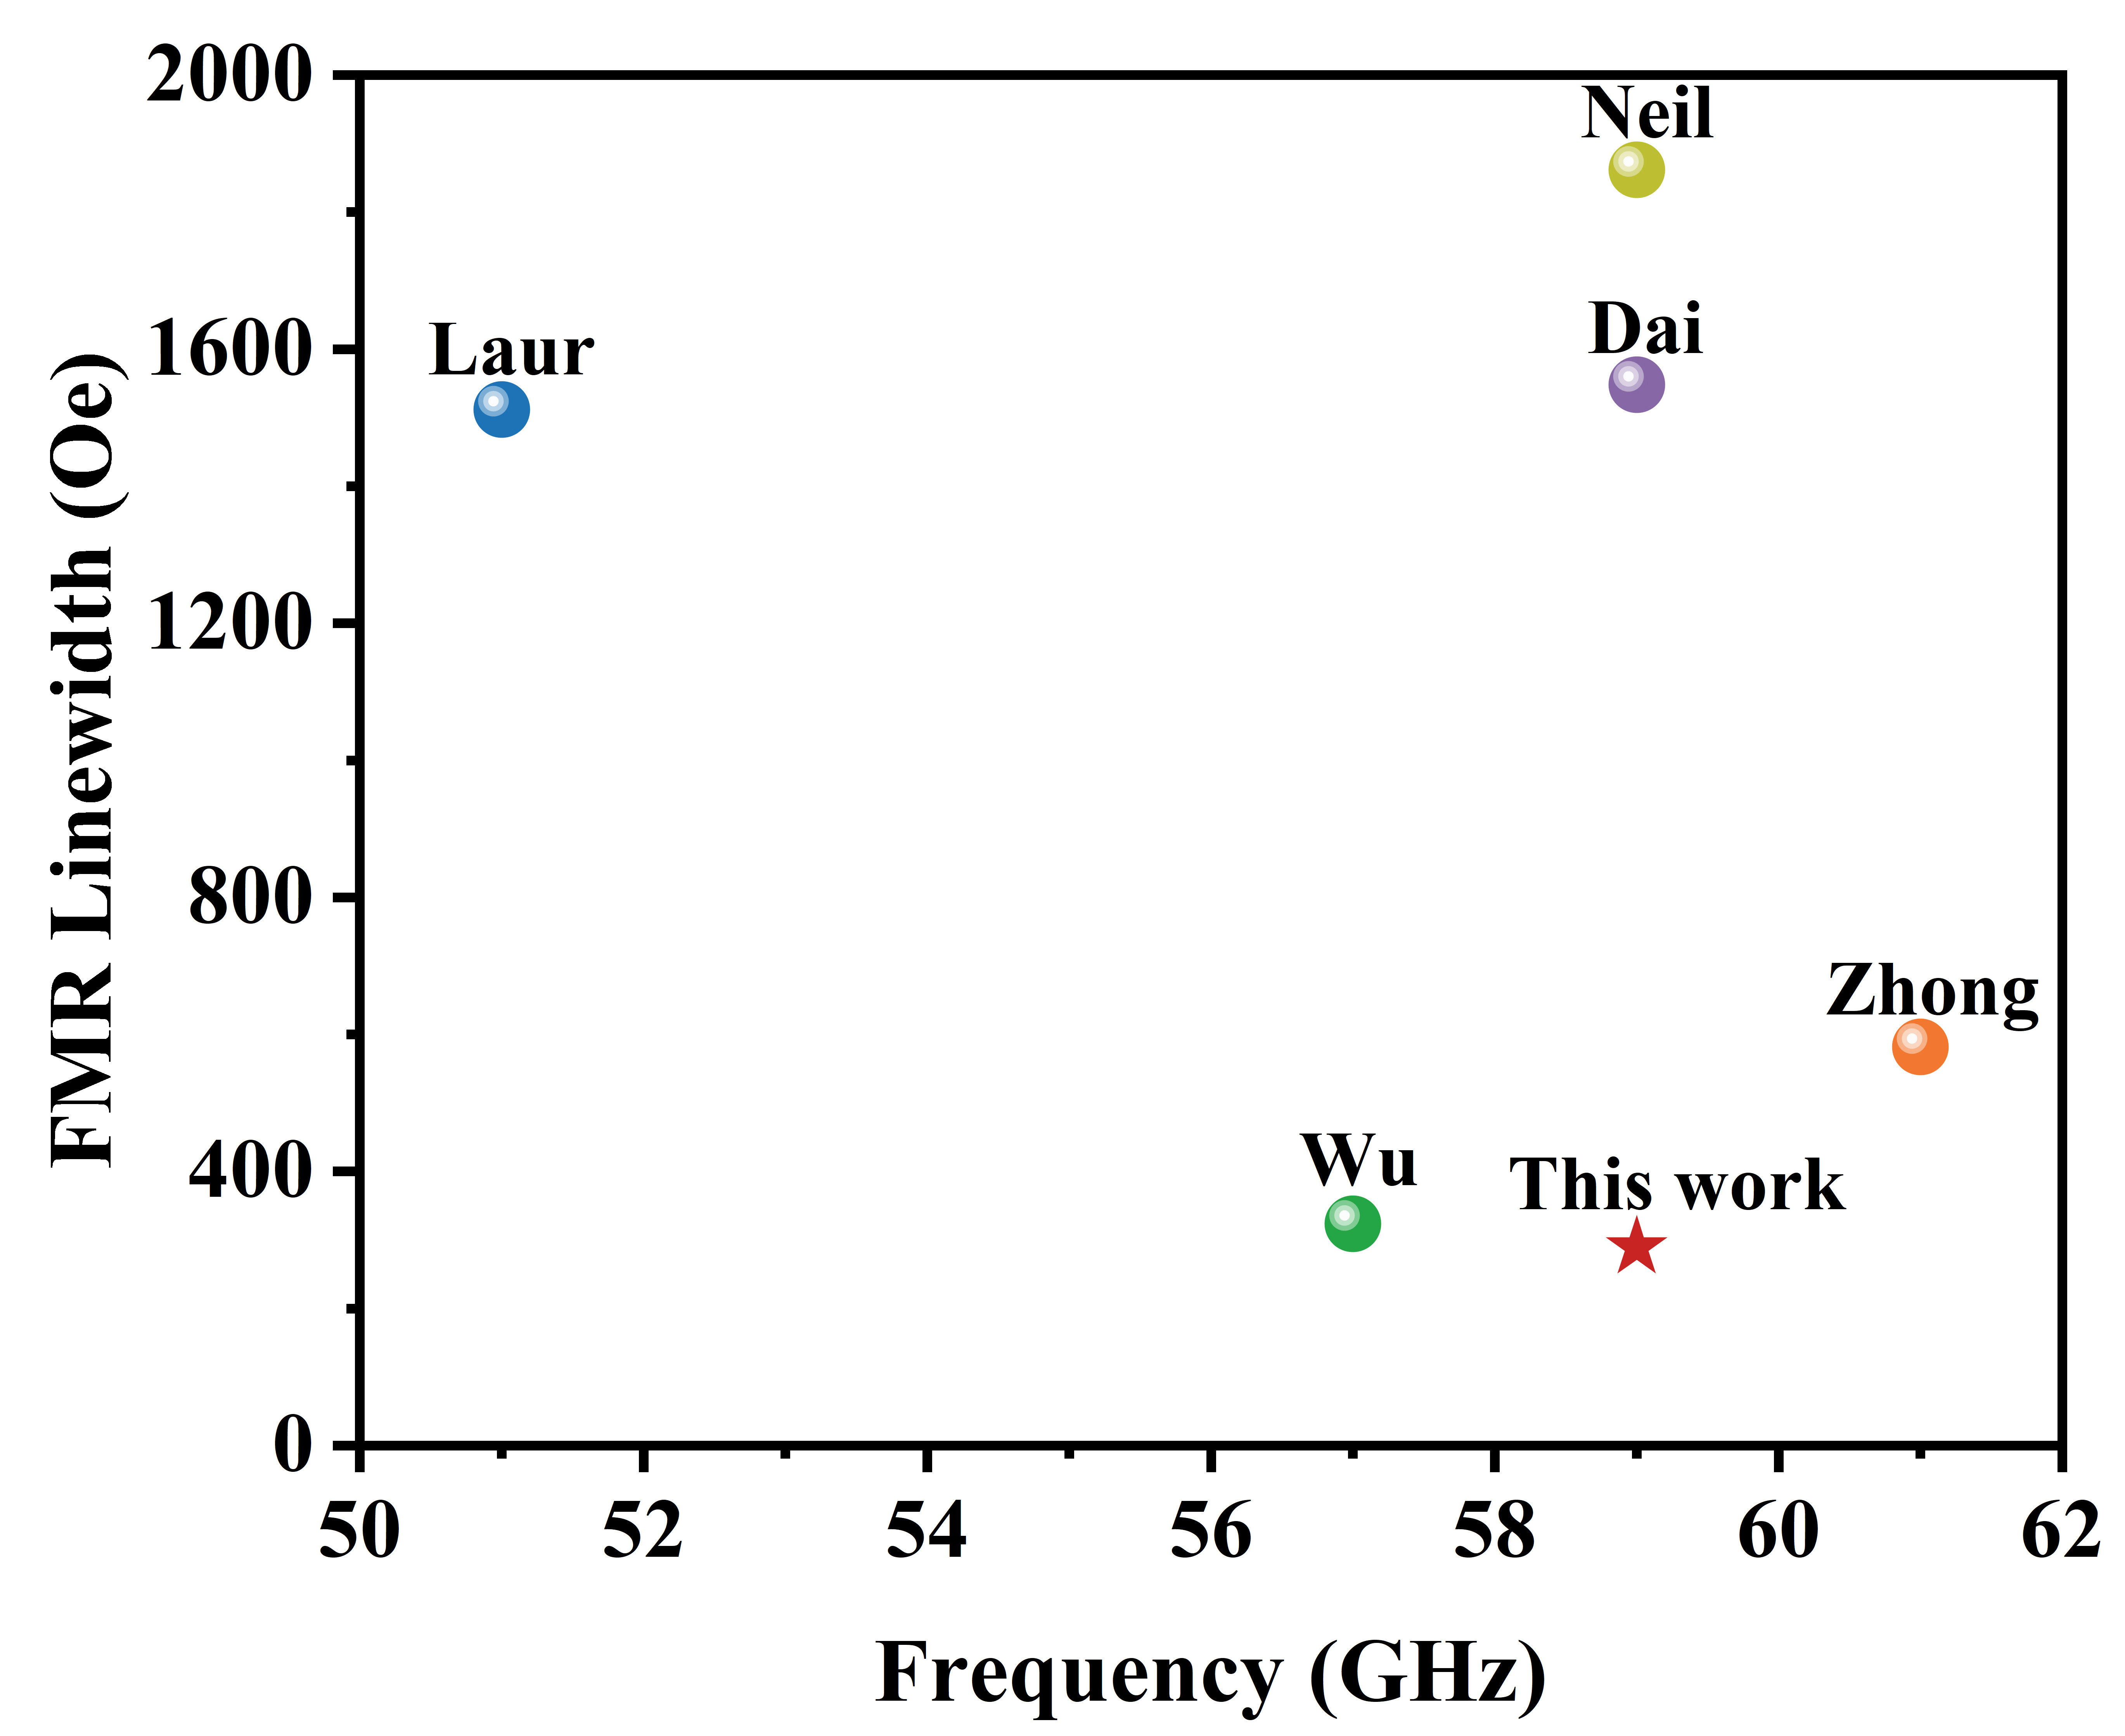
Compared with typical values for commercially available polycrystalline hexaferrites (~2,000 Oe)[39], all substituted samples in this study, especially those with x = 0.1 - 0.3, demonstrate markedly lower linewidths in the millimeter-wave band. Notably, the Ba(ZnTi)xFe12-2xO19 hexaferrite with x = 0.2 exhibits the narrowest FMR linewidth of 289 Oe at 59 GHz, compared with previously reported values as shown in Figure 11. Among the investigated compositions, the x = 0.2 sample achieves the narrowest FMR linewidth in this study (ΔH = 289 Oe at 59 GHz), underscoring the effectiveness of Zn-Ti co-substitution in suppressing magnetic losses. For practical self-biased circulator applications, the x = 0.1 composition offers the most well-rounded set of properties, as it simultaneously delivers the highest remanence ratio among all substituted samples at Mr/Ms = 0.87, a sufficiently large anisotropy field Ha = 11,930 Oe for millimeter-wave self-biasing, and a narrow FMR linewidth ΔH = 355 Oe at 67 GHz that compares favorably with most reported values for polycrystalline M-type hexaferrites.
CONCLUSION
This study aimed to develop M-type hexaferrites with large magnetocrystalline anisotropy and narrow ferromagnetic resonance linewidth for millimeter-wave self-biased circulator applications. Zn-Ti co-substitution is an effective strategy for tailoring both the static and dynamic magnetic properties of c-axis-oriented BaM ceramics, enabling the simultaneous achievement of a high anisotropy field, an excellent squareness ratio, and a markedly reduced FMR linewidth. The best-performing compositions show an FMR linewidth substantially lower than that of commercial polycrystalline hexaferrites, while still maintaining the strong uniaxial anisotropy required for effective self-biasing. These results indicate that Zn-Ti co-substituted, textured BaM hexaferrites are promising gyromagnetic materials for compact, low-loss circulators operating in the millimeter-wave band.
DECLARATIONS
Authors’ contributions
Writing - original draft, methodology: Liao, Y.
Writing review & editing, resources: Liu, Q.
Software: Li, Z.; Tan, X.; Lai, Y.
Methodology: Wu, Y.; Chen, H.; Li, C.
Software, resources: You, X.; Wu, C.
Availability of data and materials
The raw data supporting the findings of this study, including XRD patterns, Raman spectra, SEM images, VSM hysteresis loops, and FMR absorption spectra, are available from the corresponding author (Liu, Q.
AI and AI-assisted tools statement
During the preparation of this manuscript, the AI tool DeepSeek-R1 (version initial release, released 2025-01-20) was used solely for language polishing and grammar refinement. The tool did not influence the study design, data collection, analysis, interpretation, or the scientific content of the work. All authors take full responsibility for the accuracy, integrity, and final content of the manuscript.
Financial support and sponsorship
This work is supported by the Sichuan Science and Technology Program [grant numbers: 2025ZNSFSC1384] and National Natural Science foundation of China [Nos: 52502330].
Conflicts of interest
All authors declared that there are no conflicts of interest.
Ethical approval and consent to participate
Not applicable.
Consent for publication
Not applicable.
Copyright
© The Author(s) 2026.
REFERENCES
1. Rathod, S.; Sreenivasulu, K.; Beenamole, K.; Ray, K. Evolutionary trends in transmit/receive module for active phased array radars. Def. Sci. J. 2018, 68, 553.
2. Kodak, U.; Rebeiz, G. M. A 5G 28-GHz common-leg T/R front-end in 45-nm CMOS SOI with 3.7-dB NF and -30-dBc EVM with 64-QAM/500-MBaud modulation. In EEE Transactions on Microwave Theory and Techniques, 2019; Vol. 67, pp. 318-31.
3. Tee, Y. T.; Seng, Y. H.; Boon, L. P.; et al. Design techniques to combat process, temperature and supply variations in Bluetooth RFIC. In IEEE MTT-S International Microwave Symposium Digest, 2003; Philadelphia, PA, USA, 2003; Vol. 1, pp. A37-A40.
4. Wu, C.; Wang, W.; Li, Q.; et al. Barium hexaferrites with narrow ferrimagnetic resonance linewidth tailored by site‐controlled Cu doping. J. Am. Ceram. Soc. 2022, 105, 7492-501.
5. Trukhanov, A.; Kostishyn, V.; Panina, L.; et al. Magnetic properties and Mössbauer study of gallium doped M-type barium hexaferrites. Ceram. Int. 2017, 43, 12822-7.
6. de Julian Fernandez, C.; Sangregorio, C.; de la Figuera, J.; Belec, B.; Makovec, D.; Quesada, A. Topical review: progress and prospects of hard hexaferrites for permanent magnet applications. J. Phys. D. Appl. Phys. 2021, 54, 153001.
7. Xiang, X.; Yang, Z.; Fang, G.; et al. Tailoring tactics for optimizing microwave absorbing behaviors in ferrite materials. Mater. Today. Phys. 2023, 36, 101184.
8. Qin, C.; Liu, R.; Sun, Y.; Wu, J.; Zhao, T.; Gong, H. Corrigendum to “Phase formation and magnetic properties of M-type lanthanum substituted strontium ferrites” [Ceram. Int. 49 (2023) 30924-30936]. Ceram. Int. 2023, 49, 41022.
9. Mathews, S. A.; Babu, D. R. Analysis of the role of M-type hexaferrite-based materials in electromagnetic interference shielding. Curr. Appl. Phys. 2021, 29, 39-53.
10. González-angeles, A.; Mendoza-suarez, G.; Grusková, A.; Papánová, M.; Slama, J. Magnetic studies of Zn-Ti-substituted barium hexaferrites prepared by mechanical milling. Mater. Lett. 2005, 59, 26-31.
11. Wartewig, P.; Krause, M.; Esquinazi, P.; Rösler, S.; Sonntag, R. Magnetic properties of Zn- and Ti-substituted barium hexaferrite. J. Magn. Magn. Mater. 1999, 192, 83-99.
12. Solizoda, I.; Zhivulin, V.; Zirnik, G.; et al. Influence of Ti/Al substitution on the structural features, magneitc properties and THz characteristics of M-type hexaferrites. Ceram. Int. 2025, 51, 2811-20.
13. Pullar, R. C. Hexagonal ferrites: a review of the synthesis, properties and applications of hexaferrite ceramics. Prog. Mater. Sci. 2012, 57, 1191-334.
14. Baniasadi, A.; Ghasemi, A.; Nemati, A.; Azami Ghadikolaei, M.; Paimozd, E. Effect of Ti-Zn substitution on structural, magnetic and microwave absorption characteristics of strontium hexaferrite. J. Alloys. Compd. 2014, 583, 325-8.
15. Almessiere, M.; Slimani, Y.; Tashkandi, N.; et al. The effect of Nb substitution on magnetic properties of BaFe12O19 nanohexaferrites. Ceram. Int. 2019, 45, 1691-7.
16. Lu, S.; He, Y.; Liu, Y. Structural and magnetic studies of textured hexagonal ferrite BaFe12-x(ZnHf)xO19. J. Alloys. Compd. 2026, 1062, 187275.
17. Lu, S.; Liu, Y.; Yin, Q.; Chen, J.; Wu, J.; Li, J. Enhanced magnetic properties of Sr0.7Ce0.3Fe11.7Zn0.3O19 by tuning pre-sintering temperature. J. Alloys. Compd. 2023, 941, 168833.
18. Lu, S.; Liu, Y.; Yin, Q.; et al. Investigation of crystal structure, Raman spectroscopy and magnetic properties of La-Zn substituted oriented M-type hexagonal barium ferrites. Mater. Res. Bull. 2024, 172, 112640.
19. Liu, K.; Wang, Q.; Wu, Q.; Zhang, F.; Li, L.; Zheng, H. Cu-Sn co-doped M-type barium ferrites: magnetism, dielectric properties, and ferromagnetic resonance linewidth. Ceram. Int. 2025, 51, 28726-35.
20. Xu, Y.; Aljuhani, W.; Zhang, Y.; Ye, Z.; Li, C.; Bell, S. E. J. A practical approach to quantitative analytical surface-enhanced Raman spectroscopy. Chem. Soc. Rev. 2025, 54, 62-84.
21. Buzinaro, M.; Ferreira, N.; Cunha, F.; Macêdo, M. Hopkinson effect, structural and magnetic properties of M-type Sm3+-doped SrFe12O19 nanoparticles produced by a proteic sol-gel process. Ceram. Int. 2016, 42, 5865-72.
22. Kreisel, J.; Lucazeau, G.; Vincent, H. Raman spectra and vibrational analysis of BaFe12O19 hexagonal ferrite. J. Solid. State. Chem. 1998, 137, 127-37.
23. Chen, Z.; Liu, Y.; Lu, S.; et al. Ga-induced tuning of structural and magnetic properties in BaM hexaferrites for self-biased microwave circulators. Ceram. Int. 2025, 51, 58951-9.
24. Chen, Z.; Liu, Y.; Lu, S.; et al. Effect of Zn2+-Zr4+ co-substitution on grain growth and magnetic properties of c-axis oriented M-type hexaferrites. Ceram. Int. 2025, 51, 7358-69.
25. Lee, K.; Kang, Y.; Yoo, S. Effects of La-Co Co-substitution on the structural and magnetic properties of SrM hexaferrites prepared by solid-state reaction. Appl. Sci. 2024, 14, 848.
26. Zhang, H.; Zeng, D.; Liu, Z. The law of approach to saturation in ferromagnets originating from the magnetocrystalline anisotropy. J. Magn. Magn. Mater. 2010, 322, 2375-80.
27. Chen, Z.; Liu, Y.; Lu, S.; et al. Mechanisms of chromium (Cr) doping on crystal structure and magnetic properties of oriented polycrystalline M-type hexaferrites: a comprehensive study using multiple materials characterization techniques. J. Alloys. Compd. 2025, 1036, 181854.
28. Qin, C.; Sun, Y.; Li, Z.; et al. Effect of Fe deficiency on the crystalline structure and magnetic properties of M-type strontium hexaferrite. Arab. J. Chem. 2023, 16, 105092.
29. Akhtar, M. N.; Rahman, A.; Sulong, A.; Khan, M. A. Structural, spectral, dielectric and magnetic properties of Ni0.5MgxZn0.5-xFe2O4 nanosized ferrites for microwave absorption and high frequency applications. Ceram. Int. 2017, 43, 4357-65.
30. Li, C.; Liu, Q.; Tan, X.; et al. Boosting gyromagnetic performance of W-type hexaferrite through Bi2O3-induced liquid-phase sintering. Ceram. Int. 2025, 51, 56508-16.
31. Azhar Khan, M.; Aslam, S.; Asif Iqbal, M.; et al. Structural spectral, dielectric, and magnetic properties of Mg substituted Ba3CoFe24O41 Z-type hexaferrites. J. Magn. Magn. Mater. 2022, 560, 169589.
32. Trukhanov, S.; Trukhanov, A.; Turchenko, V.; et al. Polarization origin and iron positions in indium doped barium hexaferrites. Ceram. Int. 2018, 44, 290-300.
33. Tan, X.; Liu, Q.; Li, C.; et al. Phase formation, microstructure and magnetic properties of X-type hexaferrite based composite for microwave applications. Ceram. Int. 2025, 51, 17172-80.
34. Li, Q.; Wang, J.; Yao, H. Soft magnetic, gyromagnetic, and microstructural properties of BBSZ-Nb2O5 doped NiCuZn ferrites for LTCC applications. Ceram. Int. 2022, 48, 8653-60.
35. Lei, Y.; Liu, K.; Huo, X.; et al. Effect of Sr2+ and Cr3+ co-doping on the microstructure and high-frequency electromagnetic properties of M-type barium hexaferrites for microwave applications. Ceram. Int. 2025, 51, 22317-26.
36. Yang, W.; Qian, Y.; Zheng, H. Hot press sintering of Bi-Zn-In-Sn doped yttrium iron garnet ferrite: magnetism, ferromagnetic resonance linewidth and dielectric properties. Ceram. Int. 2025, 51, 23779-87.
37. Lei, Y.; Liu, K.; Huo, X.; et al. Tailored magnetic and microwave characterizations of La-Al doped BaM hexaferrites for millimeter-wave band applications. J. Alloys. Compd. 2025, 1042, 183968.
38. Mu, Y.; Yi, Y.; Zhu, W.; Zhang, M. Numerical calculation method of shape demagnetization tensor spatially profile for cuboid. Phys. Scr. 2025, 100, 045008.
39. Akaiwa, Y.; Okazaki, T. An application of a hexagonal ferrite to a millimeter-wave Y circulator. In IEEE Transactions on Magnetics, 1974; Vol. 10, pp. 374-8.
40. O’neil, B.; Young, J. Experimental investigation of a self-biased microstrip circulator. In IEEE Transactions on Microwave Theory and Techniques, 2009; Vol. 57, pp. 1669-74.
41. Dai, Y.; Lan, Z.; Yu, Z.; et al. Effects of La substitution on micromorphology, static magnetic properties and low ferromagnetic resonance linewidth of self-biased M-type Sr hexaferrites for high frequency application. Ceram. Int. 2021, 47, 8980-6.
42. Laur, V.; Verissimo, G.; Queffelec, P.; et al. Self-biased Y-junction circulators using lanthanum- and cobalt-substituted strontium hexaferrites. In IEEE Transactions on Microwave Theory and Techniques, 2015; Vol. 63, pp. 4376-81.
43. Zhong, L.; Lan, Z.; Li, Q.; et al. Synergetic effect of site-controlled two-step Ca doping on magnetic and electrical properties of M-type strontium hexaferrites. J. Eur. Ceram. Soc. 2023, 43, 5521-9.
Cite This Article
How to Cite
Download Citation
Export Citation File:
Type of Import
Tips on Downloading Citation
Citation Manager File Format
Type of Import
Direct Import: When the Direct Import option is selected (the default state), a dialogue box will give you the option to Save or Open the downloaded citation data. Choosing Open will either launch your citation manager or give you a choice of applications with which to use the metadata. The Save option saves the file locally for later use.
Indirect Import: When the Indirect Import option is selected, the metadata is displayed and may be copied and pasted as needed.
About This Article
Copyright

Data & Comments
Data
0


Comments
Comments must be written in English. Spam, offensive content, impersonation, and private information will not be permitted. If any comment is reported and identified as inappropriate content by OAE staff, the comment will be removed without notice. If you have any queries or need any help, please contact us at [email protected].