


fig3
From: Phase-field simulation of electrocaloric effect in textured Ba0.8Sr0.2TiO3 polycrystalline ceramics
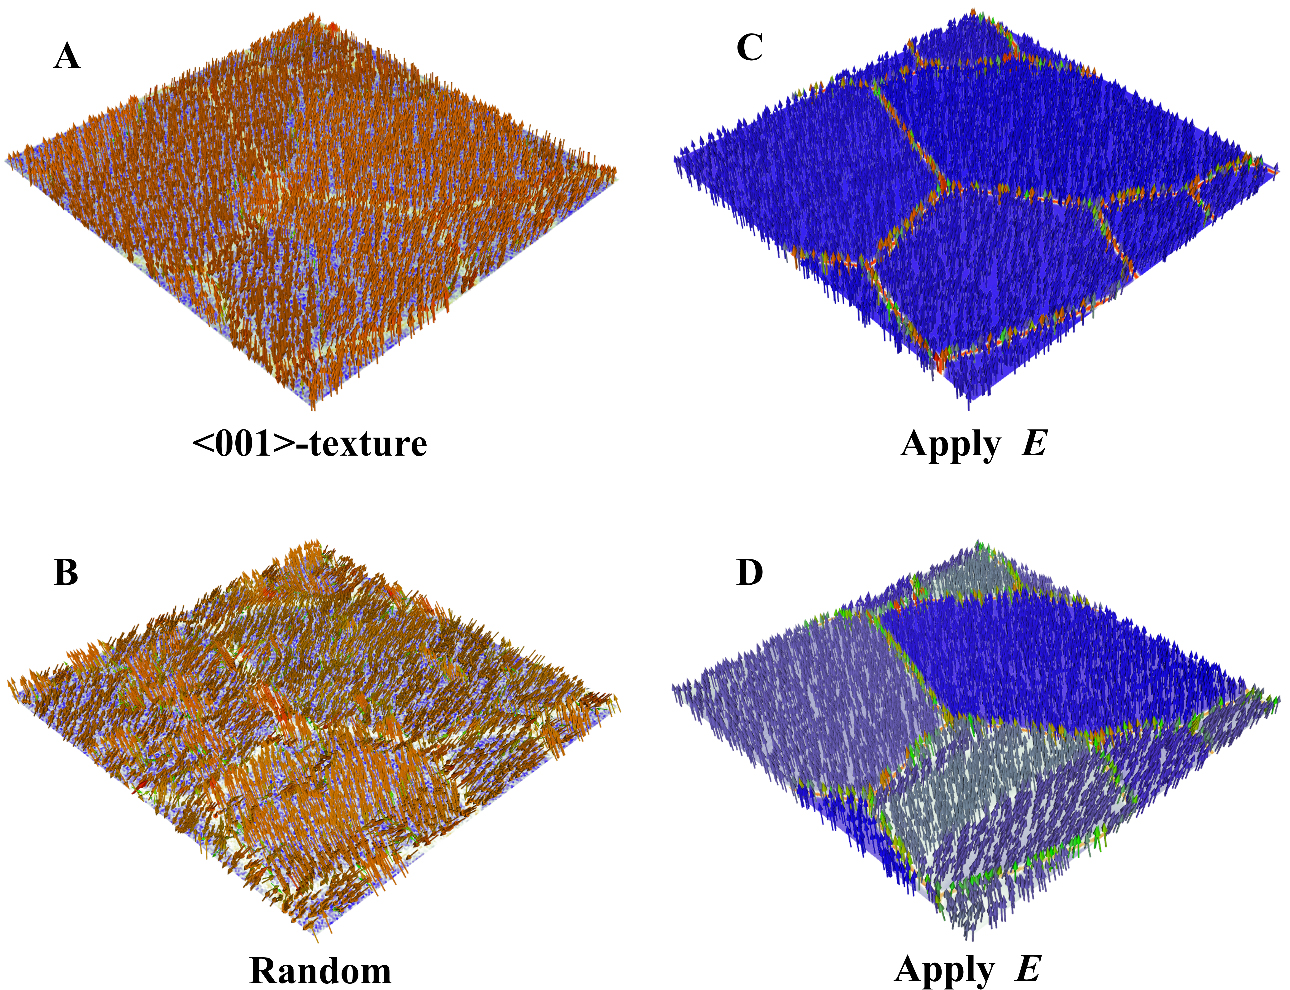
Figure 3. The left side (A) and (B) represent the initial domain structure characterized by -texture and random ceramics, while the right side (C) and (D) illustrate the domain structure under the influence of an applied electric field. The orientation of the arrows illustrated in the figure indicates the direction of polarization. The white contours in panels (A) and (B), along with the red arrows in panel (C) and the green arrows in panel (D), represent the polarization direction at the grain boundaries.


