


fig1
From: Phase-field simulation of electrocaloric effect in textured Ba0.8Sr0.2TiO3 polycrystalline ceramics
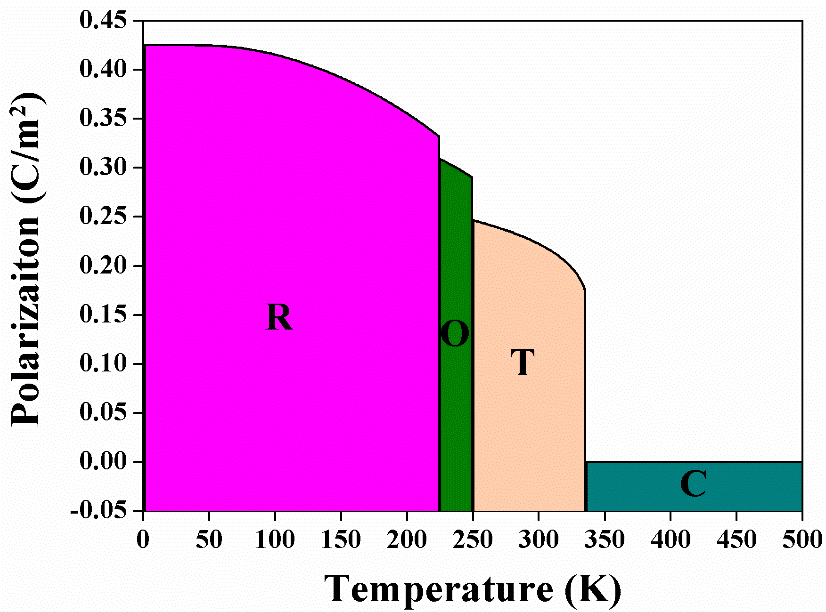
Figure 1. Phase diagram of the solid solution BaxSr(1-x)TiO3 with Sr content of 0.2, showing the temperature ranges for different phases (R, O, T, and C). R phase: rhombohedral; O phase: orthorhombic; T phase: tetragonal; C phase: cubic.


