


fig4
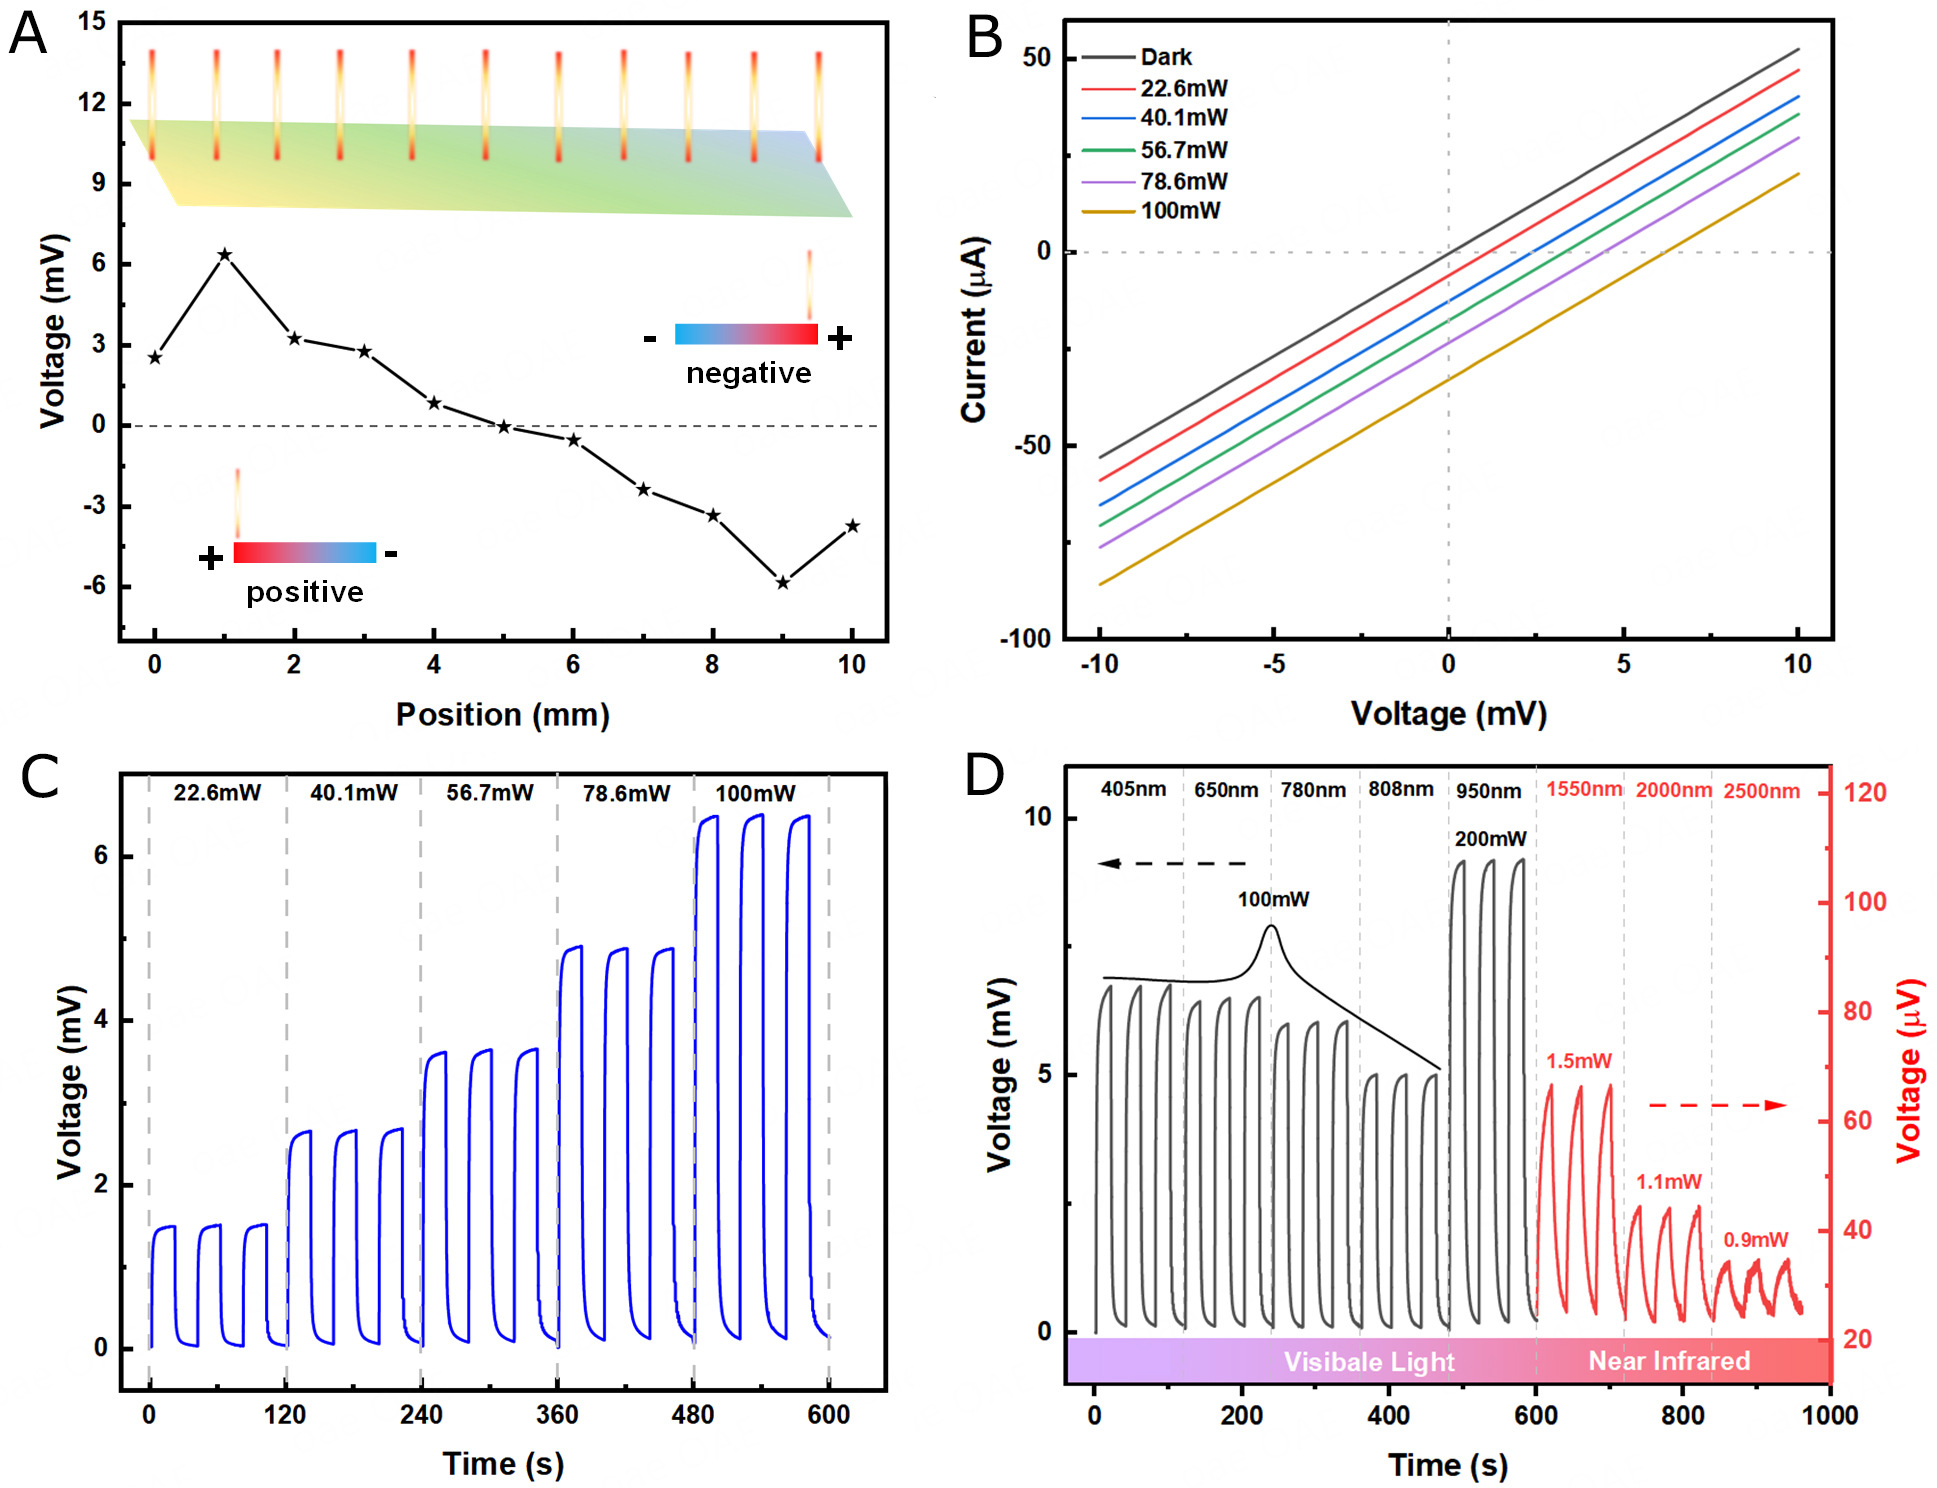
Figure 4. (A) Output voltage versus laser beam position. The wavelength was 650 nm with a power of 100 mW; (B and C) Output voltage and I-V curves at different optical powers. The wavelength was 650 nm; (D) Plots of output voltage versus laser wavelength. The black curve was obtained by testing with a laser light source and the red curve was obtained by combining a monochromator with a xenon light source. I-V: Current-voltage.


