


fig7
From: Fluorine-doped titanium dioxide nanorod arrays for efficient photoelectrochemical water splitting
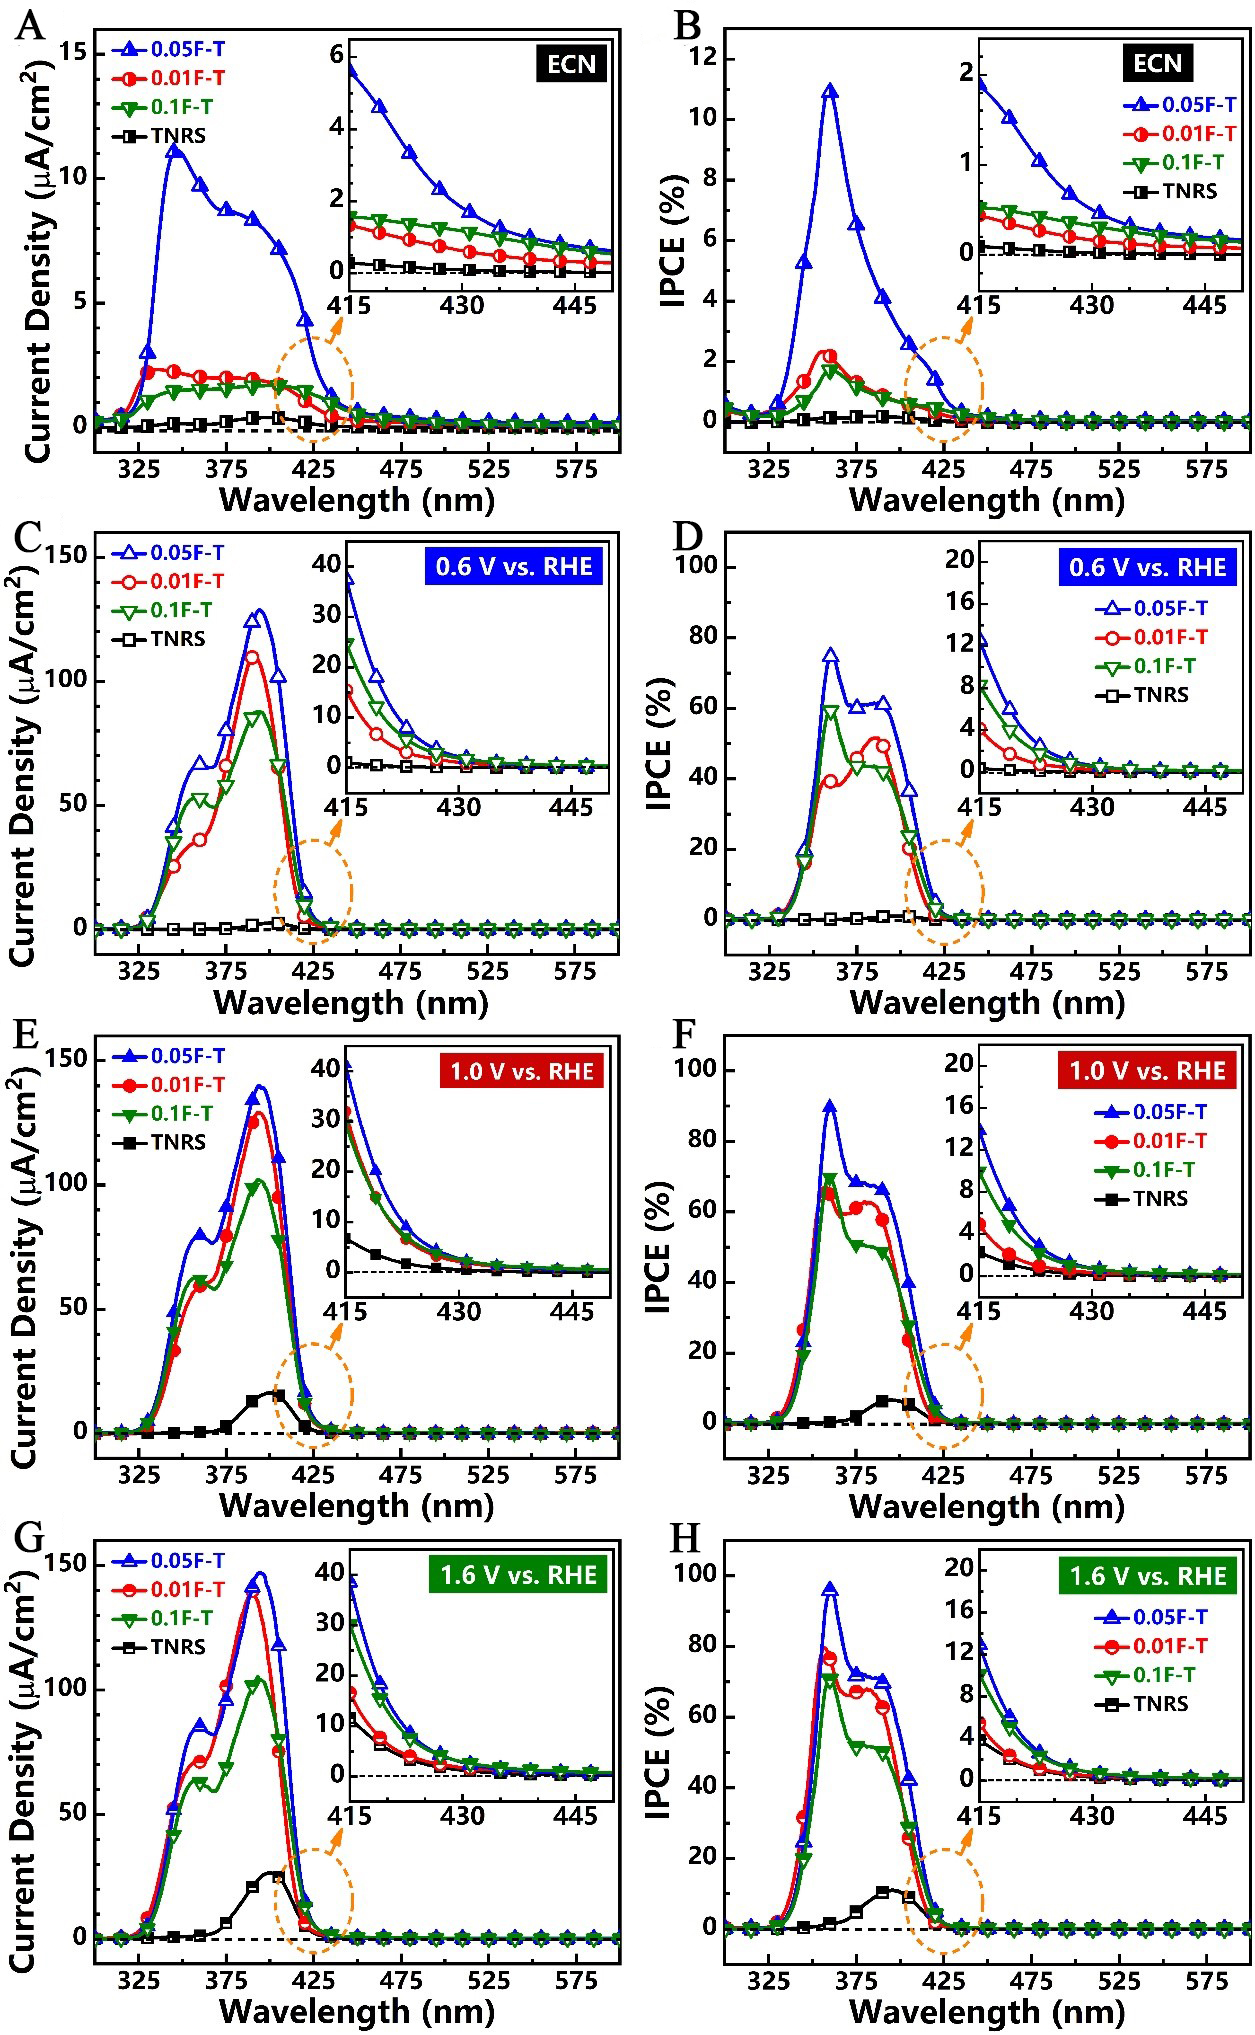
Figure 7. Wavelength scanning vs. photocurrent density curves and wavelength scanning vs. IPCE curves of TNRS, 0.01F-T, 0.05F-T, and 0.1F-T photoanode in Electrochemical noise model (A and B); the wavelength scanning vs. photocurrent density /IPCE curves with bios voltage at 0.6 V (vs. RHE) (C and D); at 1.0 V vs. RHE (E and F); and 1.6 V vs. RHE (G and H) of TNRS, 0.01F-T, 0.05F-T, and 0.1F-T photoanodes, respectively. 1 M KOH as electrolyte. ECN: Electrochemical noise; RHE: reversible hydrogen electrode; IPCE: incident photon-to-current efficiency; F-T: F-doped TiO2 nanorods; TNRS: TiO2 nanorod sample.


