


fig5
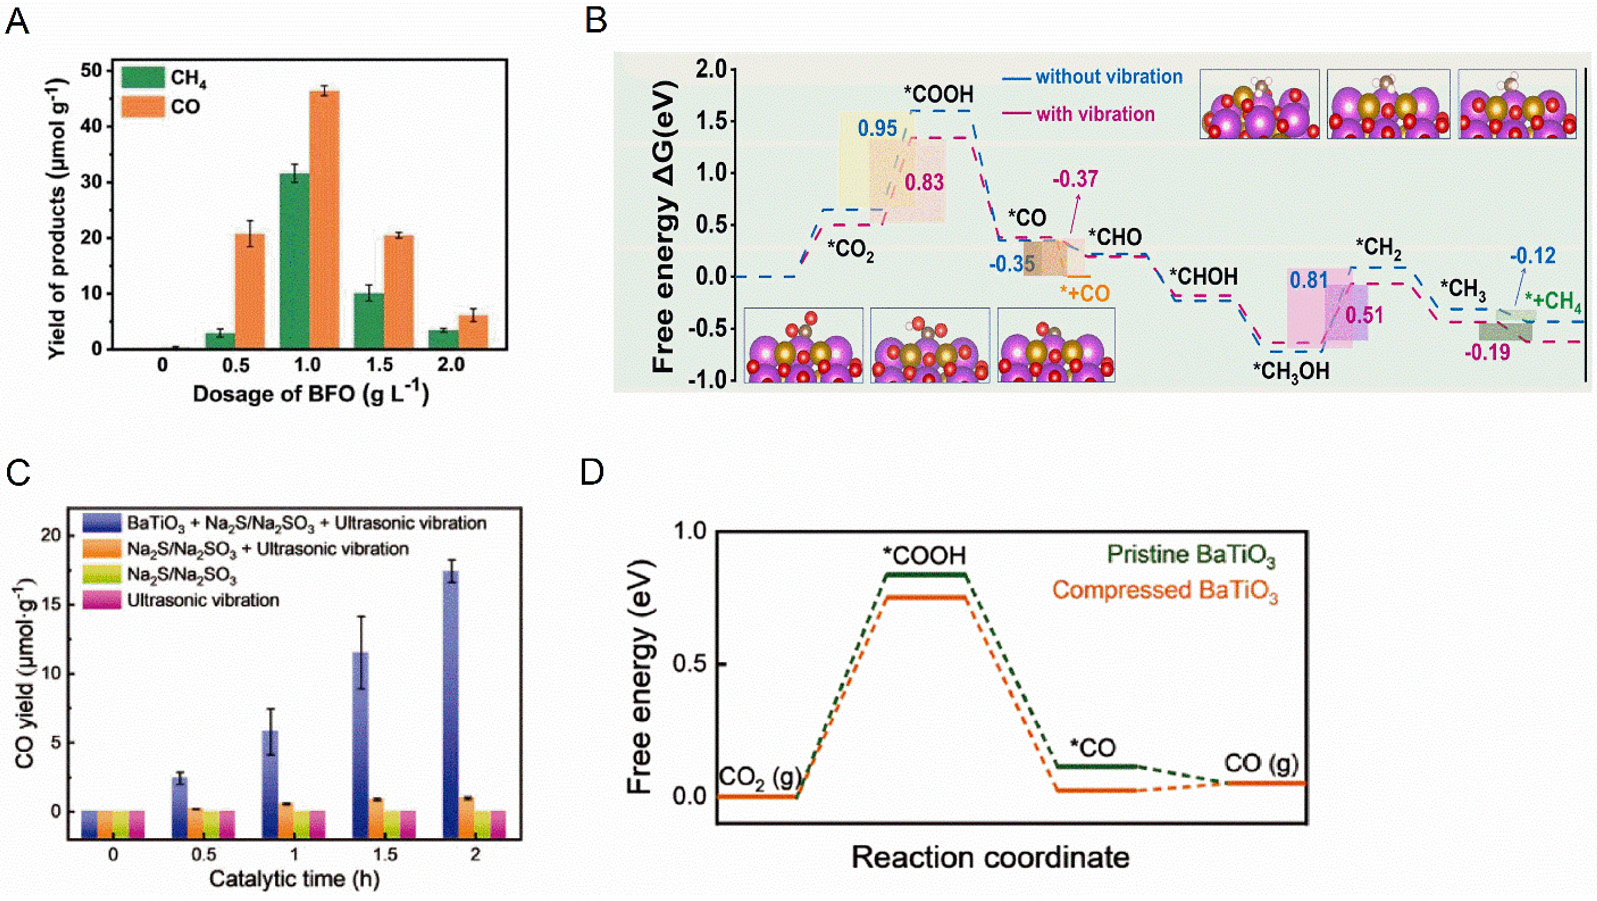
Figure 5. (A) Yield of CO2 reduction products at different doses of BiFeO3 and (B) ΔG plots of methane and CO production during catalytic reduction of CO2. This figure is quoted with permission[116]. (C) CO yield using BaTiO3 with the addition of Na2S/Na2SO3 as sacrificial agent and (D) Free energy and structures of CO2 reduction to CO on the BaO-terminated (001) surface of BaTiO3 diagram of CO2 reduction to CO on BaTiO3 (001) by DFT calculations. This figure is quoted with permission[118].


