


fig8
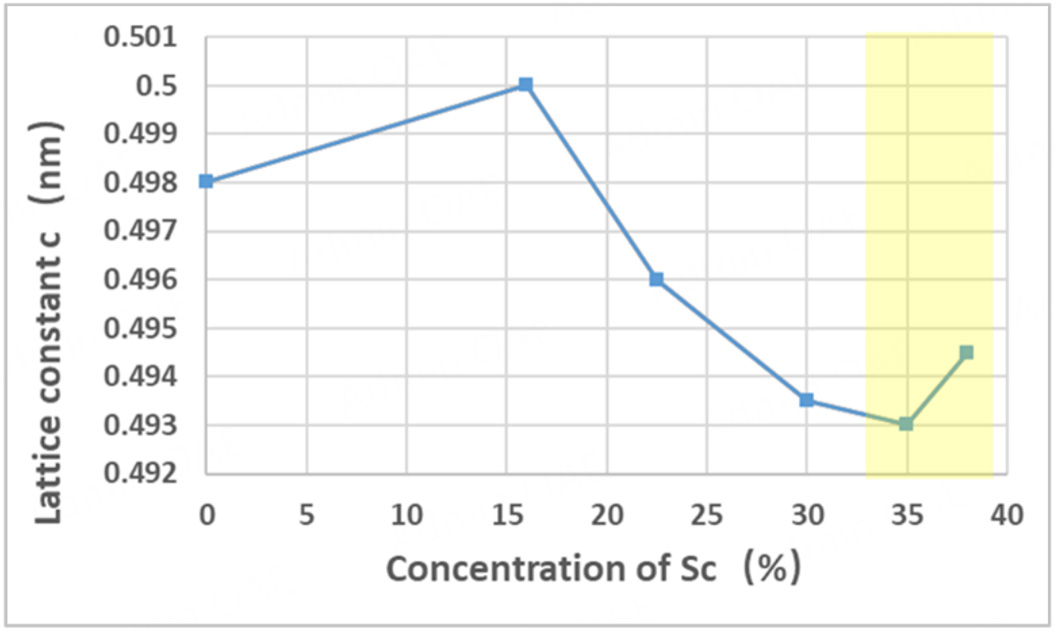
Figure 8. Dependence of the c-axis lattice constant on Sc concentration in Al1-xScxN. The two-phase coexistence region is highlighted in yellow. Adapted from Ref.[74].
Figure 8. Dependence of the c-axis lattice constant on Sc concentration in Al1-xScxN. The two-phase coexistence region is highlighted in yellow. Adapted from Ref.[74].


All published articles are preserved here permanently:
https://www.portico.org/publishers/oae/


