


fig6
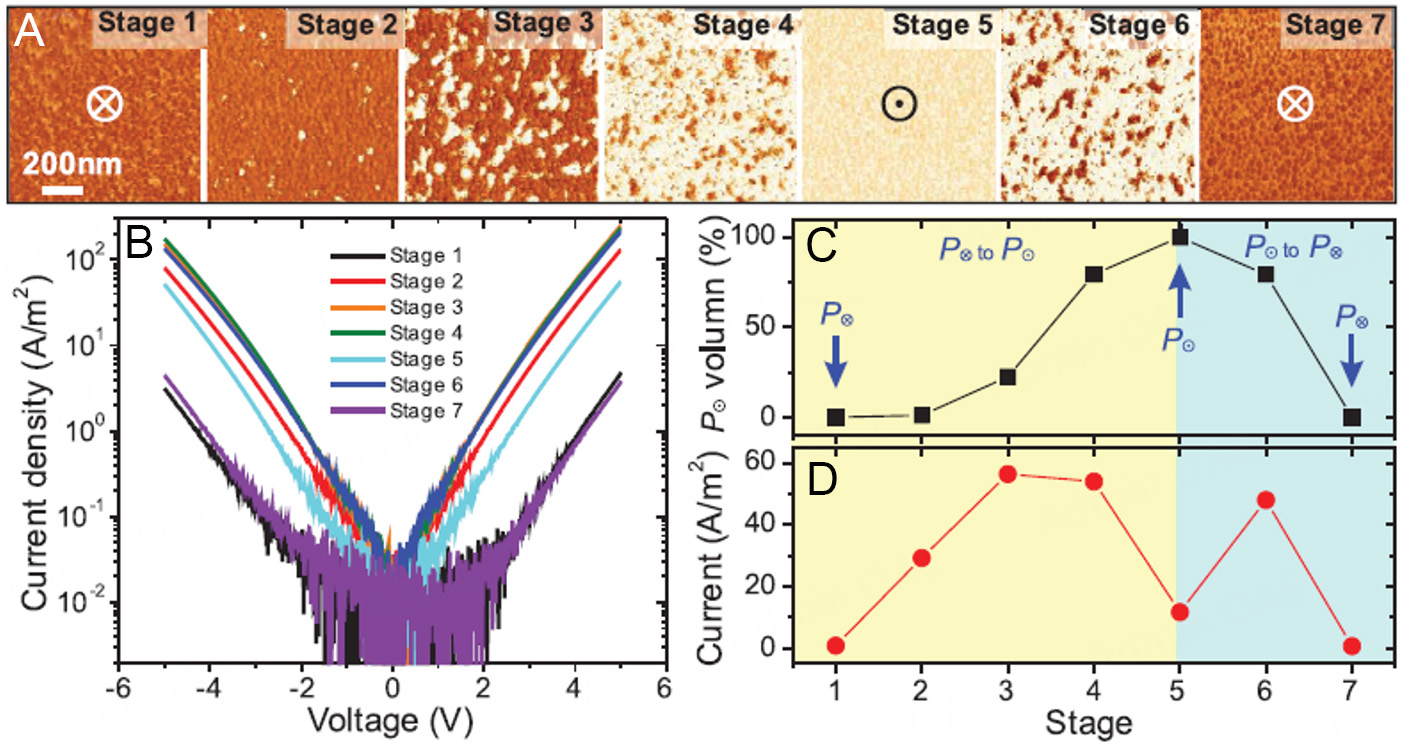
Figure 6. I-V measurements of steady-state conductance in 20-nm-thick Al0.72Sc0.28N capacitors during various switching stages. (A) PFM images of the domain structures at each switching stage with a fixed poling voltage of 13 V. (B) Corresponding I-V characteristics. (C and D) Estimated polarization switching fractions (percentage of domains in the upward state) (C), and corresponding leakage currents at 4 V (D) for each switching stage[70].


