
fig3
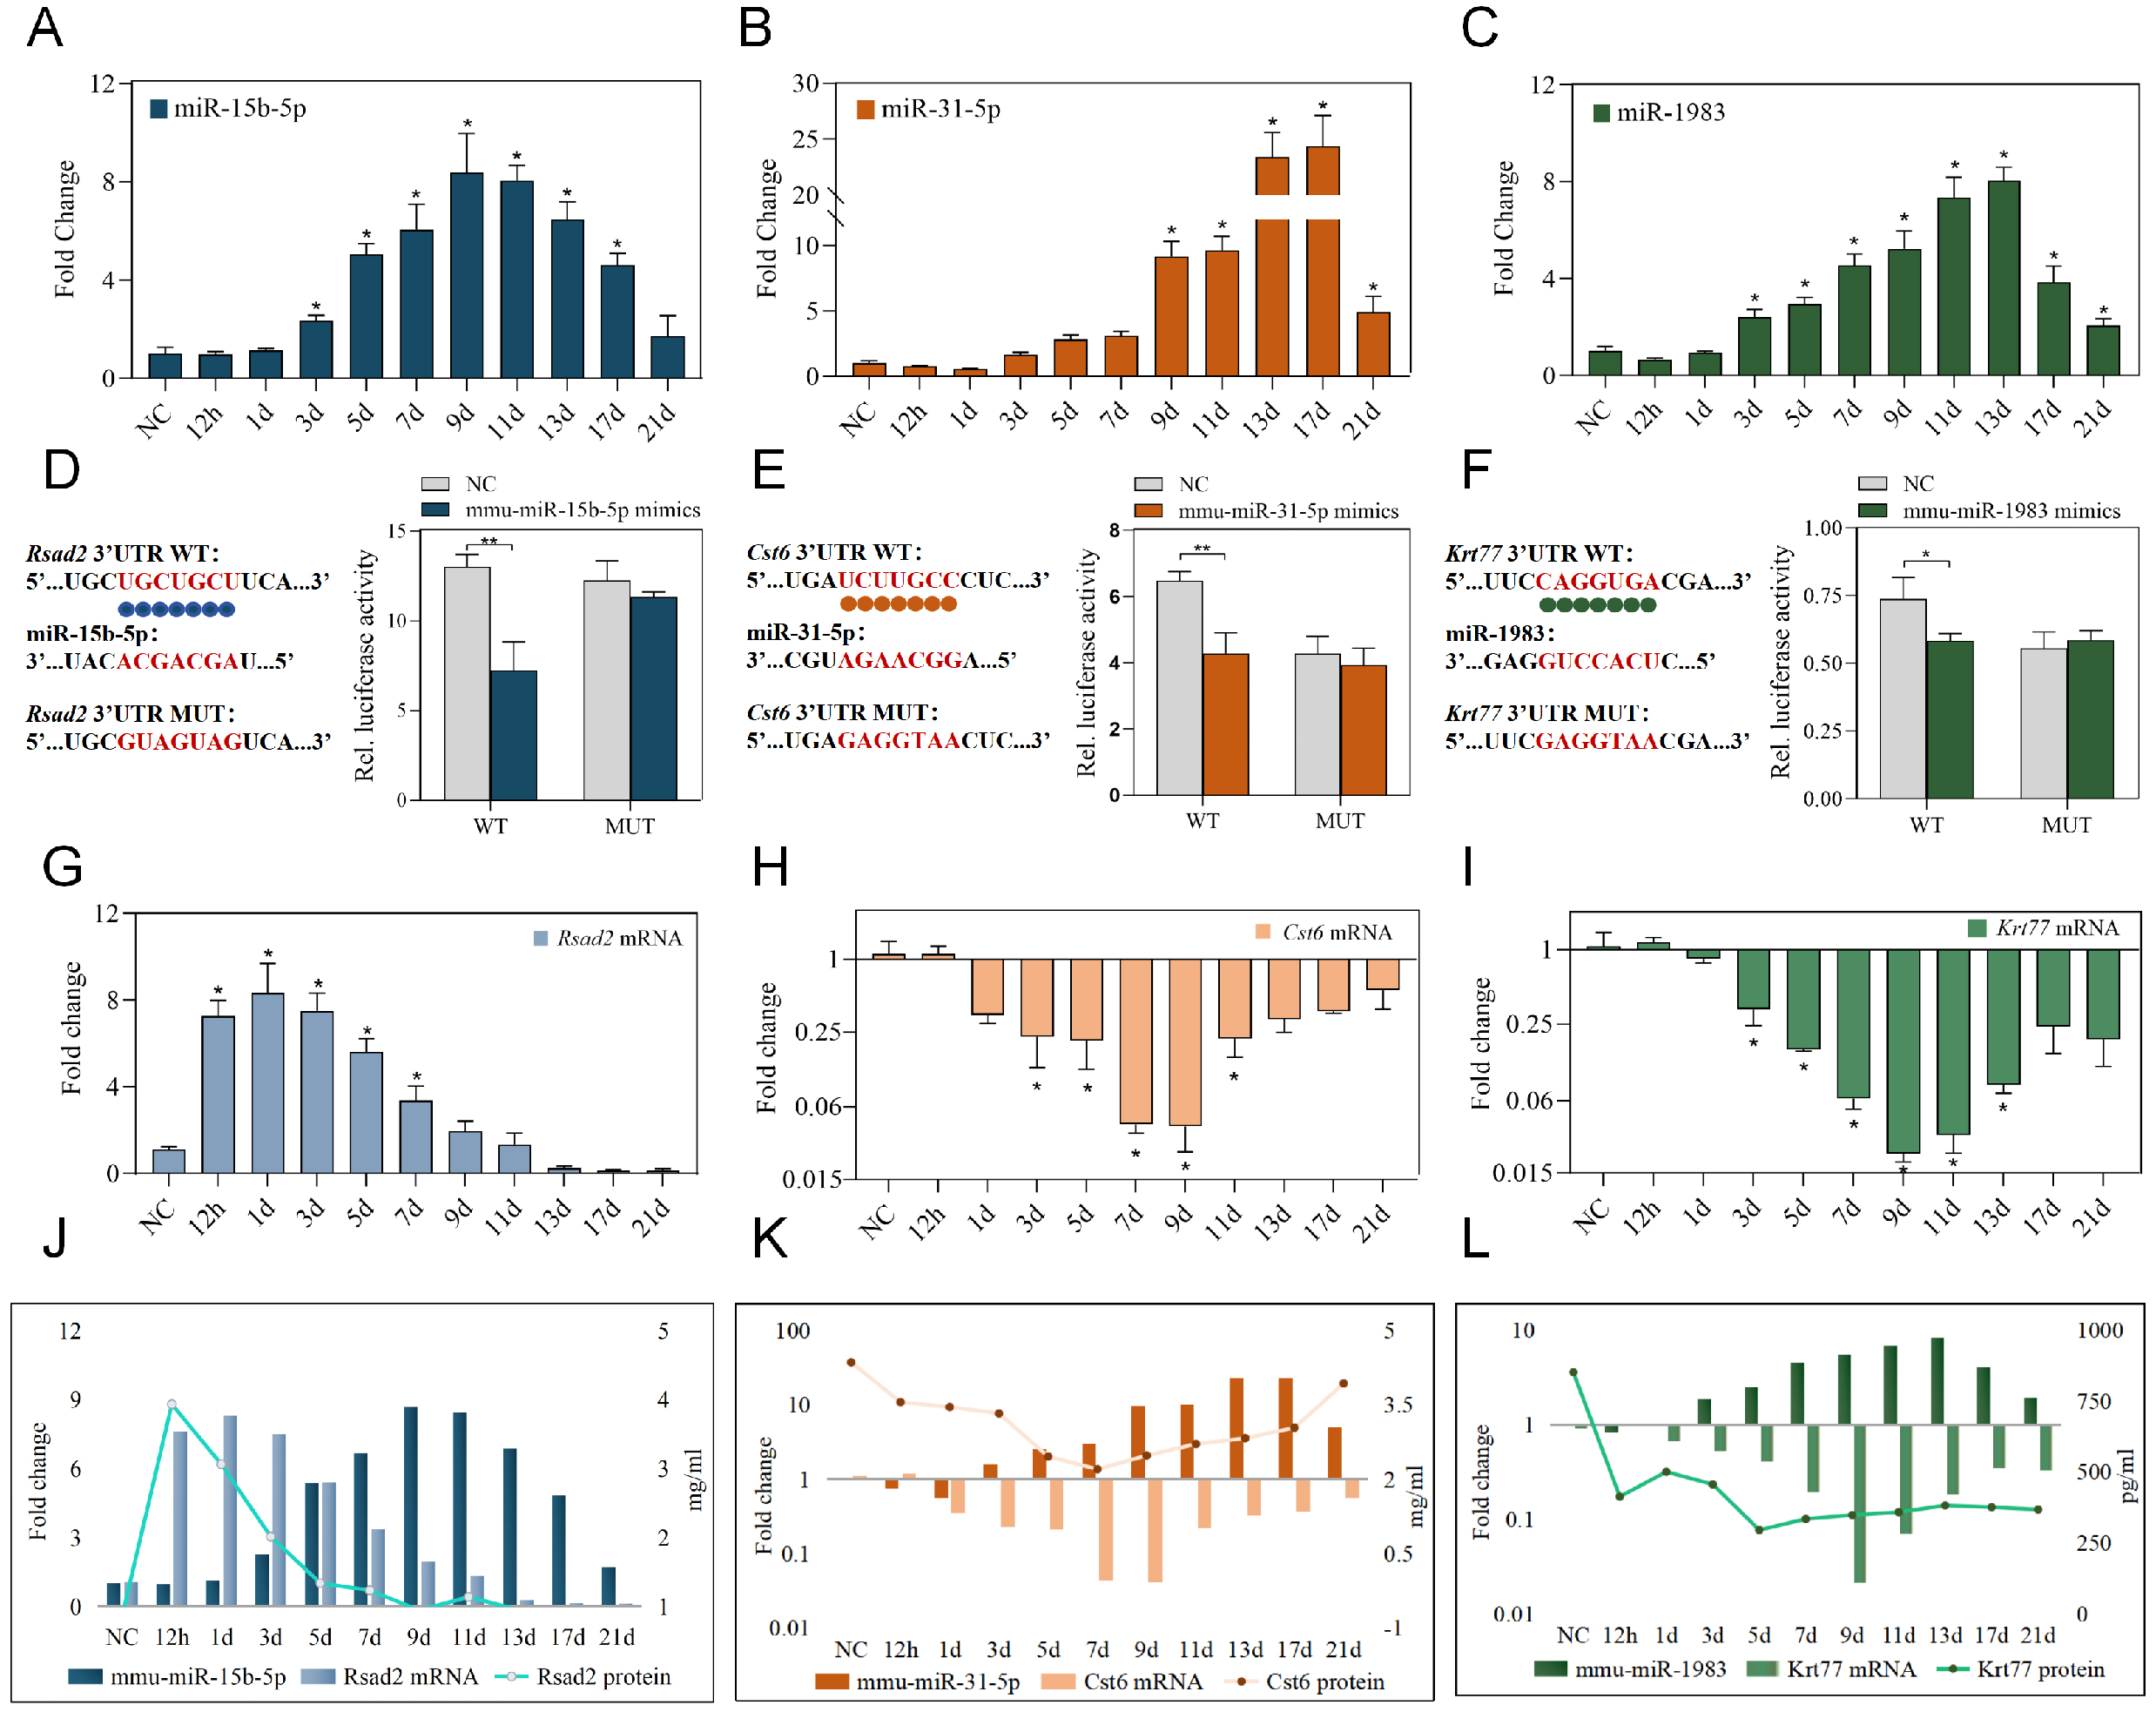
Figure 3. Validation of miRNA-mRNA-protein triads during skin wound healing. (A-C) Relative expression levels of mmu-miR-15b-5p (A); mmu-miR-31-5p (B); and mmu-miR-1983 (C) in normal skin and at indicated post-injury time points, as determined by RT-qPCR. Expression levels were normalized to NC group (set as 1). Data were analyzed by one-way ANOVA followed by Tukey’s post-hoc test; n = 3, *P < 0.05 vs. NC group; (D-F) Schematic diagrams showing the predicted binding sites of mmu-miR-15b-5p within the 3’UTR of Rsad2 mRNA (D); mmu-miR-31-5p within the 3’UTR of Cst6 mRNA (E); and mmu-miR-1983 within the 3’UTR of Krt77 mRNA (F), along with the corresponding mutant sequences. Bar graphs represent the dual-luciferase reporter activities following co-transfection with wild-type or mutant constructs and corresponding miRNA mimics. Data are presented as mean ± SD, analyzed by unpaired t-test, n = 3, *P < 0.05 and **P < 0.01 vs. NC group; (G-I) Relative expression levels of Rsad2 mRNA (G), Cst6 mRNA (H), and Krt77 mRNA (I) in normal skin and at indicated post-injury time points, as determined by RT-qPCR. Expression levels were normalized to NC group (set as 1). Data were analyzed by one-way ANOVA followed by Tukey’s post-hoc test; n = 3, *P < 0.05 vs. NC group; (J-L) Expression patterns of the mmu-miR-15b-5p/Rsad2/RSAD2 triad (J), mmu-miR-31-5p/ Cst6/CST6 triad (K), and mmu-miR-1983/Krt77/KRT77 triad (L) during skin wound healing. The expression dynamics of each miRNA, its target mRNA, and the corresponding protein are shown to illustrate the coordinated inverse relationships within each triad. WT: Wild type; MUT: mutant; NC: ANOVA: analysis of variance; RT-qPCR: reverse transcription quantitative real-time PCR; 3’UTR: 3' untranslated region; SD: standard deviation.

