
fig3
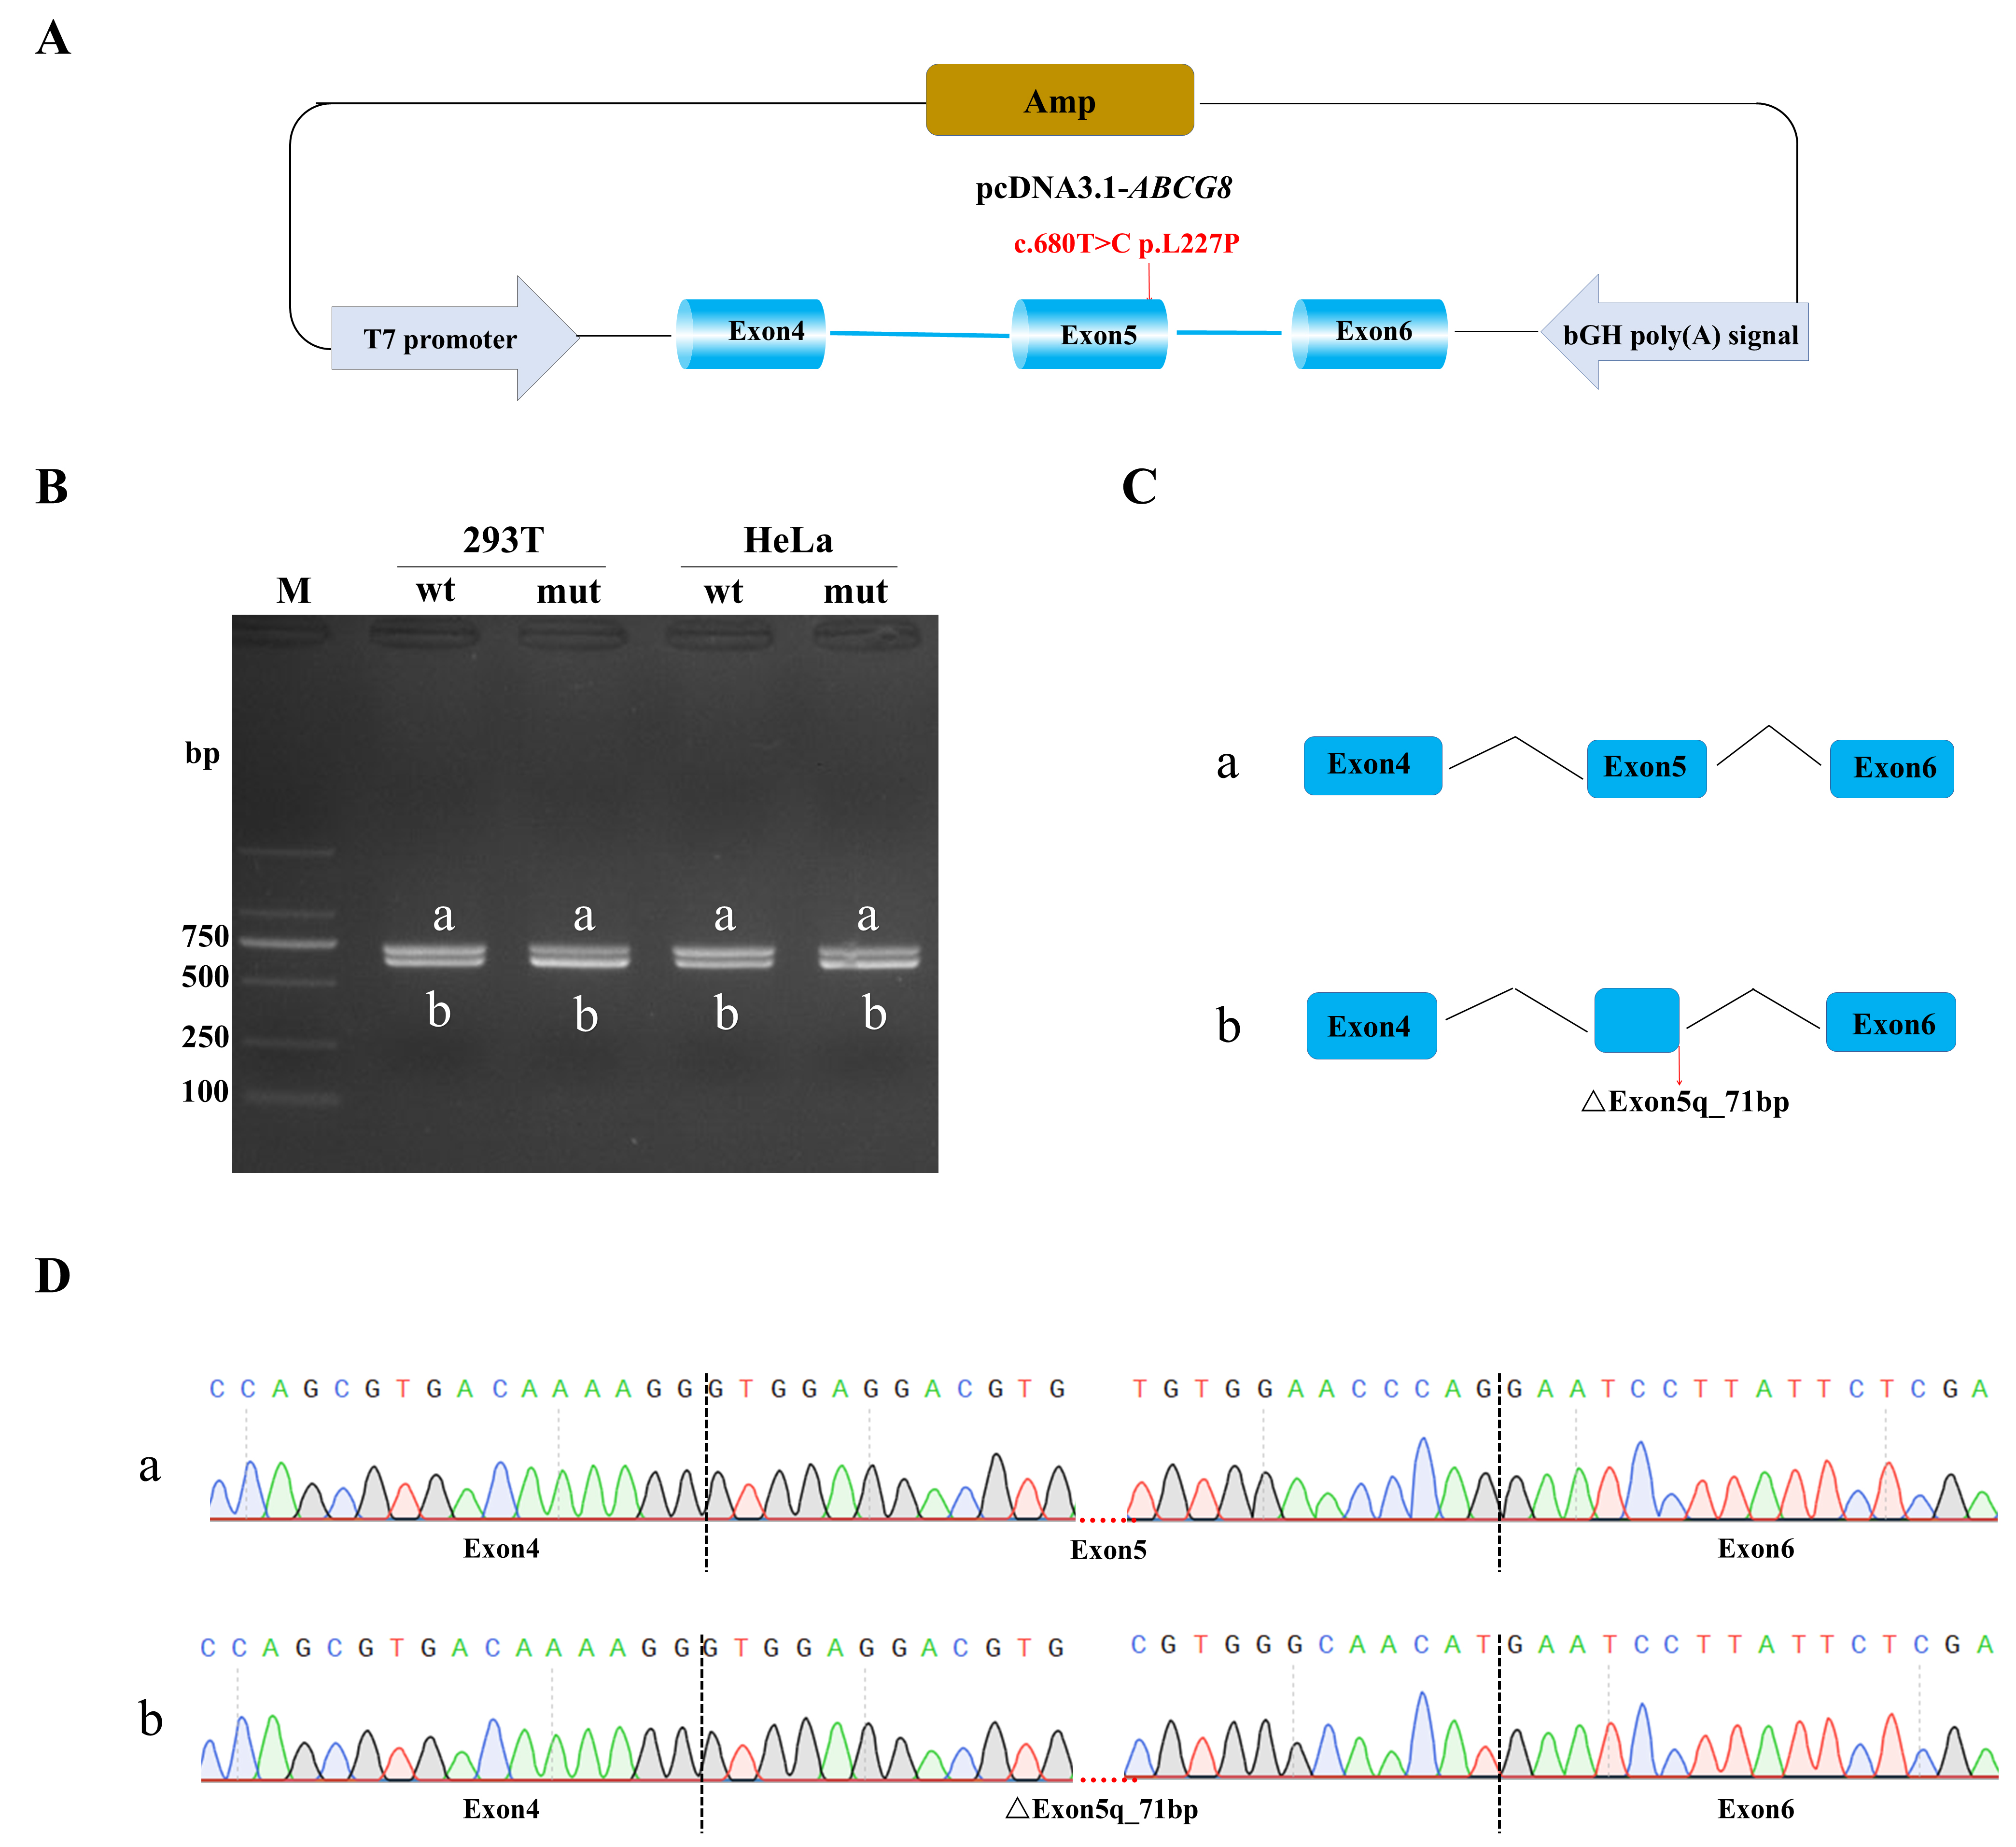
Figure 3. The results of minigene verification. (A) Minigenes were constructed with the pcDNA3.1 vector; (B) Transcription analysis of the minigene. Band a corresponds to the normally spliced transcript (713 bp), whereas band b shows a deletion of 71 bases from the 3’ region of exon 5; (C) Cartoon illustration of the splicing abnormalities in the minigene experiment. “a” means band a, normal transcript; and “b” means band b, aberrantly spliced product; (D) Sanger sequencing of the minigene cDNA. “a” means band a, normal transcript; and “b” means band b, aberrantly spliced product.