


fig5
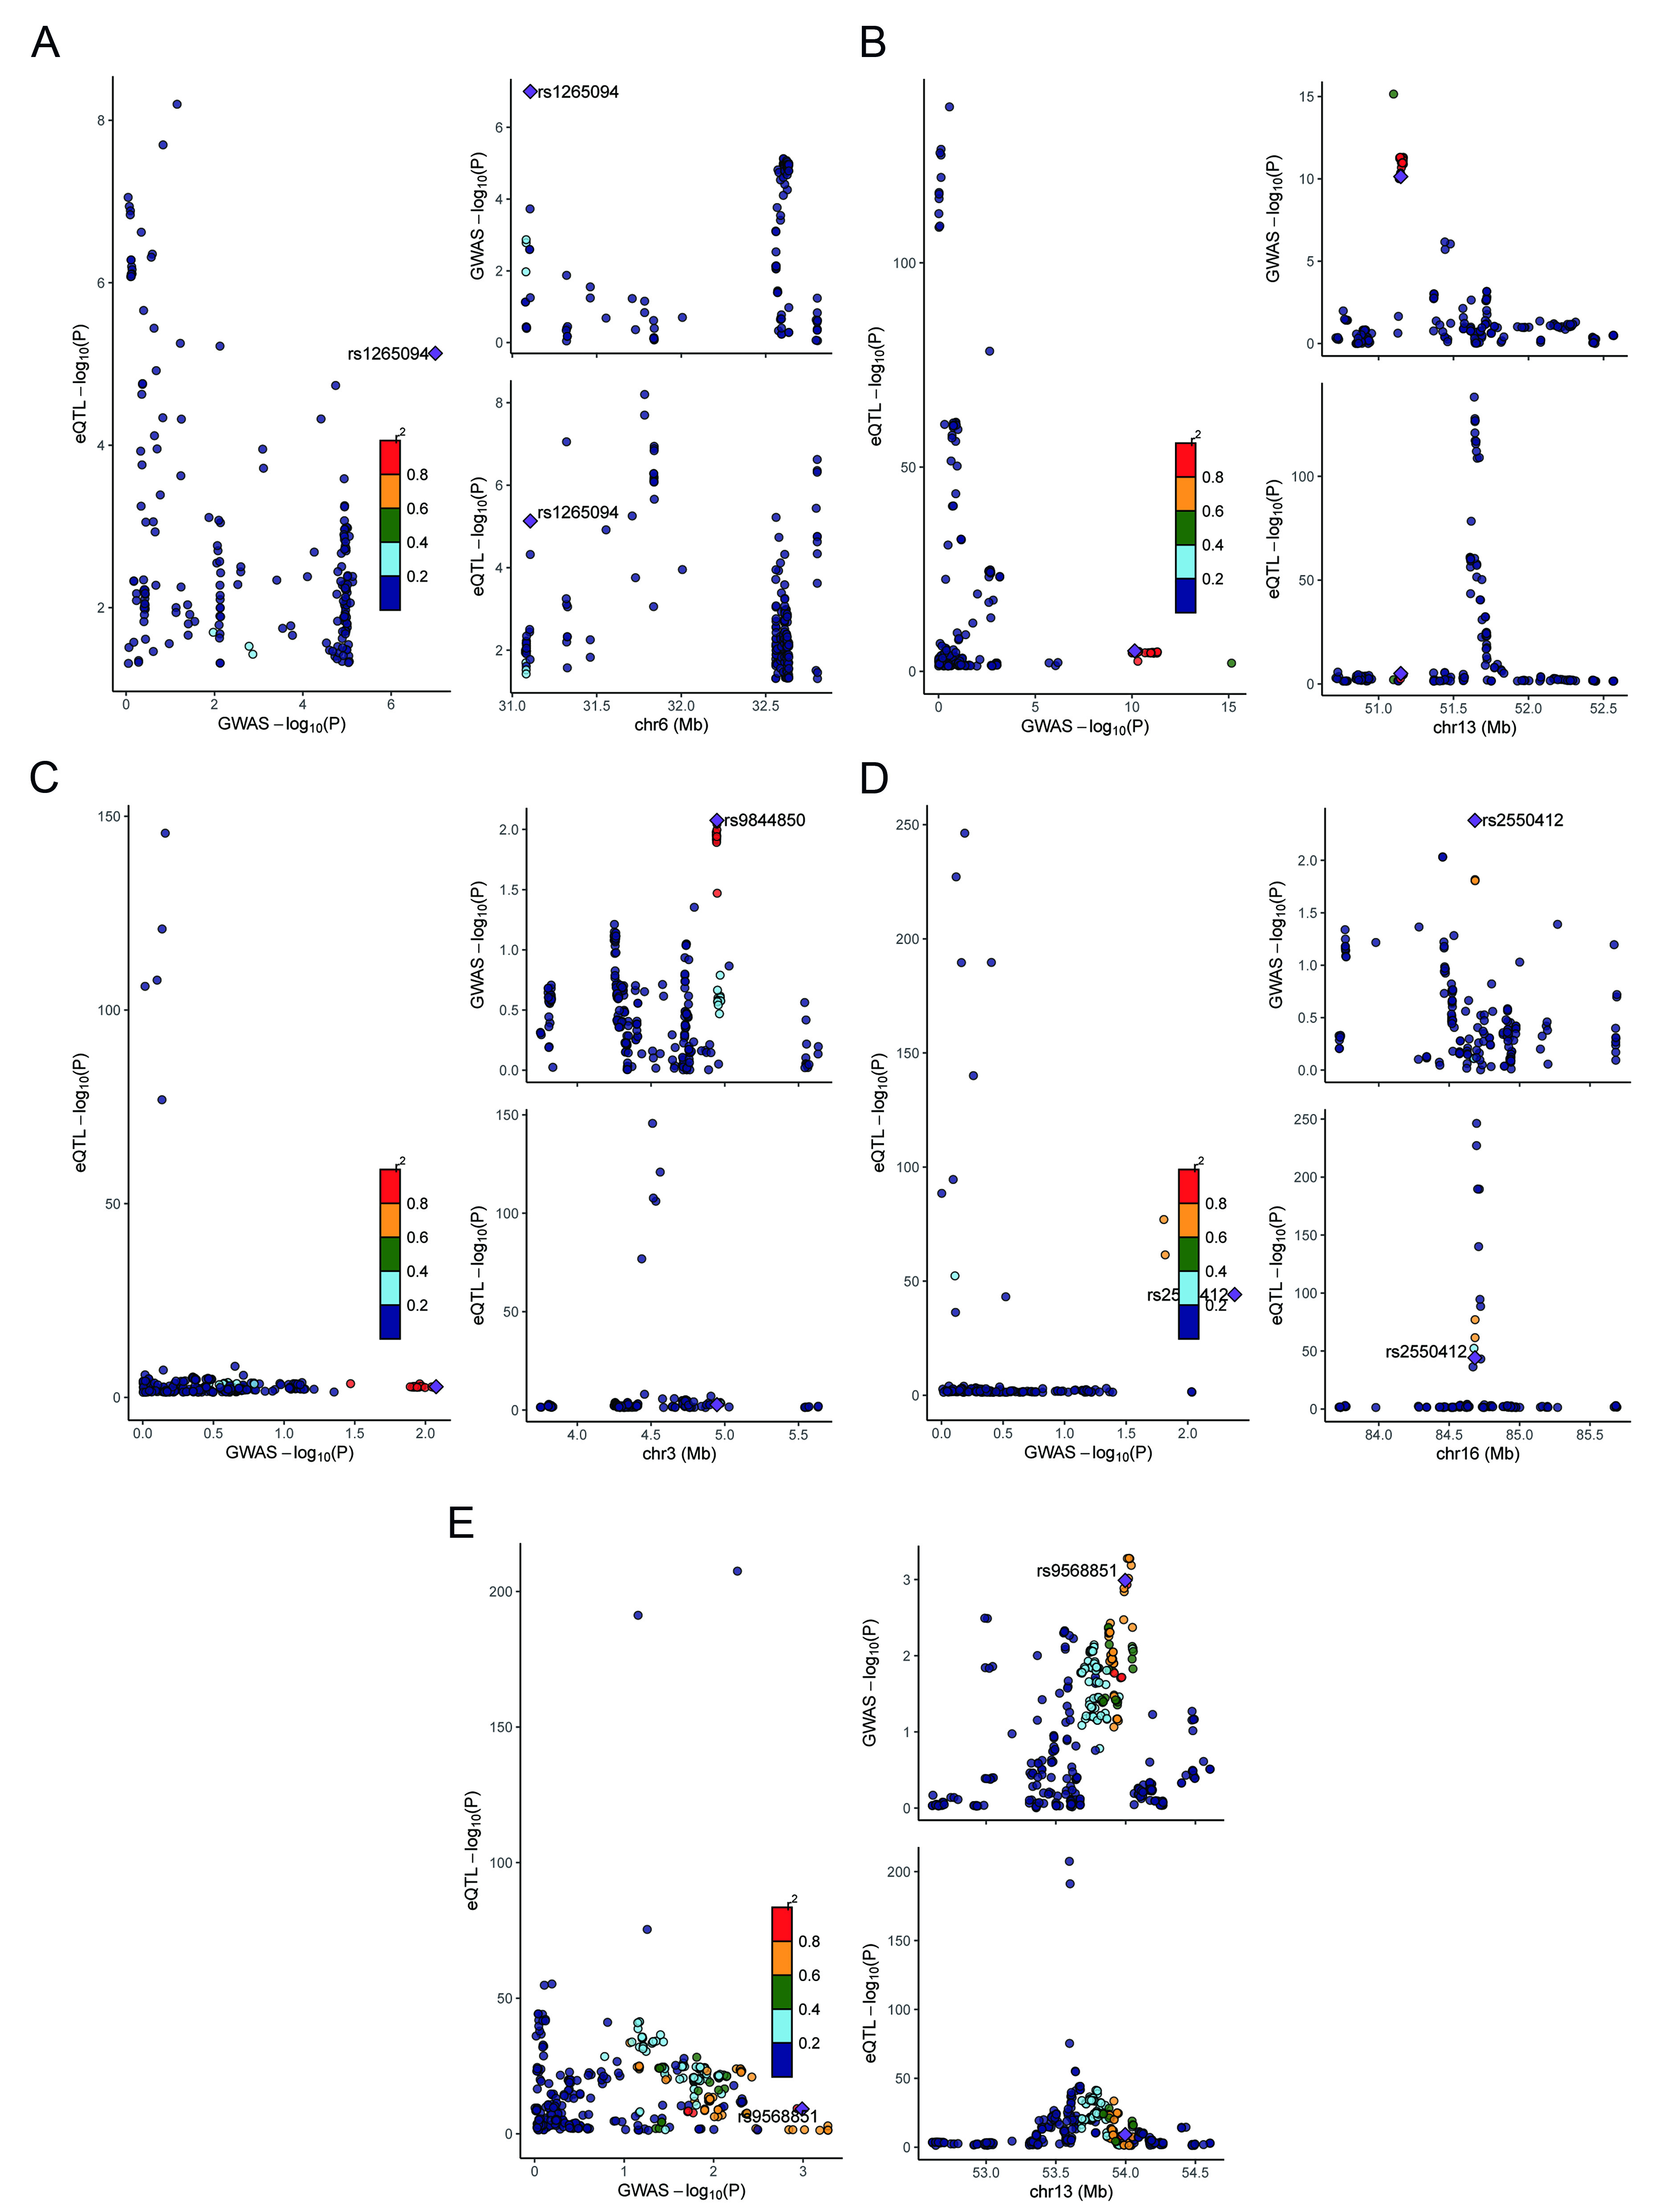
Figure 5. Colocalization analysis. (A-E) Regional association plots comparing GWAS and eQTL signals for C2, GUCY1B2, OLFM4, ITPR1, and KLHL36. Left panels display the relationship between GWAS and eQTL association signals, whereas right panels show regional association patterns across genomic coordinates. eQTL: Expression quantitative trait locus; GWAS: Genome-wide association study; C2: complement component 2; GUCY1B2: guanylate cyclase 1 soluble subunit beta 2; OLFM4: olfactomedin 4; ITPR1: inositol 1,4,5-trisphosphate receptor type 1; KLHL36: kelch like family member 36.


