


fig7
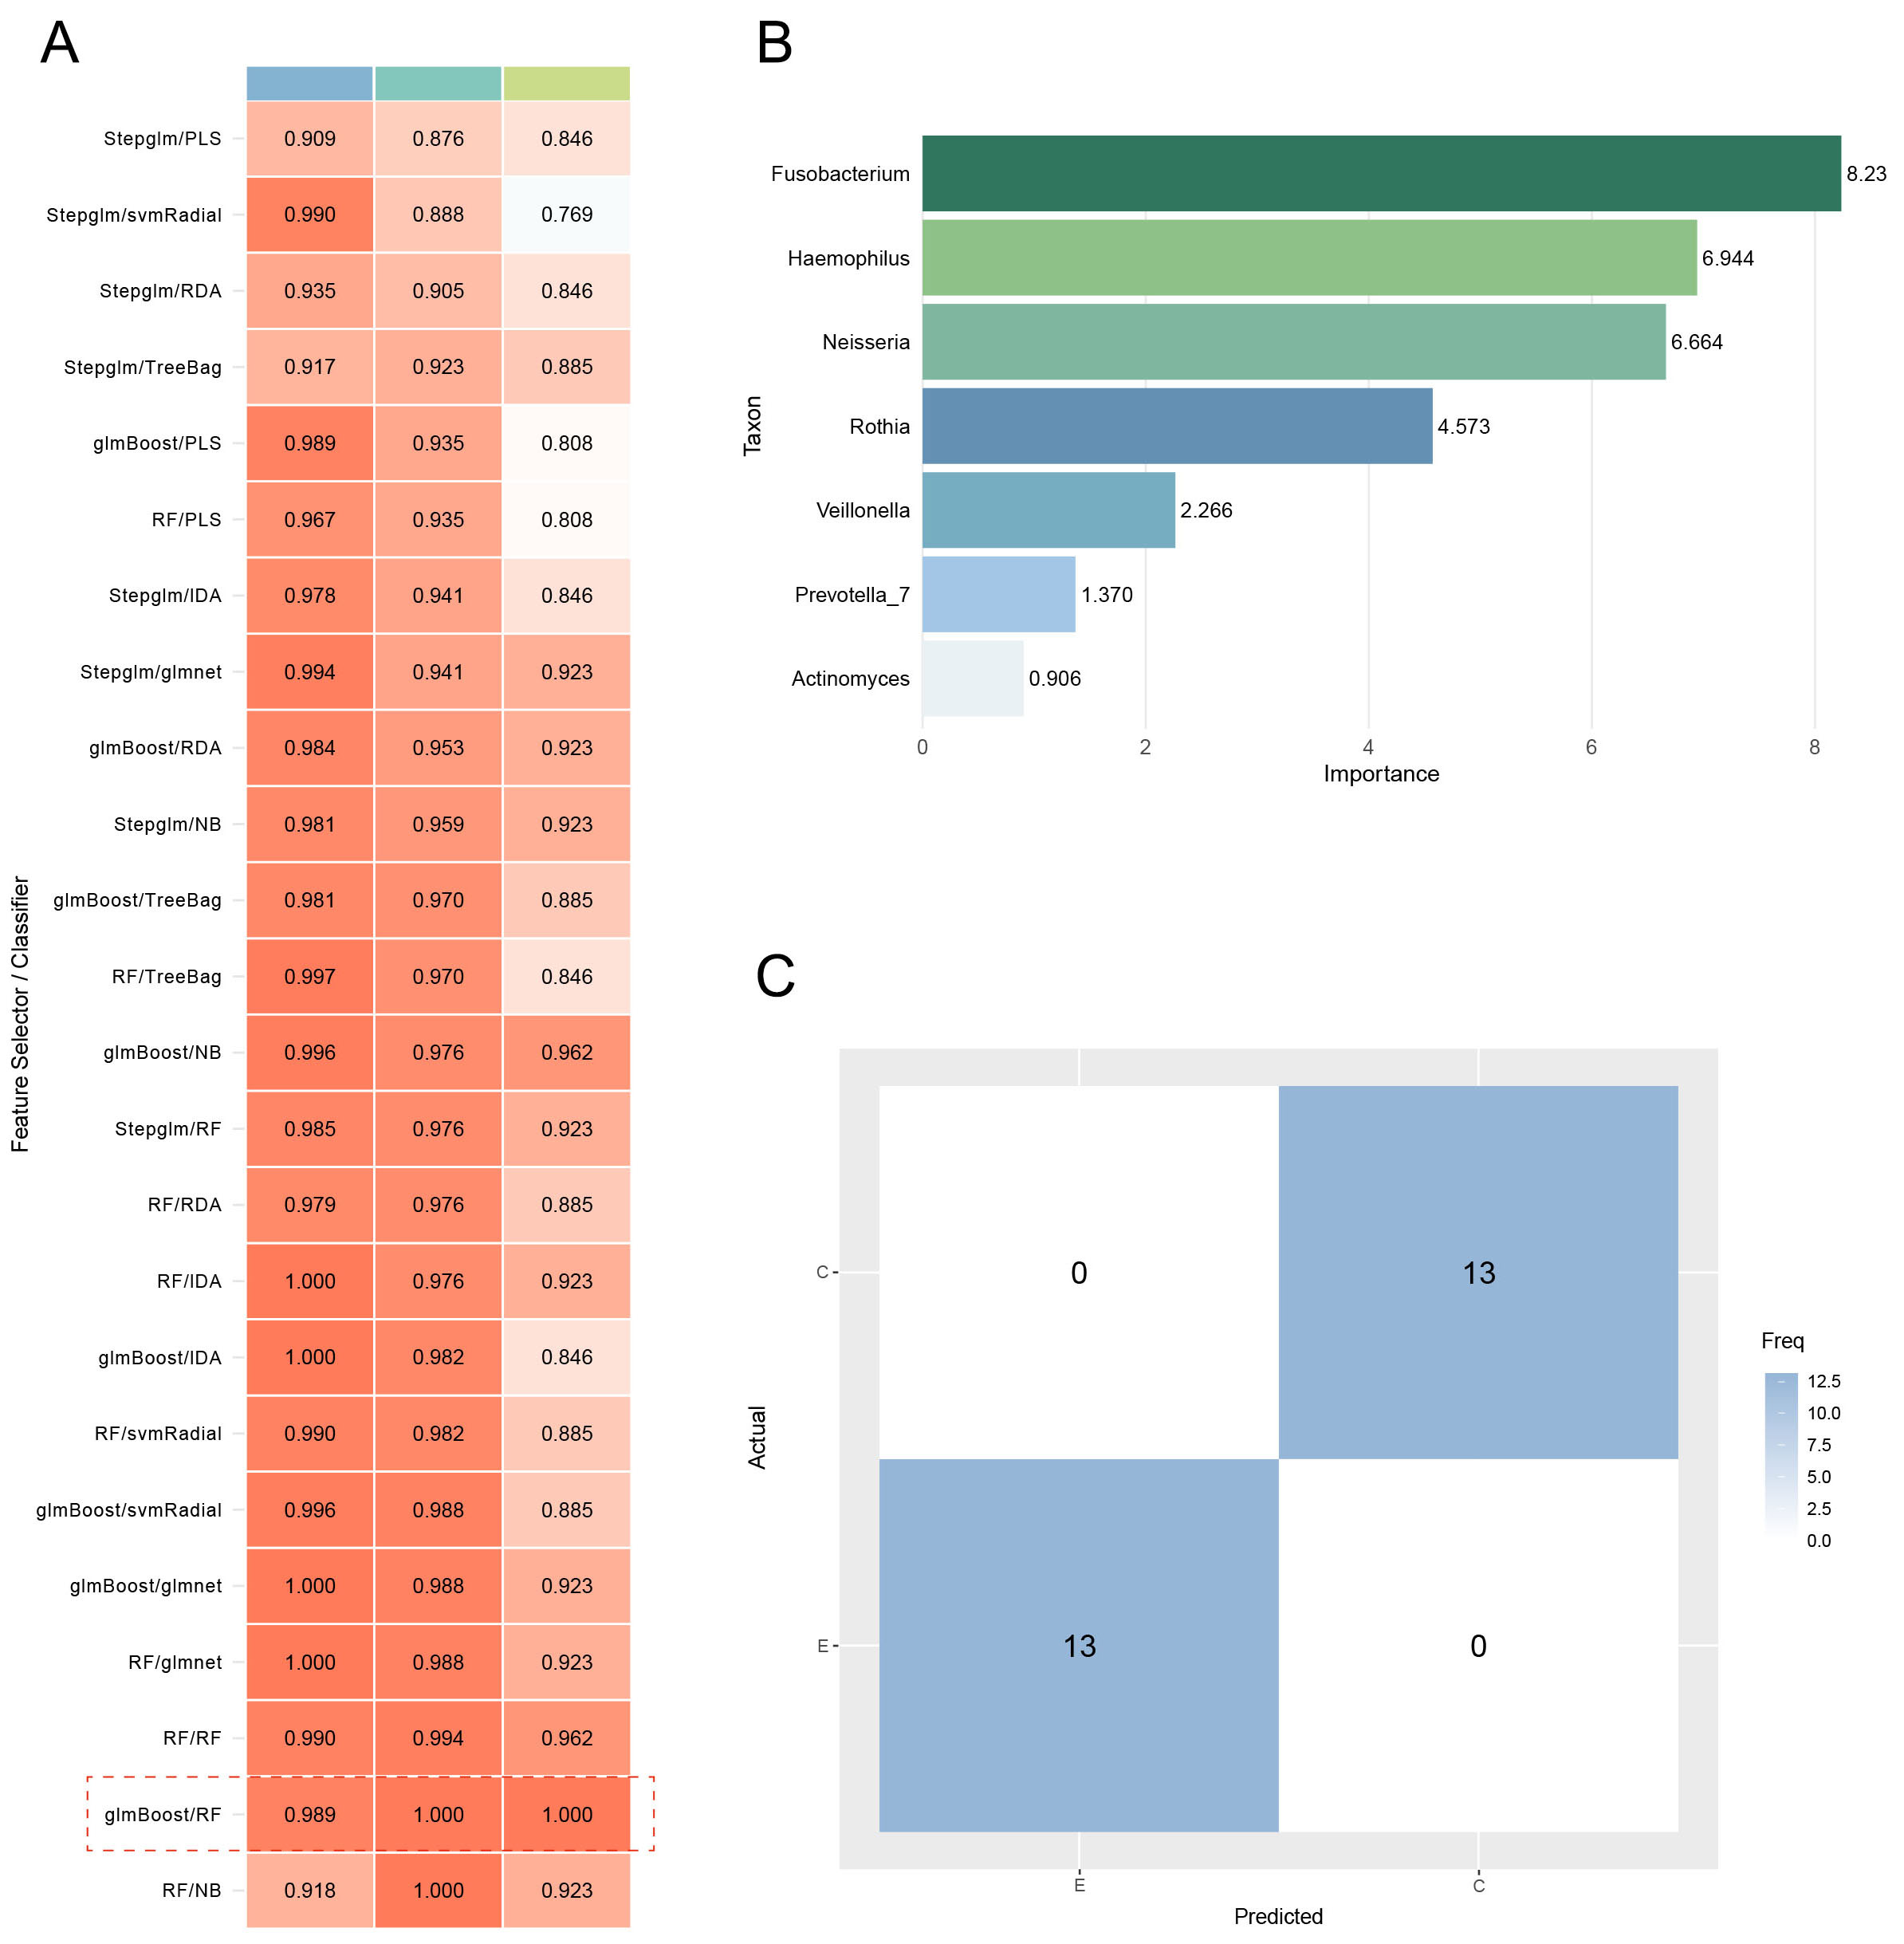
Figure 7. The evaluation of the predictive model. (A) The AUC values of multiple machine learning algorithms combined on two datasets. (B) Feature importance bar plot. (C) Confusion matrices for RF model. AUC: Area under the curve; RF: random forest; GLMBoost: generalized linear model boosting; LDA: linear discriminant analysis; NB: naive bayes; PLS: partial least squares; RDA: regularized discriminant analysis; CV: cross-validation; glmnet: generalized linear model with elastic net regularization; svmRadial: support vector machine with radial basis function kernel; NB: naive bayes; Stepglm: stepwise generalized linear model.


