


fig6
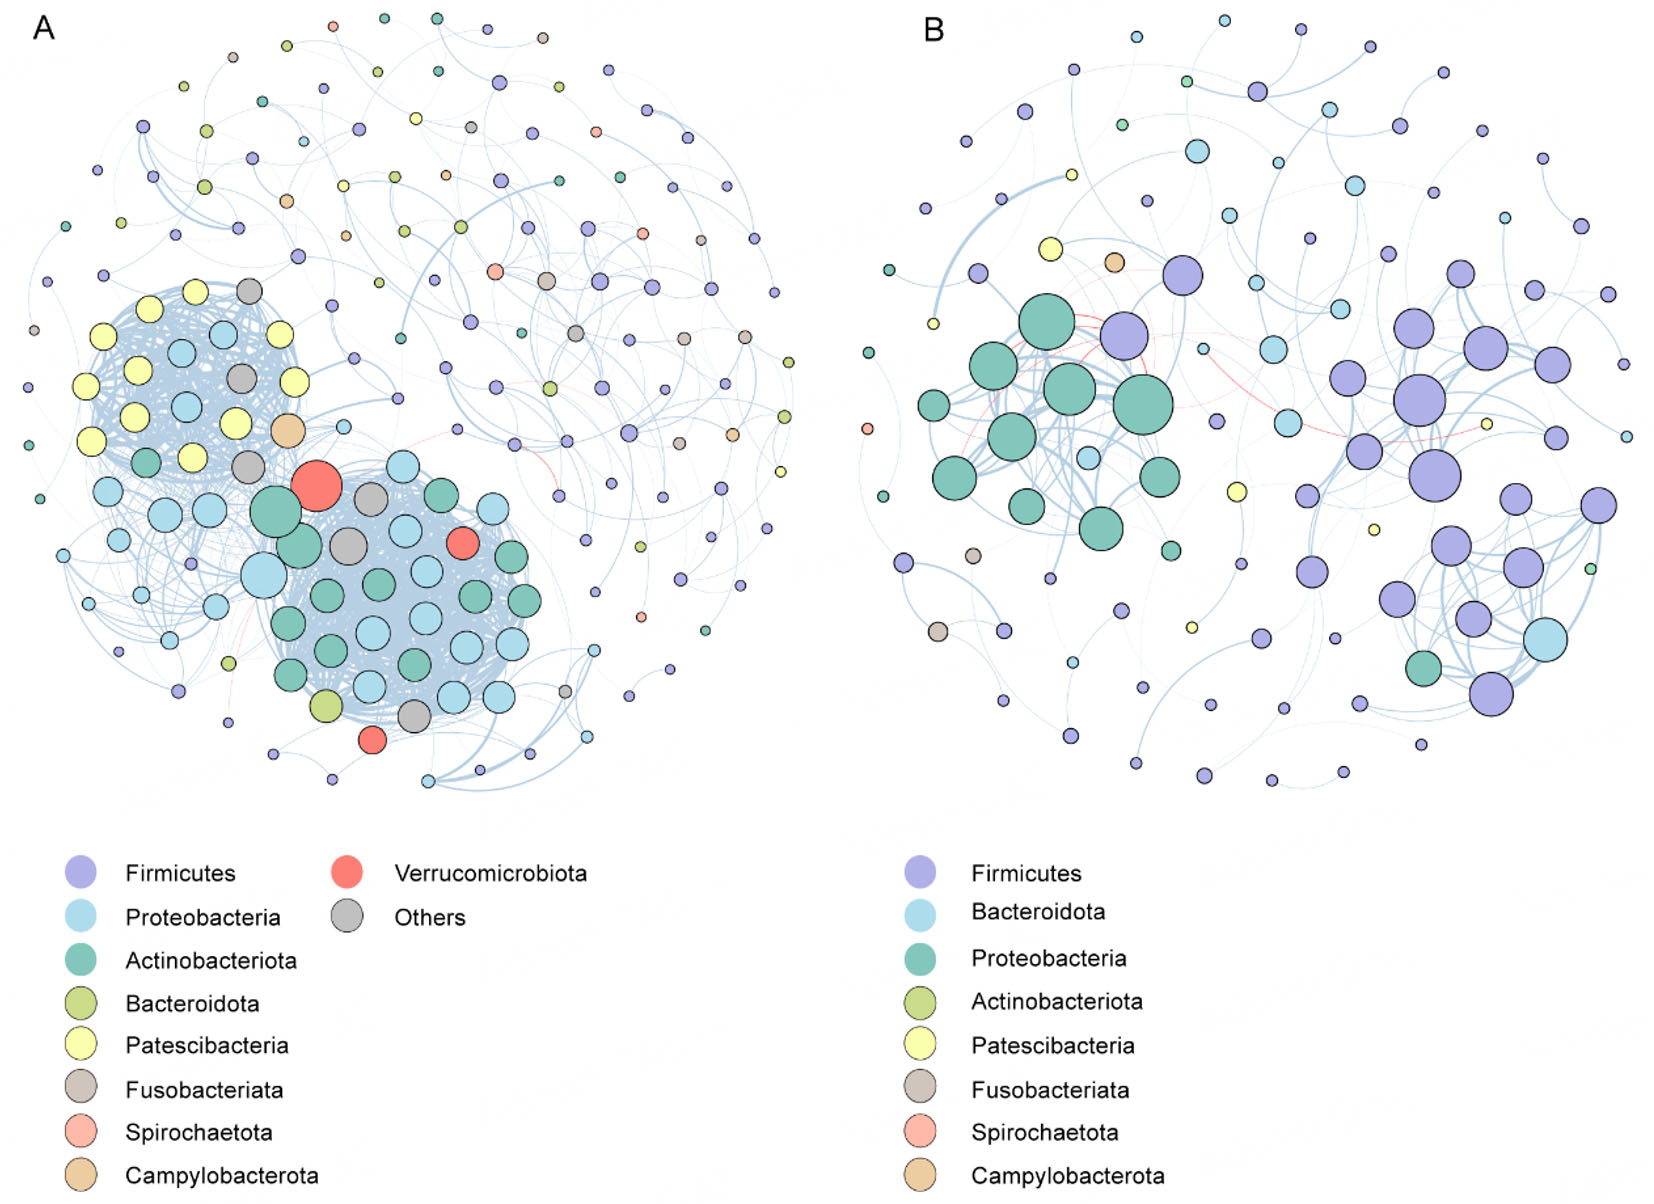
Figure 6. Co-occurrence networks in Con and ET groups. (A) Correlation-based network analysis in the Con group. (B) Correlation-based network analysis in the ET group. The node colors and sizes indicate degree. Edges represent positive (blue) or negative (red) co-occurrence relationships. Edge width is proportional to the absolute value of the correlation coefficient. All correlations shown are statistically significant (adjusted P < 0.05, |r| > 0.6).


