


fig4
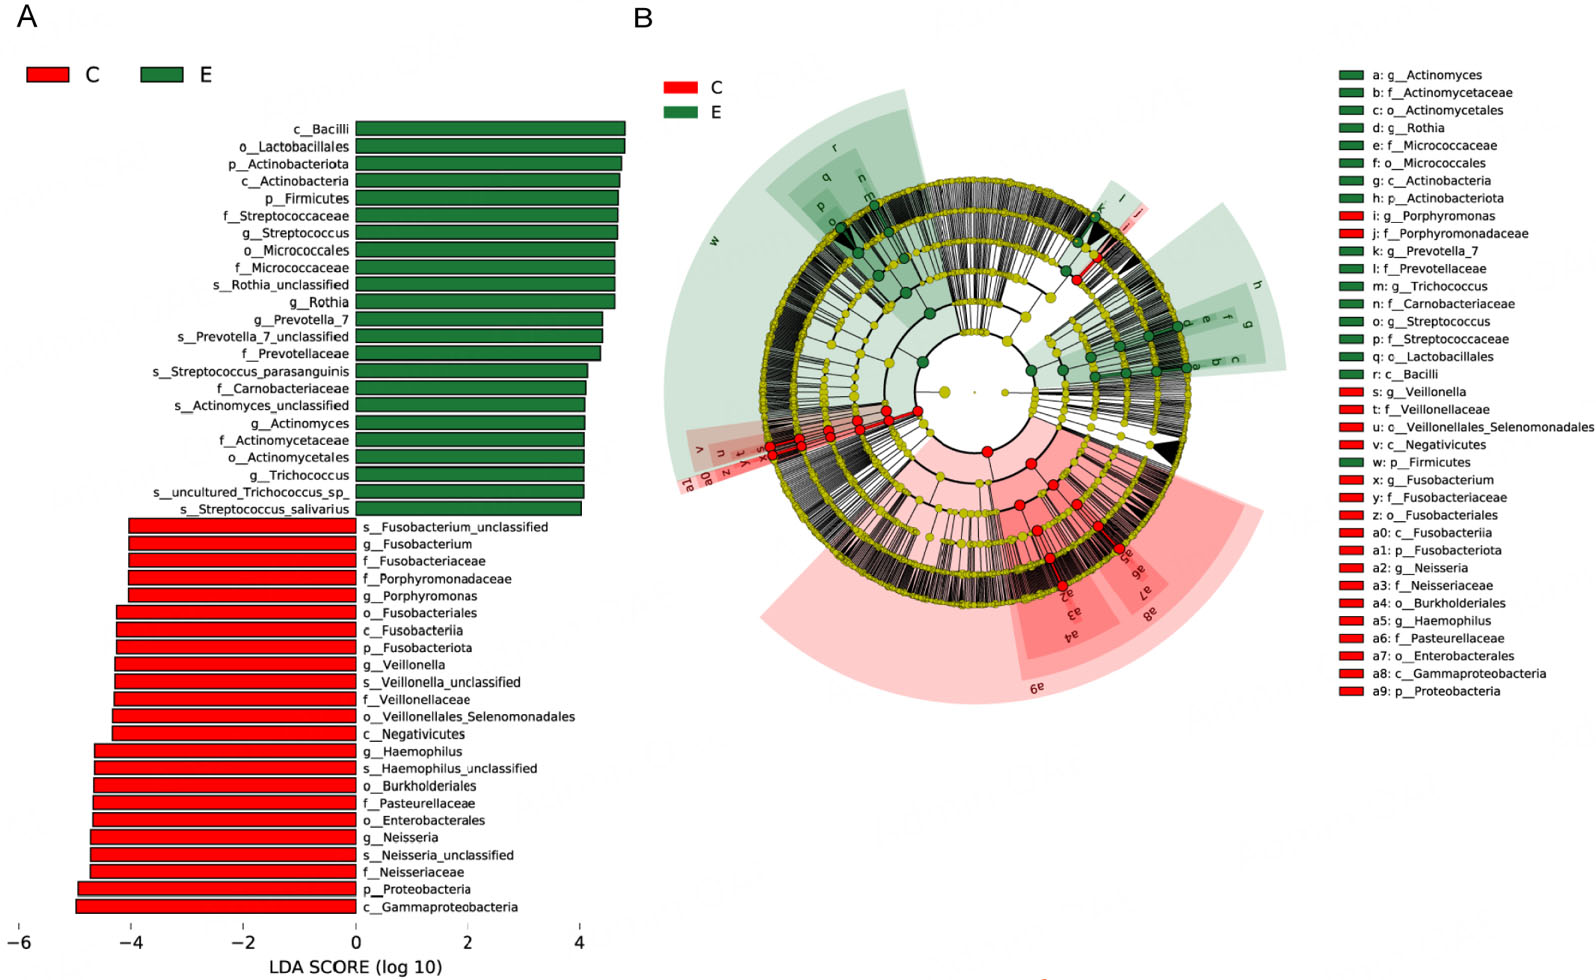
Figure 4. Taxa with significantly different abundance between the ET and Con groups. (A) LDA (LDA > 4.0, P < 0.05) for taxa distinguishing the groups. Positive and negative scores indicate enrichment in the ET and control groups, respectively. (B) Cladogram illustrating taxa with significant differences. Nodes in red and blue represent taxa enriched and depleted in the ET group, respectively. The concentric circles denote taxonomic levels from phylum to species, with node size corresponding to relative abundance. ET: Etomidate; LDA: linear discriminant analysis.


