


fig3
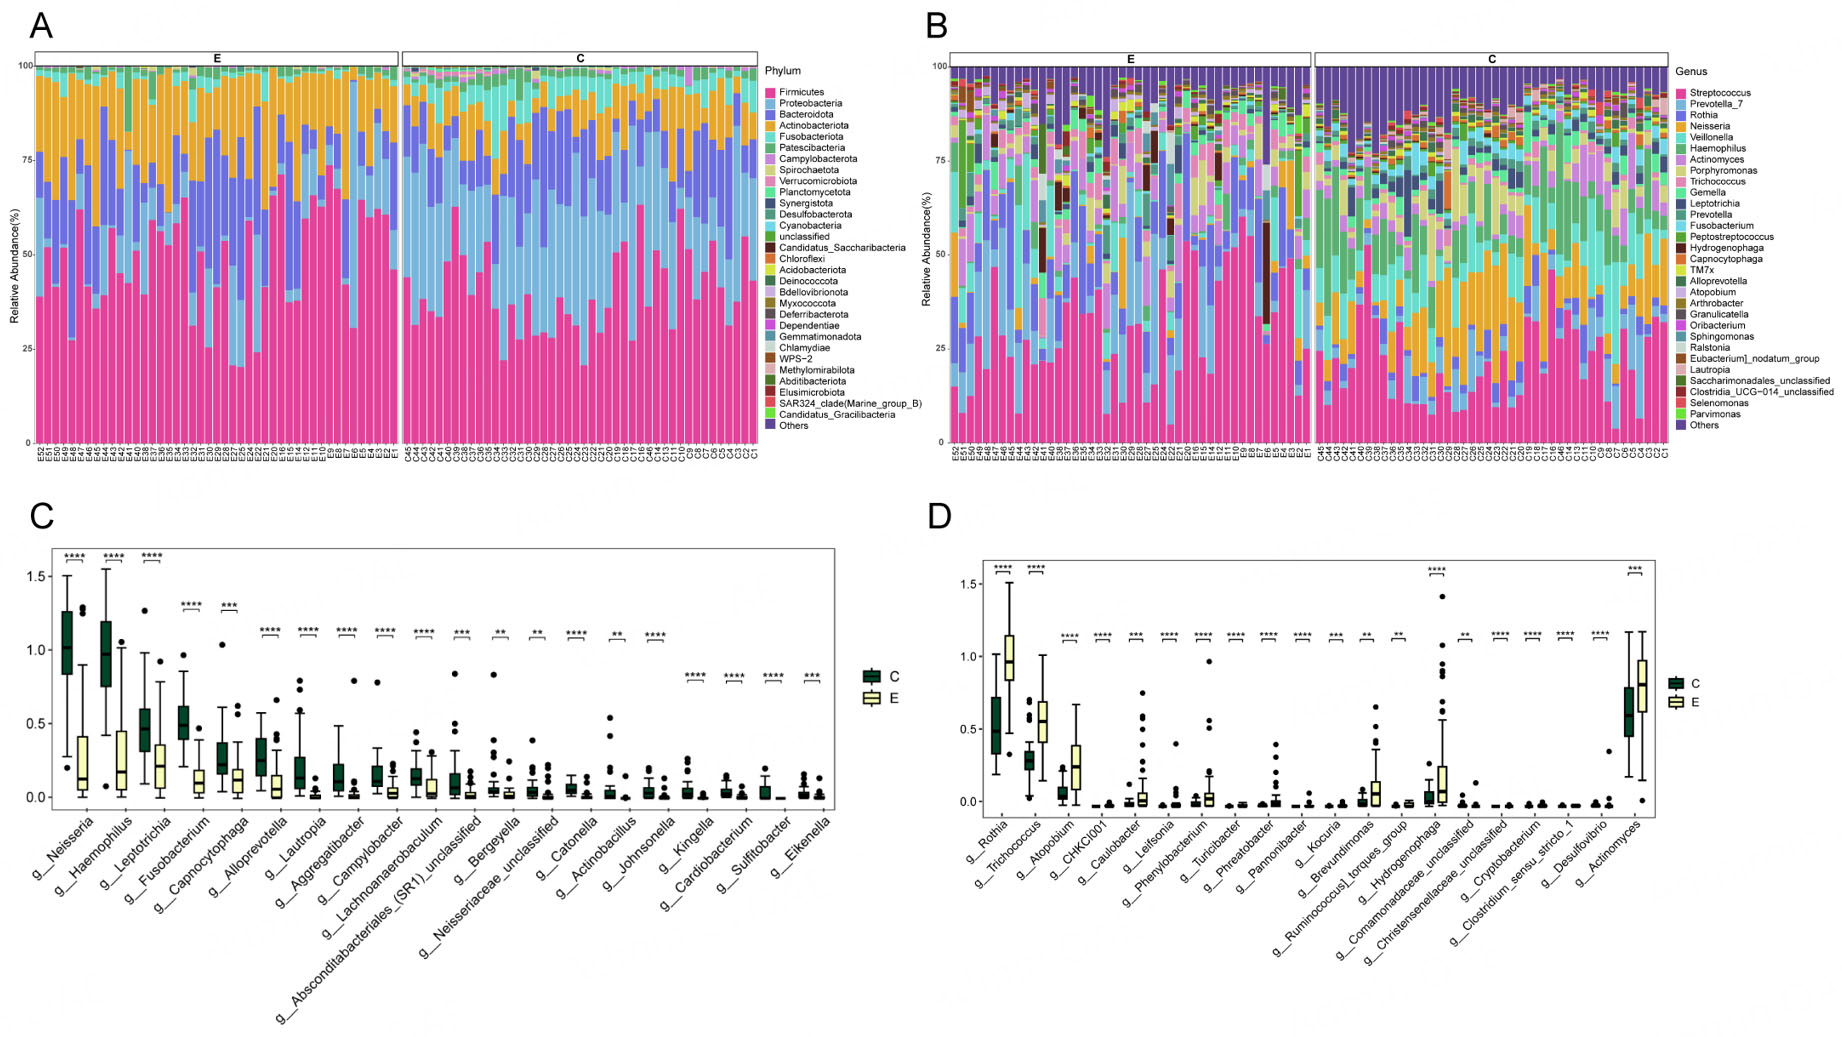
Figure 3. Compositional differences in the oral microbiota between Con and ET users. Microbial composition at the (A) phylum and (B) genus level (showing taxa with > 1% mean relative abundance). (C) Top 20 bacterial genera with significantly decreased relative abundance in the ET group. (D) Top 20 bacterial genera with significantly increased relative abundance in the ET group. Statistical analysis was performed using the Wilcoxon rank-sum test with Benjamini-Hochberg correction for multiple testing. Error bars represent the standard error of the mean (SEM). Asterisks indicate adjusted p-values: **P < 0.01, ***P < 0.001, ****P < 0.0001.


