


fig2
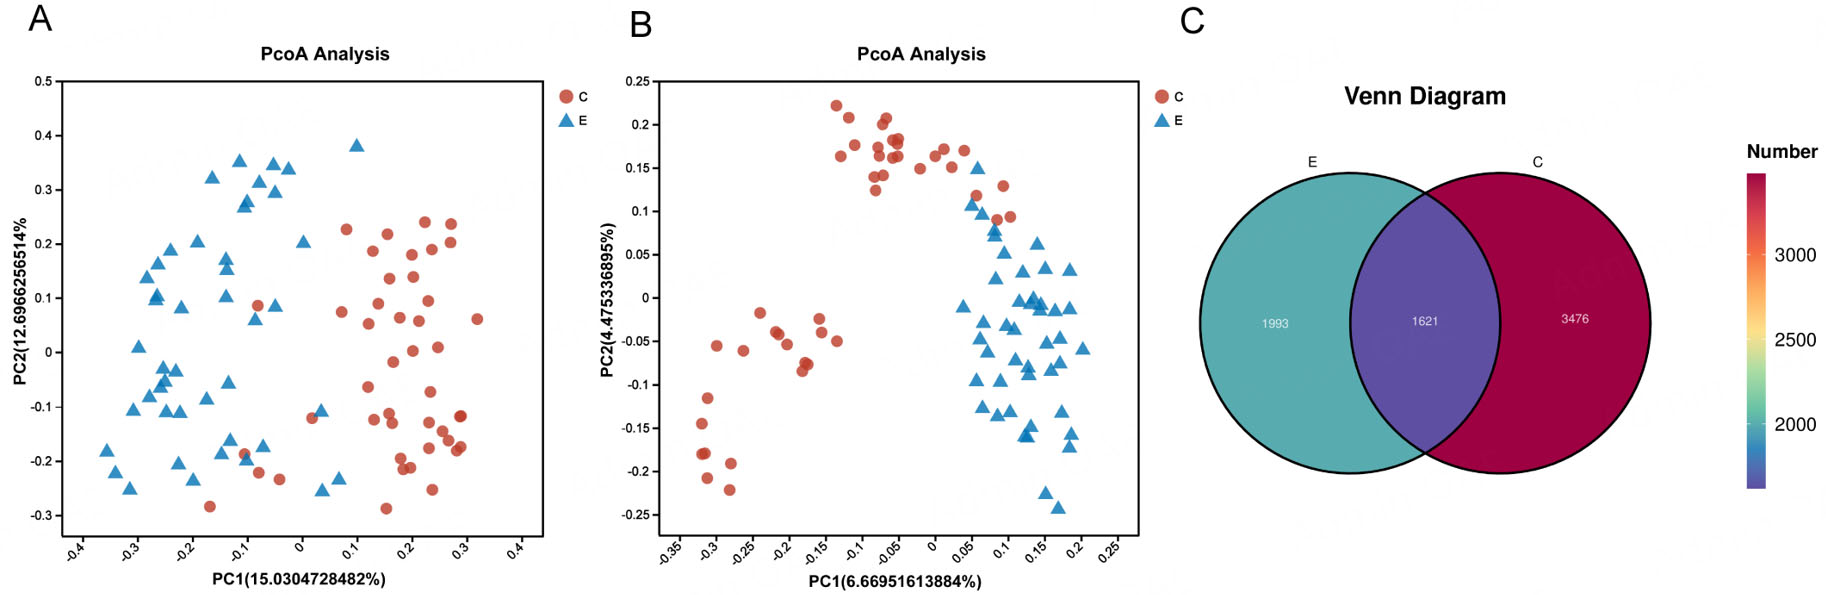
Figure 2. Oral microbiota composition is altered in group ET. (A) Principal coordinate analysis (PCoA) plot based on Bray-Curtis distance. (B) PCoA plot based on Jaccard distance. (C) Venn diagram of the observed bacterial ASVs in the two groups. Each point in (A) and (B) represents an individual sample. PERMANOVA (adonis) was used to test for significant differences in community structure between groups.


