


fig1
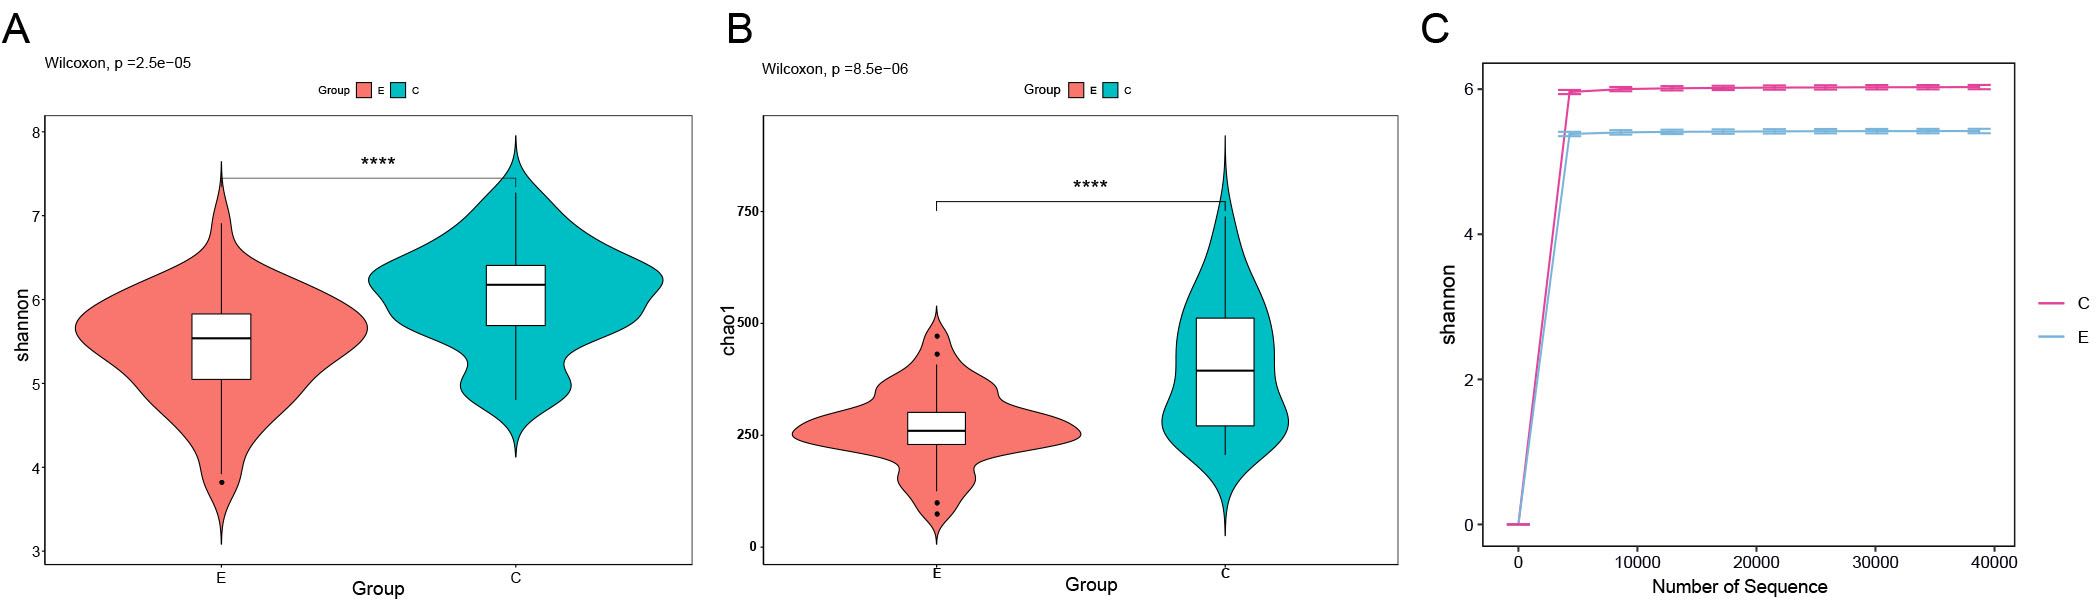
Figure 1. Alpha diversity analysis of oral microbial communities in Con group and ET group. (A) Shannon index of salivary microbiota in two groups. (B) Chao1 index of salivary microbiota in two groups. (C) Shannon rarefaction curve in two groups. Statistical significance between groups was determined using the Wilcoxon rank-sum test. Box plots display the median (center line), interquartile range (box bounds), and 1.5 × interquartile range (whiskers). Asterisks indicate significant differences between groups: ****P < 0.0001. Rarefaction curves reached a plateau, confirming sufficient sequencing depth.


