


fig5
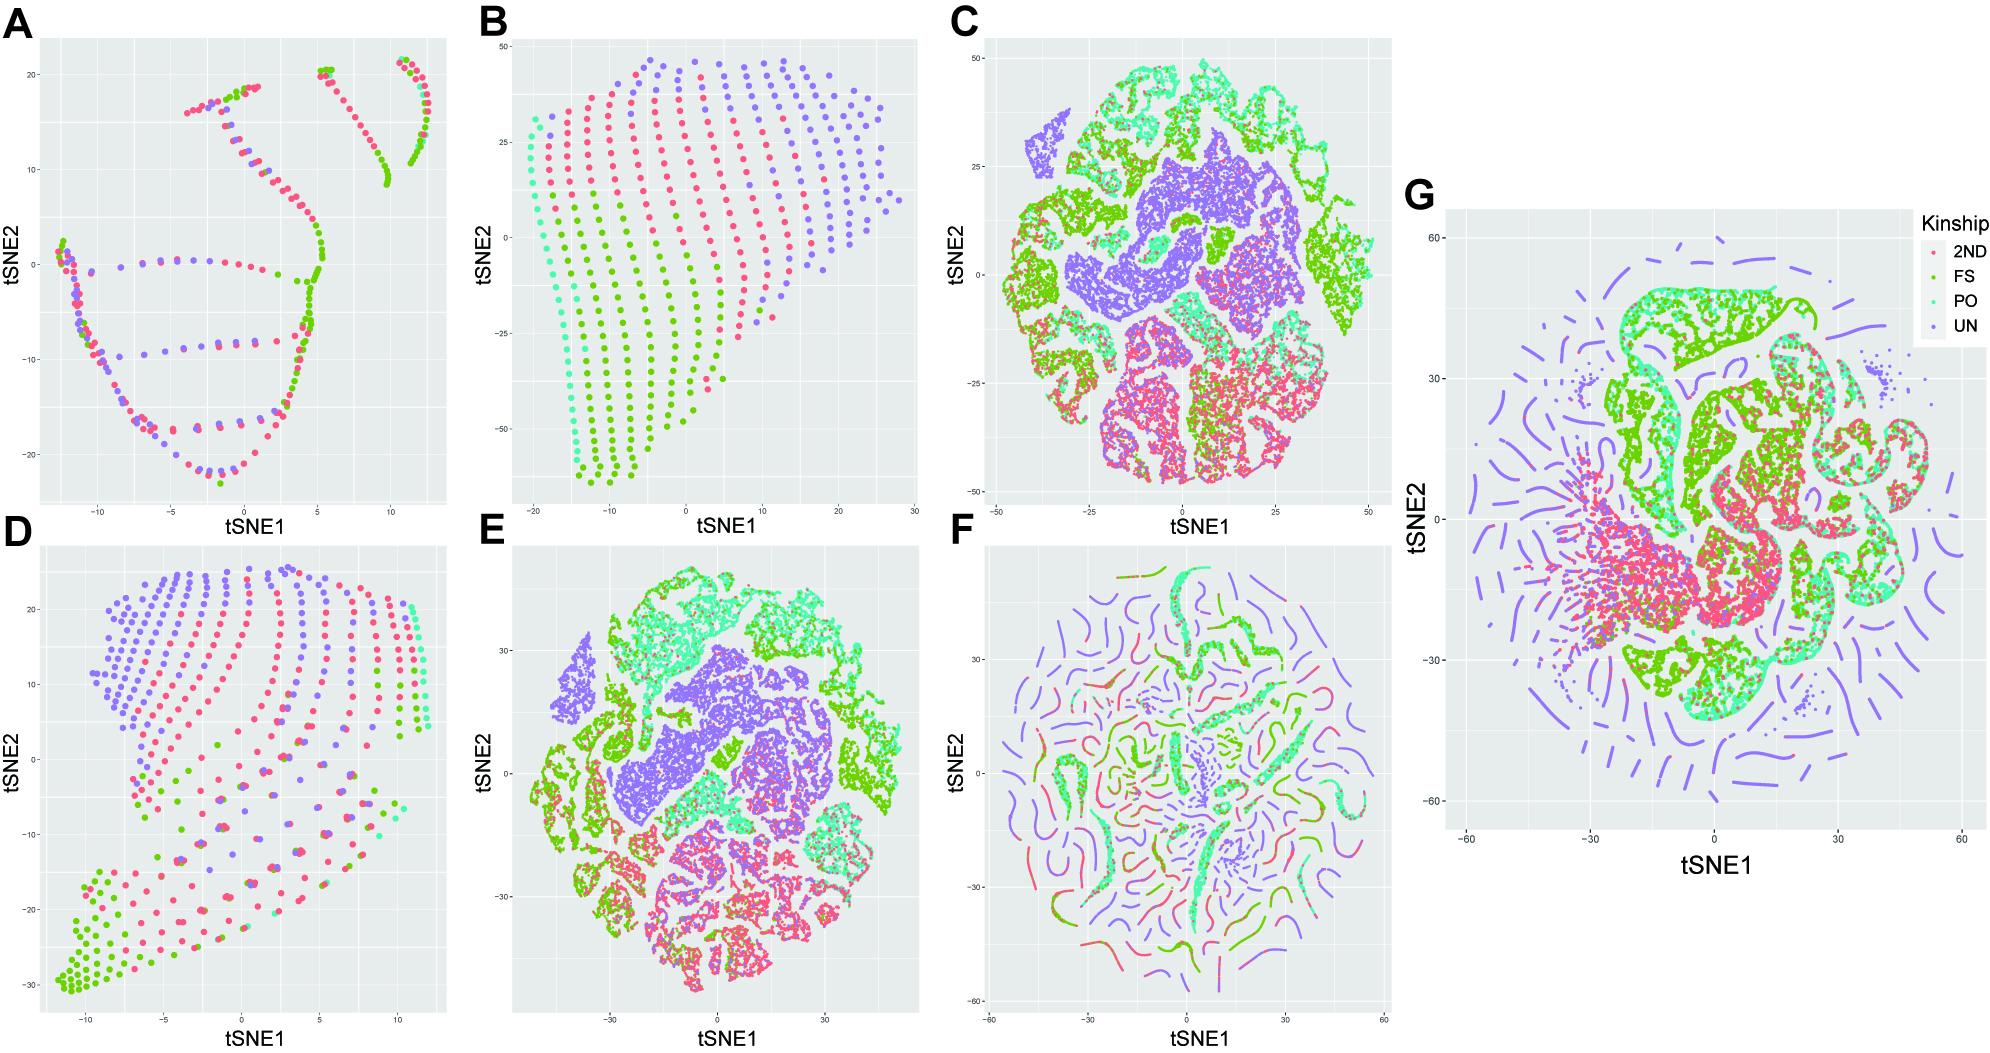
Figure 5. Visualizations of dimension reduction for different feature combinations based on the t-SNE algorithm. (A) and (B) are the t-SNE dimension reduction results for IBD parameters (k0, k1, k2, and IBD proportions) and IBS parameters (IBS0, IBS1, IBS2, and normalized cumulative IBS), respectively; (C) displays the results for log10(LR) values under different hypotheses; (D-G) show the results for feature combinations of IBD+IBS, IBD+log10(LR), IBS+log10(LR) and all mentioned features, respectively. Different colored dots represent different types of kinship pairs. IBD: Identity-by-descent; IBS: identity-by-state; FS: full siblings; PO: parent-offspring; 2ND: 2nd-degree relatives; UN: unrelated individuals; t-SNE: t-distributed stochastic neighbor embedding.


