


fig4
From: Kinship classification from a machine learning perspective: a pilot study based on genotyping data
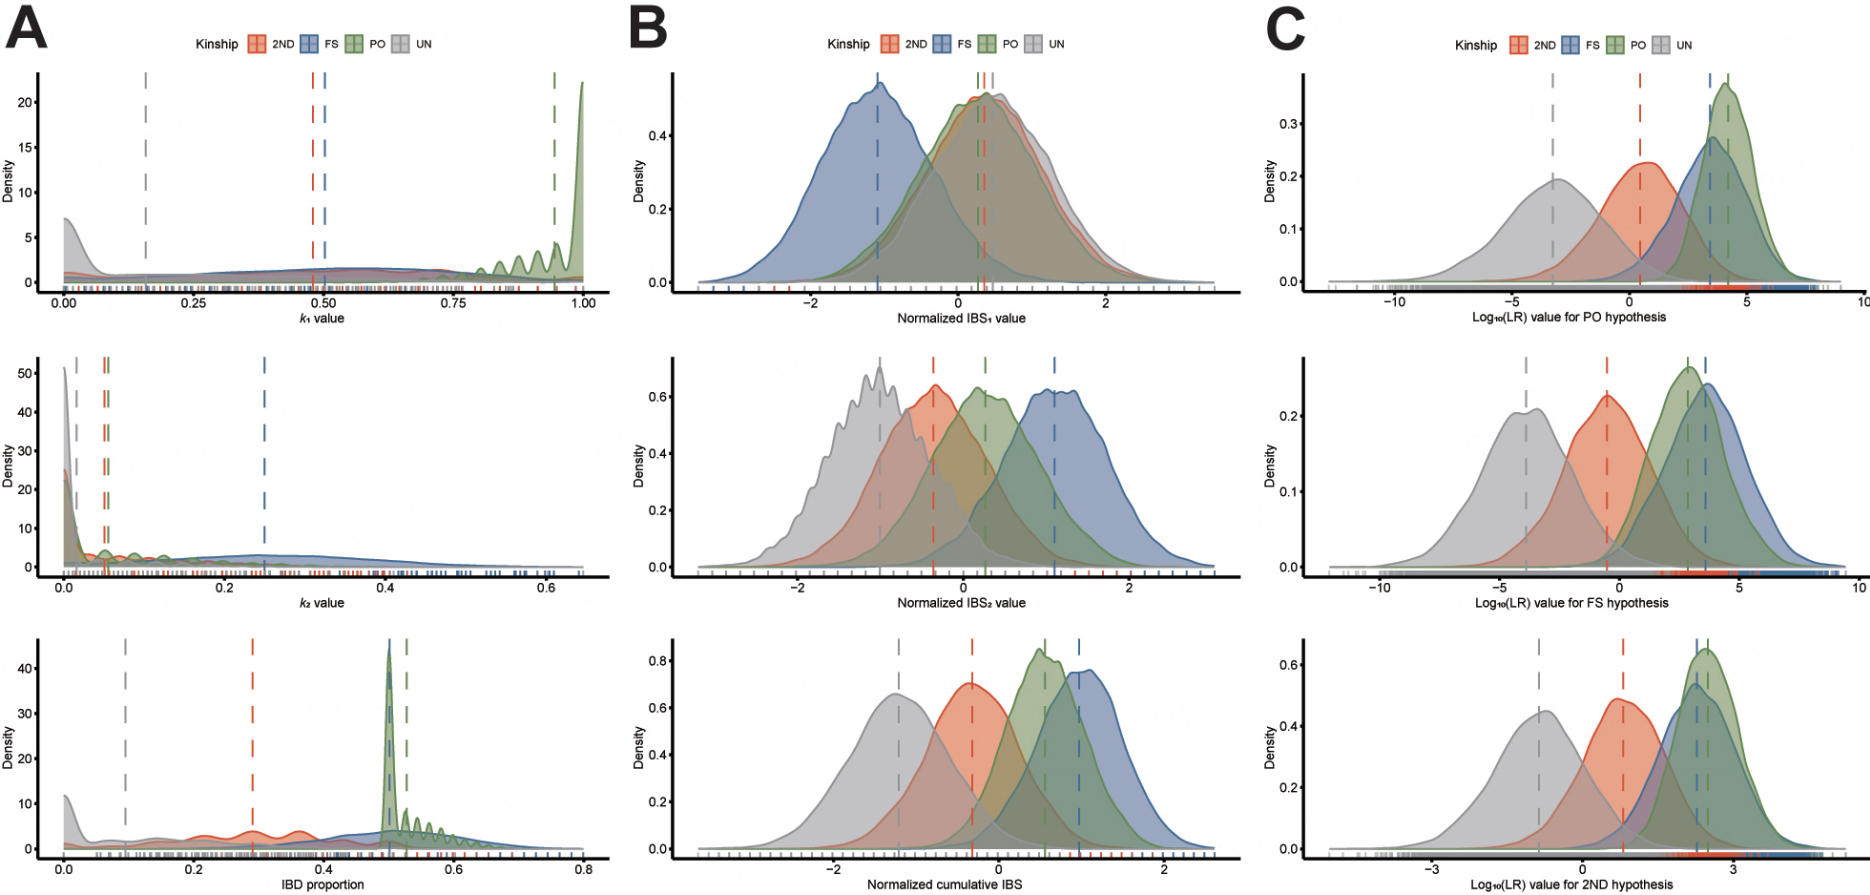
Figure 4. Density distribution maps of different kinship parameters. (A) presents the density distributions of IBD parameters (with bin width of 0.1), including k0, k1, k2, and proportion IBD; (B) demonstrates the density distributions of IBS parameters, including IBS0 (with bin width of 0.1), IBS1, IBS2, and normalized cumulative IBS; (C) displays the distributions of log10(LR) values under different hypotheses. The vertical dashed lines represent the median value of the correspondence relationships. IBD: Identity-by-descent; IBS: identity-by-state; FS: full siblings; PO: parent-offspring; 2ND: 2nd-degree relatives; UN: unrelated individuals.


