


fig3
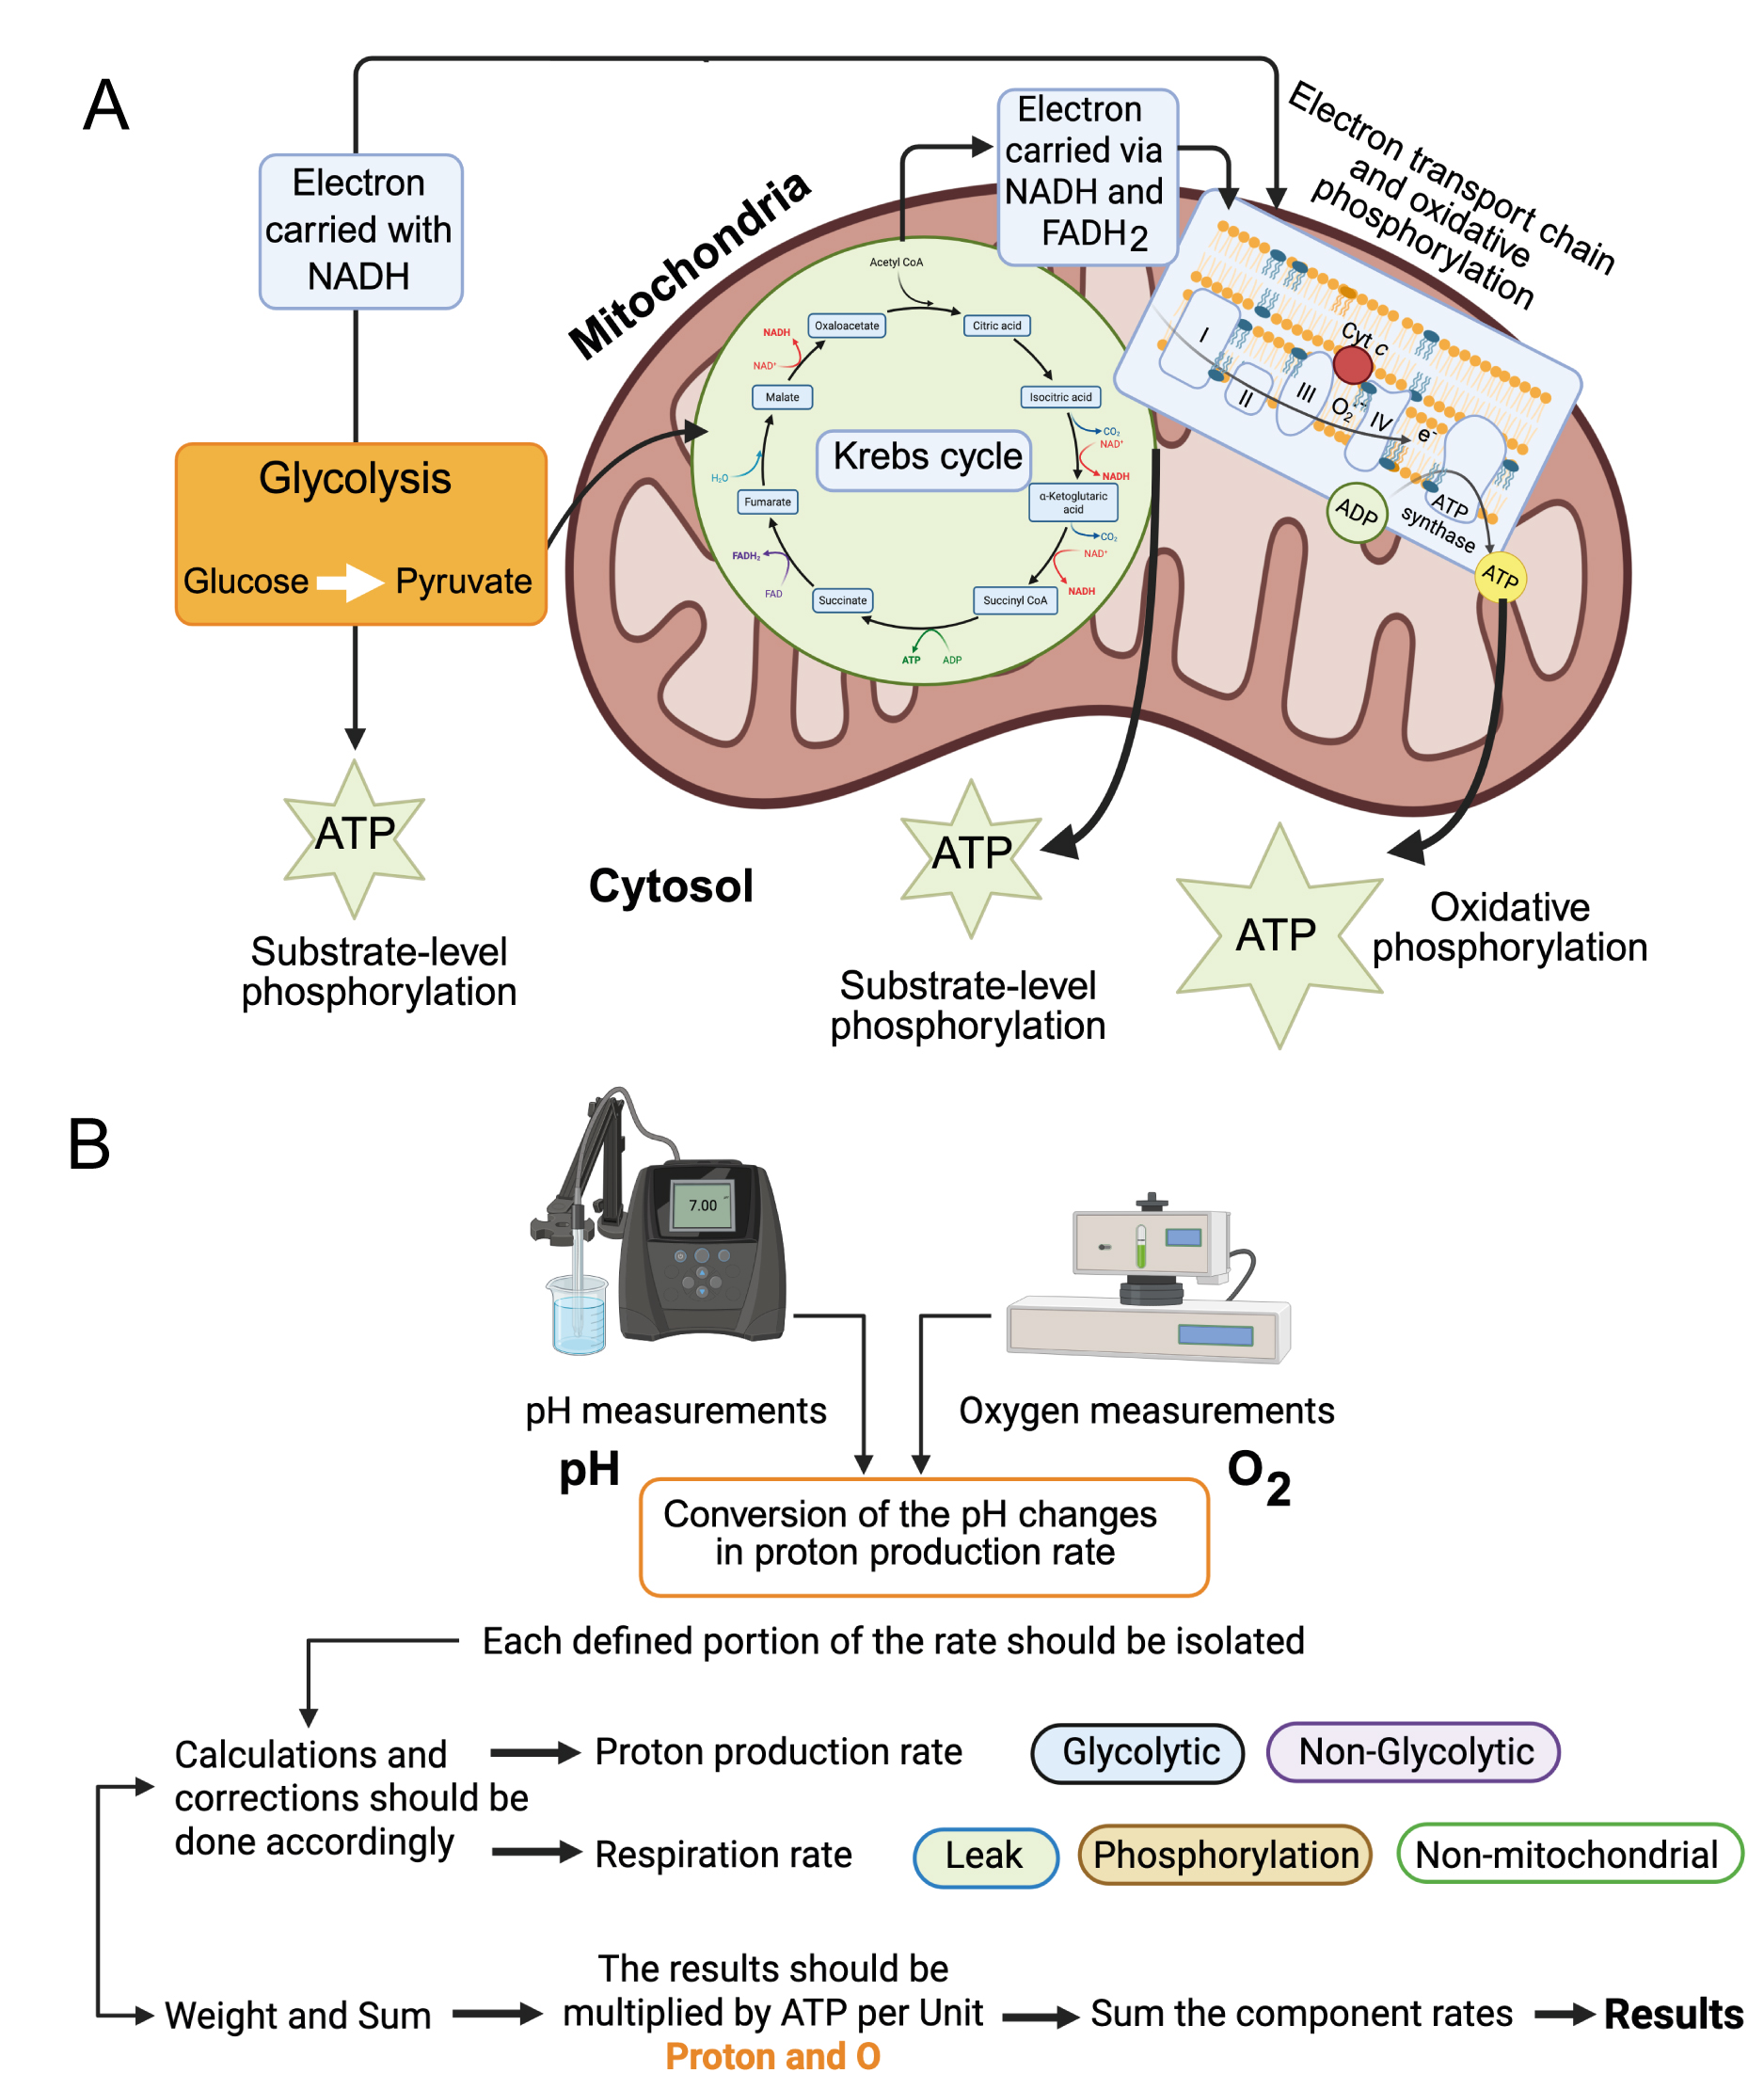
Figure 3. Extracellular Flux Measurements and ATP production. (A) Schematic representation of the pathways leading to ATP production. Created in BioRender.com; (B) Glucose is metabolized to lactic acid, CO2 and H2O. Glycolysis produces electrons (e-), glycolytic ATP (ATPglyc), and pyruvate. Pyruvate can be reduced to lactate + H+. The TCA cycle generates electrons, substrate-level oxidative ATP (part of ATPoxid.), and CO2. CO2 hydration produces HCO3- and H+. Electron transport enables oxidative phosphorylation, generating the remaining ATPoxid. and consuming O2 to produce H2O. Glyc: Glycolytic; Phosphor: phosphorylating; Mito: mitochondrial; Oxid: oxidized. Created in BioRender.com. ATP: adenosine triphosphate;


