


fig1
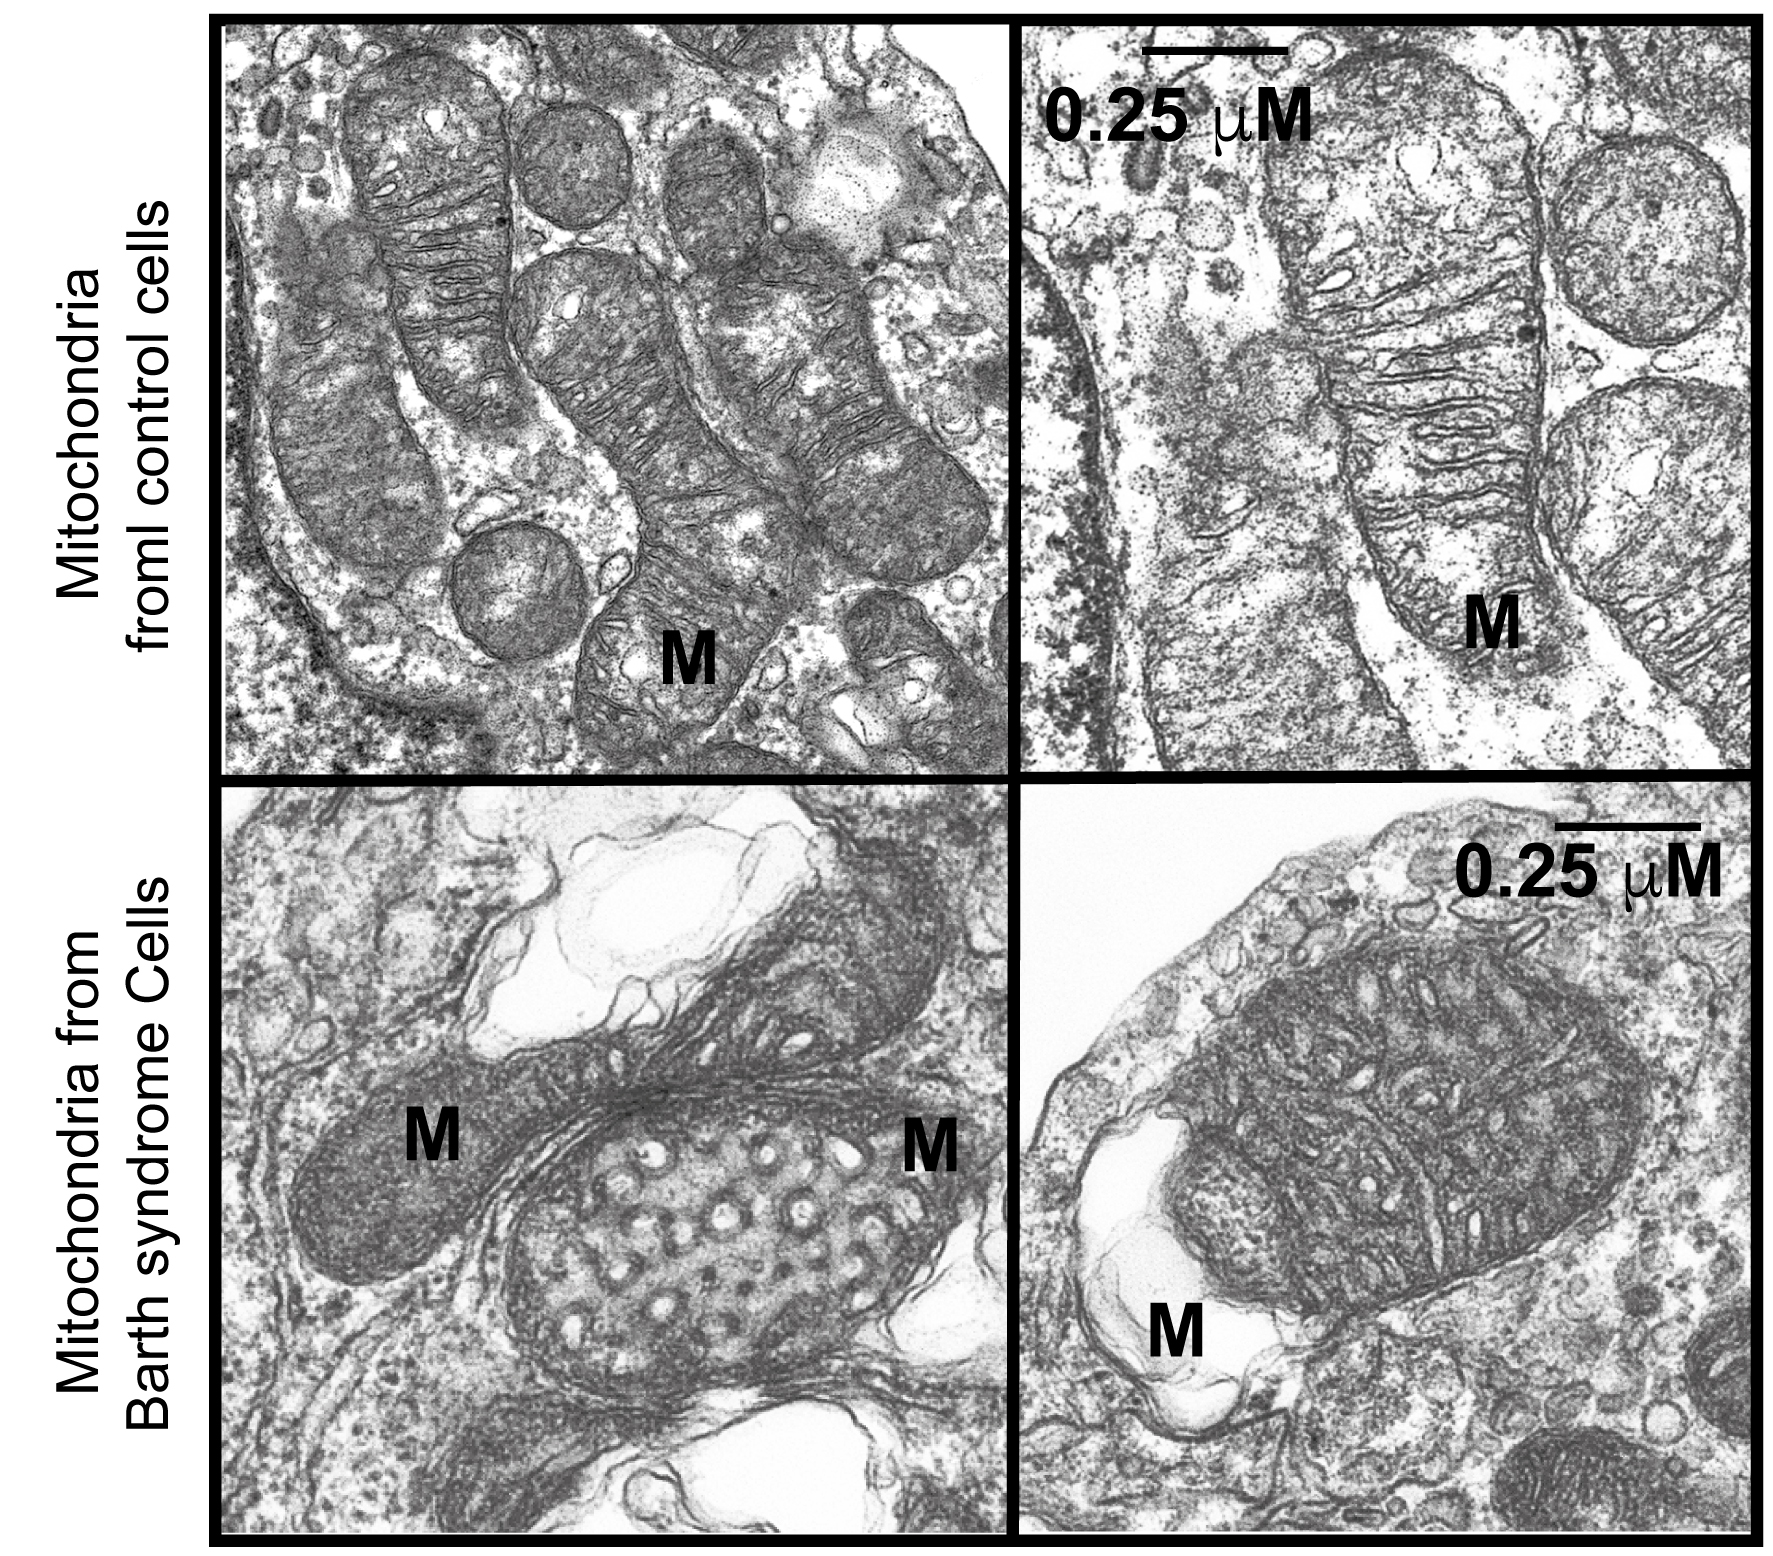
Figure 1. Electron microscopy of BTHS lymphoblastic mitochondria. M: mitochondria; scale bars for all four panels represent 0.25 μm. Reproduced from Ref.15[15] with permission from Biochimica et Biophysica Acta. BTHS: Barth syndrome.
Figure 1. Electron microscopy of BTHS lymphoblastic mitochondria. M: mitochondria; scale bars for all four panels represent 0.25 μm. Reproduced from Ref.15[15] with permission from Biochimica et Biophysica Acta. BTHS: Barth syndrome.


All published articles are preserved here permanently:
https://www.portico.org/publishers/oae/


