



Phase Lab: a cloud-native CALPHAD-to-data platform for accelerated alloy design and AI/ICME/MGE workflows
 0
0 Abstract
Artificial intelligence (AI)-assisted alloy design, integrated computational materials engineering (ICME), and materials genome engineering (MGE) increasingly require CALculation of PHAse Diagrams (CALPHAD) calculations to be executed at scale and stored as reusable, traceable data. However, conventional CALPHAD workflows are often desktop-centered and tool-specific, which limits reproducibility, high-throughput reuse, and direct integration with machine-learning pipelines. Here we present Phase Lab, a cloud-native CALPHAD-to-data platform designed for alloy designers, CALPHAD practitioners, and AI/ICME/MGE researchers who require scalable computation together with standardized data products. Rather than introducing new physical models, Phase Lab standardizes the full calculation workflow, including browser-based configuration, application programming interface-driven task orchestration, server-side computation, metadata capture, provenance tracking, and structured export. The platform supports thermodynamic, kinetic, thermophysical, solidification, and mechanical-property calculations, while storing database versions, model selections, input conditions, solver settings, and execution records. Point-to-point benchmark calculations showed agreement with Thermo-Calc for representative ternary systems, and batch tests achieved a 100% completion rate for 20,000 ternary tasks with an average runtime of 0.006933 s per task. For 9-component and 12-component systems, completion rates of 99.32% and 98.14% were obtained, respectively, with average runtimes of 1.122 and 2.19 s per task. Validation against literature and experimental data across Fe-, Ni-, Al-, and Cu-based systems further demonstrated the applicability of the platform. For Ni-based superalloys, the room-temperature yield-strength and ultimate-tensile-strength models achieved R2 values of 0.858 and 0.824, respectively. These results indicate that Phase Lab can serve as a practical data-generation platform for dataset assembly, surrogate modeling, active learning, and ICME/MGE-oriented alloy screening.
Keywords
INTRODUCTION
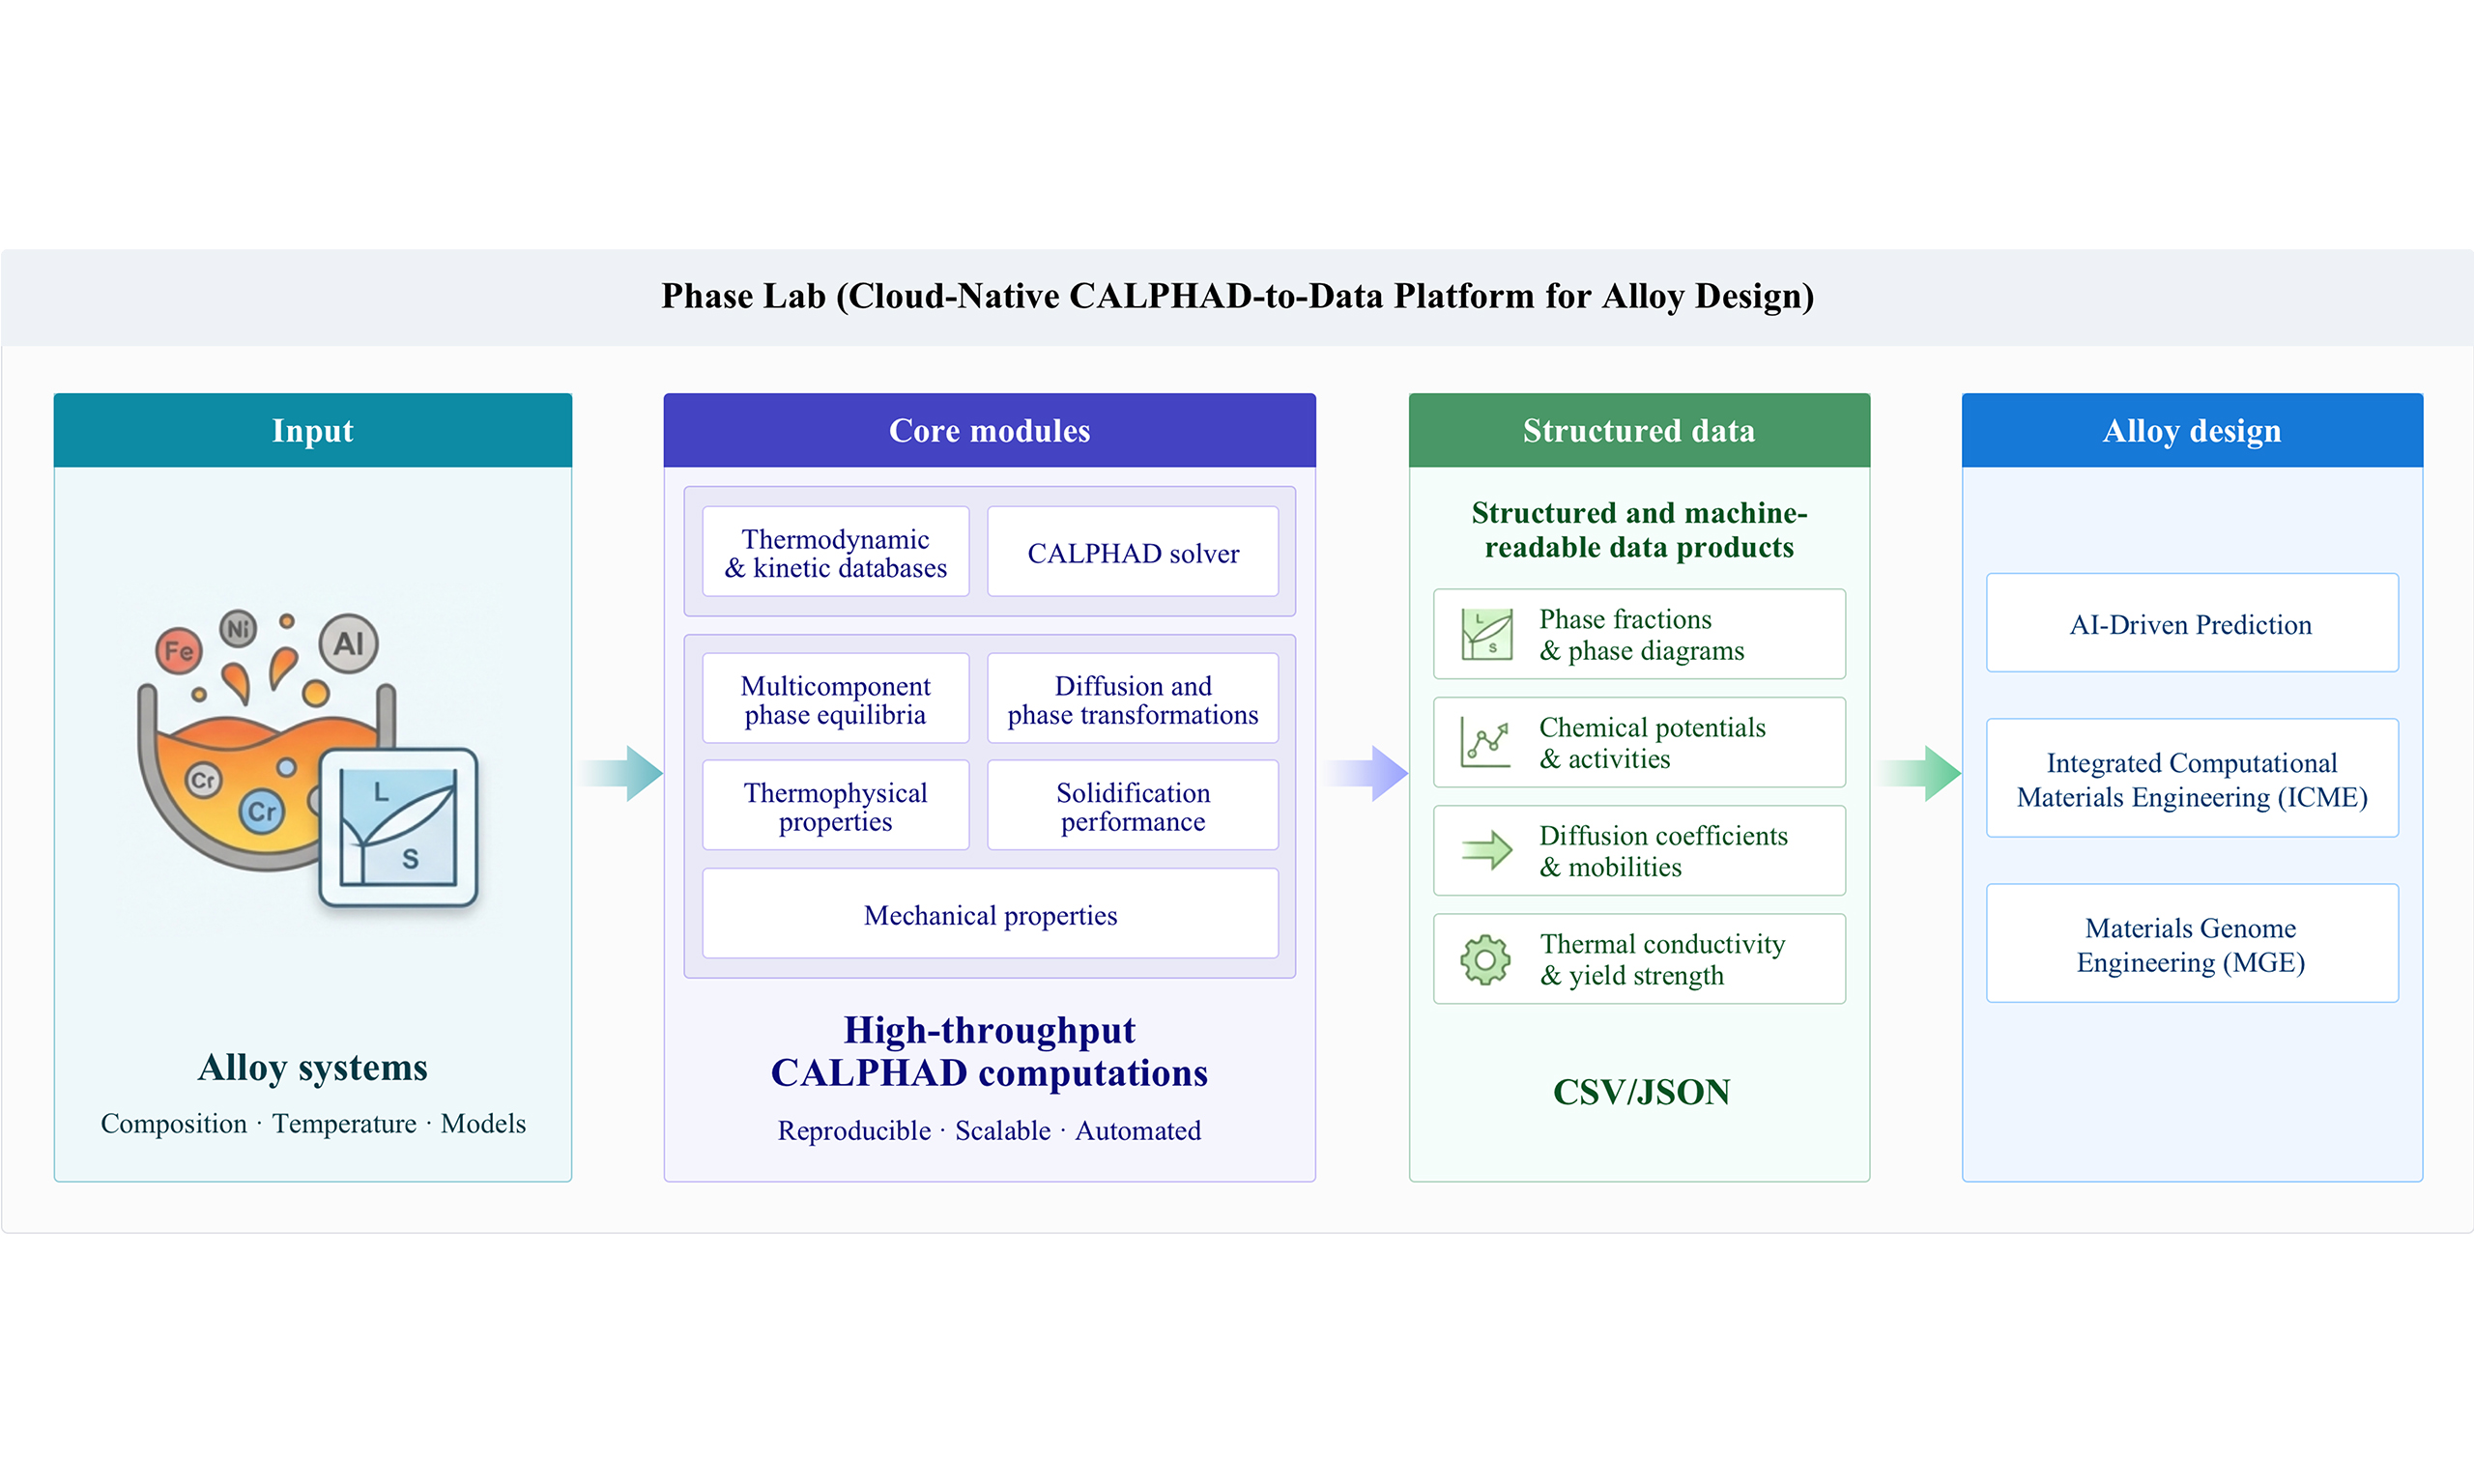
Thermodynamic and kinetic modeling based on CALculation of PHAse Diagrams (CALPHAD) provides a physically grounded foundation for alloy design, process optimization, and microstructure control. It has become a routine component of integrated computational materials engineering (ICME)[1-8] in both industrial practice and academic research. More broadly, CALPHAD-based methods and related computational tools have been widely used in materials modeling studies for phase equilibria, solidification, diffusion, precipitation, thermophysical-property prediction, and composition/process screening across diverse alloy systems[2,9-14]. At the same time, emerging materials genome engineering (MGE) and artificial intelligence (AI)-driven strategies increasingly depend on large, consistent, and well-described datasets that can be aggregated, queried, and reused across alloy systems and projects[1,15-18]. A persistent bottleneck is that conventional CALPHAD packages such as Thermo-Calc[19], PANDAT[20], and JMatPro[21] are still often executed as isolated, desktop-centered tasks: computations are not easily scaled to high-throughput screening, and the resulting outputs are frequently stored as ad hoc logs or figures with incomplete provenance, limiting reproducibility and direct reuse in AI/ICME/MGE pipelines. At a more fundamental level, CALPHAD results are still commonly generated in a tool-specific and case-by-case manner, making them difficult to reproduce, compare, aggregate, and directly reuse as structured data in ICME and AI-assisted alloy design workflows. To address these limitations, we developed Phase Lab as a cloud-native CALPHAD-to-data platform. The aim is not to replace established thermodynamic or kinetic formalisms, but to standardize how CALPHAD calculations are configured, executed, recorded, and exported. Phase Lab combines browser-based interaction, application programming interface (API)-driven task orchestration, server-side high-performance computing (HPC) computation, metadata capture, provenance tracking, and structured data export within a single workflow. As summarized in Figure 1, the platform shifts CALPHAD practice from fragmented, tool-specific calculations toward reusable data products that can be directly connected to AI, machine learning (ML), ICME, MGE, and optimization workflows.

Figure 1. Phase Lab workflow from CALPHAD computation to reusable data products. Phase Lab converts conventional CALPHAD calculations into structured data products through browser-based configuration, API-driven orchestration, server-side CALPHAD/HPC execution, metadata management, provenance tracking, and database/model versioning. The resulting CSV, JSON, API/schema, and metadata-linked database records can be reused in AI/ML, ICME, MGE, and optimization workflows. CALPHAD: CALculation of PHAse Diagrams; API: application programming interface; HPC: high-performance computing; CSV: comma-separated values; JSON: JavaScript Object Notation; AI: artificial intelligence; ML: machine learning; ICME: integrated computational materials engineering; MGE: materials genome engineering.
MATERIALS AND METHODS
Physical models
Phase Lab is built on established CALPHAD methodology and provides a thermodynamically consistent framework for multicomponent alloy calculations. Its main contribution is not the introduction of new physical models, but the integration of thermodynamic, kinetic, thermophysical, solidification, and mechanical-property calculations within a reproducible computational workflow. Thermodynamic modules determine phase stability, phase fractions, phase compositions, and thermodynamic driving forces. Kinetic modules describe time-dependent composition and microstructural evolution under prescribed thermal or processing histories. Property modules use the resulting thermodynamic and microstructural descriptors to estimate thermophysical and mechanical properties. This shared-state design helps maintain consistency across composition–process–microstructure–property calculations. To support technologically relevant alloys (Ni-, Fe-, Al-, Cu-, Ti-, and Mg-based systems), the platform integrates validated model families widely adopted in the CALPHAD community.
In Phase Lab, thermodynamic parameters are specified for each phase according to the corresponding phase model and are obtained from the underlying thermodynamic database. Depending on the structural characteristics and compositional degrees of freedom of the phase, the corresponding description may range from stoichiometric models to multicomponent sublattice formulations. In practical CALPHAD assessments, many phase descriptions are represented within variants of the Compound Energy Formalism (CEF)[22], which provides a general framework for describing gas phases, substitutional solutions, intermetallic compounds, ordered phases, and liquids exhibiting short-range order. The general equation for describing the Gibbs energy function per mole formula unit of a phase GMa is
where srfGMa denotes the “surface” of reference for the phase relative to other phases and internal ordering; cfgGMa is the configurational term which assumes ideal mixing of the constituents in each sublattice, phyGMa is used to describe contributions to the Gibbs energy from particular physical phenomena like magnetic transitions, and EGMa is needed to describe deviations in the Gibbs energy relative to the first three terms. Additional magnetic and ordering contributions are incorporated where required by the adopted phase model[23-26].
Based on Fick’s law, diffusion kinetics simulations predict time-dependent composition profiles within a diffusion couple[19,27]. The composition- and temperature-dependent diffusion coefficients are calculated using the atomic mobility parameters and thermodynamic factors. Precipitation kinetics is modeled using the Kampmann-Wagner Numerical (KWN) method, describing nucleation, growth, and coarsening behaviors over time and/or temperature variations[28]. Non-equilibrium solidification paths are modeled using the classical Scheil-Gulliver model and improved partial equilibrium approximations that consider rapid diffusion behavior of interstitial atoms[29,30]. Based on the resulting solidification paths, several hot cracking susceptibility criteria were evaluated within a unified framework. These criteria are derived from the temperature–solid fraction (T-fs) relationship during solidification and include the solidification interval (SI), the Clyne-Davies cracking susceptibility coefficient (CSC), the critical temperature interval (CTI), and Kou’s solidification cracking index (SCI), all of which are evaluated in a consistent framework[2,12,31]. They are described in detail as follows:
where TL is the liquidus temperature and T(fs) denotes the temperature corresponding to a given solid fraction fs. The terminal solidification temperature in the SI definition was approximated by T(fs=0.95) to avoid overestimation of the freezing range in the high-fs regime of Scheil calculations. Under an approximately constant cooling rate, the time ratio in the CSC criterion can be equivalently expressed in terms of the corresponding temperature intervals. In this work, SCI was evaluated either as an average slope over a specified terminal solid-fraction interval or as a local slope near a selected solid fraction, depending on the specific comparison and reporting format. In general, larger values of SI, CSC, and SCI indicate higher hot cracking susceptibility.
Beyond computational phase equilibrium and kinetic simulations, Phase Lab provides thermophysical and mechanical property modules. Thermophysical properties, such as molar volume[32,33], density, viscosity[34,35], and thermal/electrical conductivity[36-38], are computed using CALPHAD-consistent formulations. In these models, the relevant properties are expressed as temperature- and composition-dependent functions of phase constitution and phase composition, with model parameters taken from the underlying property databases. The conductivity models are currently intended for metallic alloy systems and corresponding phases covered by the implemented parameter sets; their applicability therefore depends on the availability and assessed quality of the relevant thermodynamic/property descriptions for the target alloy system. Accordingly, the predicted thermal and electrical conductivities represent intrinsic phase-level behavior under the assumed composition-temperature conditions, and do not explicitly account for microstructural features such as porosity, texture, or defect scattering introduced by specific processing routes.
Mechanical properties are evaluated using physically based strengthening models[39-42]. The yield strength (YS) is expressed as
where σ0 is the base strength, and Δσss, ΔσHP, Δσppt denote the contributions from solid-solution strengthening, grain-boundary strengthening, and precipitation strengthening, respectively. In the current implementation, precipitation strengthening is described through microstructural descriptors such as precipitate fraction and characteristic size, rather than explicit treatment of full precipitate morphology evolution. The present mechanical-property module is primarily intended for strength estimation under prescribed microstructural states; it does not explicitly resolve detailed dislocation evolution during deformation, and predictions of ultimate tensile strength (UTS) are therefore based on calibrated structure-property relationships within the supported alloy classes.
At the present stage, Phase Lab is a CALPHAD-centered thermodynamic, kinetic, and property data platform rather than a full multiscale simulation engine. The current validation focuses mainly on metallic alloy systems, because the implemented thermodynamic, mobility, and property descriptions are primarily assessed for metallic phases. In principle, the CALPHAD-to-data workflow can be extended to non-metallic systems such as oxides, ceramics, and salts, provided that suitable databases and property models are available and validated. Direct execution of density functional theory (DFT), molecular dynamics (MD), phase-field, or finite-element simulations is not included, but API/schema-defined data objects allow CALPHAD-derived quantities to be exchanged with external multiscale workflows. The platform currently uses validated internal and version-controlled databases; user-defined database import is under development and will require compatibility checking and provenance registration before routine use.
Phase equilibrium algorithm
Phase Lab computes multicomponent equilibrium by minimizing the total Gibbs free energy under mass-balance constraints following the approach of Sundman[25]. The total Gibbs energy (G) is written as:
where Na is the mole fraction of phase a, and GMa is the molar Gibbs energy of that phase as a function of temperature T, pressure P, and its constitution Y. The solver adopts a Lagrange multiplier formulation in which chemical potentials enforce mass balance. The procedure includes initialization by grid-based phase scanning[43,44], iterative linearization to update phase amounts and compositions, and a dynamic stability check that activates dormant phases when their driving forces become positive, promoting convergence toward the global equilibrium solution. To generate phase diagrams and property maps efficiently, Phase Lab implements a Zero-Phase-Fraction (ZPF) tracking algorithm[45] and uses automated global search/backtracking to resolve complex topologies.
Computational workflow and information transmission
The computational workflow of Phase Lab is organized as a CALPHAD-to-data pipeline, as shown in Figure 1. The pipeline standardizes the calculation lifecycle from user input to structured data export, including task submission, solver execution, result parsing, metadata attachment, provenance recording, persistent storage, and downstream reuse. The platform separates user interaction, application services, and numerical computation into three layers. The browser-based frontend supports module selection, parameter configuration, task submission, result visualization, and data export. The application layer provides user authentication, API services, input validation, solver-input generation, task orchestration, and centralized scheduling. The computational layer contains the server-side CALPHAD/HPC kernel, implemented mainly in C++ (over 70,000 lines of code), which performs Gibbs-energy minimization, diffusion and precipitation calculations, solidification simulations, and property evaluations using thermodynamic, kinetic, and property databases.
A typical calculation starts from a user-defined request containing the alloy system, composition, target module, thermodynamic conditions, and optional processing history. The request is submitted through the frontend or API and translated by the application layer into solver-ready input files (e.g., PhaseLab.in). The task is then assigned to a server-side compute node through the scheduler. After execution, numerical outputs and log files (e.g., PhaseLab.log), are parsed and linked with the corresponding input conditions, database version, model selection, solver settings, timestamp, and execution record. The parsed results are returned to the frontend for visualization and export, while raw files, structured outputs, and provenance records are stored persistently.
Each calculation is therefore represented not only as a numerical result, but also as a structured data object. Depending on the module, the exported data may include phase equilibria, phase fractions, phase compositions, transformation temperatures, diffusion profiles, precipitation descriptors, solidification curves, hot-cracking indices, thermophysical properties, or mechanical-property estimates. These outputs can be exported as comma-separated values (CSV) tables, JavaScript Object Notation (JSON) files, API/schema-defined records, or database objects linked to metadata and provenance. This representation allows CALPHAD results to be aggregated across alloy systems and reused in AI/ML, ICME, MGE, and optimization workflows without manual reconstruction of the calculation context.
A representative point-calculation output can be stored as a structured JSON-like data object, in which the input conditions, thermodynamic quantities, stable phases, phase fractions, and phase compositions are linked within the same record:
1 {
2 "module": "Phase_diagram",
3 "task": "Point",
4 "alloy_system": "Al-Mg-Zn",
5 "composition": {
6 "unit": "mass_fraction",
7 "Al": 0.77,
8 "Mg": 0.10,
9 "Zn": 0.13
10 },
11 "conditions": {
12 "temperature_K": 300,
13 "pressure_Pa": 101325,
14 "total_moles": 1
15 },
16 "thermodynamic_outputs": {
17 "gibbs_energy_J_per_mol": -10446.34,
18 "enthalpy_J_per_mol": -1174.60,
19 "entropy_J_per_mol_K": 30.9058,
20 "heat_capacity_J_per_mol_K": 25.0878
21 },
22 "system_composition": [
23 {
24 "component": "Al",
25 "mole_fraction": 0.8238322,
26 "mass_fraction": 0.7700000,
27 "chemical_potential": -8499.20,
28 "activity": 0.0331280
29 },
30 {
31 "component": "Mg",
32 "mole_fraction": 0.1187754,
33 "mass_fraction": 0.1000000,
34 "chemical_potential": -15643.61,
35 "activity": 0.0018892
36 },
37 {
38 "component": "Zn",
39 "mole_fraction": 0.0573924,
40 "mass_fraction": 0.1300000,
41 "chemical_potential": -27640.41,
42 "activity": 0.0000154
43 }
44 ],
45 "phase_summary": {
46 "total_phases_considered": 34,
47 "number_of_stable_phases": 2,
48 "stable_phases": ["FCC_A1", "T_PHASE"]
49 },
50 "stable_phase_outputs": [
51 {
52 "phase": "FCC_A1",
53 "mole_fraction": 0.7040631,
54 "mass_fraction": 0.6578289,
55 "phase_composition": {
56 "unit": "mole_fraction",
57 "Al": 0.9963126,
58 "Mg": 0.0036748,
59 "Zn": 0.0000126
60 }
61 },
62 {
63 "phase": "T_PHASE",
64 "mole_fraction": 0.2959369,
65 "mass_fraction": 0.3421711,
66 "phase_composition": {
67 "unit": "mole_fraction",
68 "Al": 0.4134844,
69 "Mg": 0.3926111,
70 "Zn": 0.1939045
71 }
72 }
73 ],
74 "additional_outputs": "..."
75}
For time-temperature-transformation (TTT)/continuous-cooling-transformation (CCT) calculations, transformation-boundary points are stored as discrete temperature-time pairs at specified transformed fractions. Here, 0.1% and 99.9% transformation are used as representative start and finish criteria, respectively. Each record contains the diagram type, transformation product, criterion, temperature, and time. For CCT calculations, cooling paths are stored separately using cooling rate, temperature, and time. The exported records are direct solver outputs converted into standardized CSV or JSON/API formats; unless otherwise stated, no additional smoothing or empirical correction is applied. Representative long-format export fields generated by Phase Lab for TTT/CCT calculations are summarized in Table 1.
Representative long-format TTT/CCT export fields generated by Phase Lab
| Diagram type | Product | Criterion percent (%) | Temperature (K) | Time (s) | Cooling rate (K/s) | Data type |
| TTT | Ferrite | 0.1 | 801.15 | 0.038 | N/A | Boundary_point |
| TTT | Pearlite | 0.1 | 801.15 | 0.017 | N/A | Boundary_point |
| TTT | Bainite | 99.9 | 411.15 | 244,675.394 | N/A | Boundary_point |
| CCT | Ferrite | 0.1 | 1,065.15 | 822,751.000 | N/A | Boundary_point |
| CCT | Bainite | 0.1 | 800.15 | 3,472,751.000 | N/A | Boundary_point |
| CCT | Cooling path | N/A | 1,147.43 | 0.000 | 0.1 | Cooling_path |
| CCT | Cooling path | N/A | 1,142.43 | 0.500 | 10.0 | Cooling_path |
This standardized data layer supports three common downstream uses. First, it enables AI/ML workflows such as dataset assembly, surrogate modeling, and active-learning export. Second, it supports ICME workflows for multi-objective screening and optimization under consistent provenance. Third, it allows MGE-oriented aggregation of computational property data across alloy systems. In this way, Phase Lab connects physics-based CALPHAD calculations with data-driven alloy design.
RESULTS AND DISCUSSION
This section assesses the platform with respect to calculation accuracy, computational efficiency and stability, and agreement with literature and experimental data across different modules. The evaluation includes comparison with Thermo-Calc for representative ternary systems, stability tests for multicomponent batch calculations, and validation of phase equilibria, diffusion and atomic mobility, thermophysical properties, precipitation and phase transformation kinetics, mechanical performance, and solidification-related hot cracking susceptibility. Collectively, these results demonstrate the capability of the platform to generate reusable, provenance-rich CALPHAD data products for AI/ICME/MGE workflows.
Benchmark validation of thermodynamic calculations
First, representative ternary systems were selected for direct comparison with Thermo-Calc in order to assess the accuracy and computational efficiency of the thermodynamic calculations. Owing to the functional and task-scale limitations of the Thermo-Calc 2025B (Free Educational Package version), the comparison was restricted to executable ternary calculations within its license scope. For each selected composition, molar Gibbs energy, liquidus temperature, and solidus temperature were calculated and compared under the same alloy system, composition, and calculation settings aligned as closely as practicable, including the thermodynamic database wherever applicable. In parallel, the average runtime per task and task completion rate were recorded for both codes in order to evaluate computational efficiency and execution stability.
Representative comparisons of molar Gibbs energy, liquidus temperature, and solidus temperature are listed in Table 2. For the ten ternary benchmark cases, the values calculated by Phase Lab were the same as those obtained from Thermo-Calc for all three reported quantities. Specifically, the molar Gibbs energy values ranged from -22,296.34 to -10,446.34 J·mol-1 in both codes, the liquidus temperatures ranged from 853.1618 to 1,604.5926 K, and the solidus temperatures ranged from 740.9668 to 937.7879 K. No numerical discrepancy was observed for the reported values in these benchmark examples.
Comparison of molar Gibbs energy at 300 K and calculated liquidus/solidus temperatures between Phase Lab and Thermo-Calc for representative ternary systems
| Composition (wt.%) | Molar Gibbs energy at 300 K (J·mol-1) | Liquidus temperature (K) | Solidus temperature (K) | |||
| Thermo-Calc | Phase Lab | Thermo-Calc | Phase Lab | Thermo-Calc | Phase Lab | |
| 80Al-10Cu-10Mg | -12,217.67 | -12,217.67 | 853.1618 | 853.1618 | 752.6879 | 752.6879 |
| 85Al-8Sc-7Ti | -22,296.34 | -22,296.34 | 1,481.1097 | 1,481.1097 | 937.7879 | 937.7879 |
| 78Al-12Zn-10Zr | -15,130.86 | -15,130.86 | 1,489.9027 | 1,489.9027 | 875.0246 | 875.0246 |
| 82Al-9Mg-9Sc | -17,825.30 | -17,825.30 | 1,307.4834 | 1,307.4834 | 757.1124 | 757.1124 |
| 75Al-15Cu-10Zr | -18,590.74 | -18,590.74 | 1,303.8679 | 1,303.8679 | 818.1481 | 818.1481 |
| 88Al-6Ti-6Zn | -13,701.81 | -13,701.81 | 1,381.1532 | 1,381.1532 | 911.7849 | 911.7849 |
| 79Al-11Mg-10Zr | -15,160.33 | -15,160.33 | 1,604.5926 | 1,604.5926 | 740.9668 | 740.9668 |
| 83Al-7Cu-10Ti | -18,449.08 | -18,449.08 | 1,479.1911 | 1,479.1911 | 821.6868 | 821.6868 |
| 86Al-8Sc-6Zn | -16,663.20 | -16,663.20 | 1,235.4275 | 1,235.4275 | 903.5287 | 903.5287 |
| 77Al-13Zn-10Mg | -10,446.34 | -10,446.34 | 858.2690 | 858.2690 | 741.5542 | 741.5542 |
The corresponding computational performance statistics are summarized in Table 3. In the ternary batch test, both Thermo-Calc and Phase Lab produced 20,000 valid outputs from 20,000 submitted tasks, corresponding to a completion rate of 100% for both codes. The average runtime per task was 0.011268 s for Thermo-Calc and 0.006933 s for Phase Lab under the present benchmark setting. These results indicate that Phase Lab reproduces the thermodynamic outputs of Thermo-Calc for the tested ternary systems while showing a shorter average runtime in this benchmark. Based on the ternary comparison, the assessment was further extended to multicomponent systems in order to evaluate computational efficiency and execution stability in higher-dimensional composition spaces. In this part, composition sets with different numbers of components were tested through batch execution under a unified calculation workflow. For the 9-component system, Phase Lab produced 9,932 valid outputs from 10,000 submitted tasks, corresponding to a completion rate of 99.32%, with an average runtime of 1.122 s per task. For the 12-component system, Phase Lab produced 9,814 valid outputs from 10,000 submitted tasks, corresponding to a completion rate of 98.14%, with an average runtime of 2.19 s per task. Equivalent multicomponent batch testing was not performed with Thermo-Calc because this was not supported by the Free Educational Package version used in this study. Overall, the results show that the platform maintains stable execution behavior under multicomponent batch-calculation conditions, while the average runtime increases with compositional dimensionality as expected.
Summary of computational performance and execution stability for Phase Lab and Thermo-Calc in ternary and multicomponent calculations
| System | Code | Number of tasks | Valid outputs | Completion rate (%) | Average runtime per task (s) |
| Ternary | Thermo-Calc | 20,000 | 20,000 | 100.00 | 0.011268 |
| Phase Lab | 20,000 | 20,000 | 100.00 | 0.006933 | |
| 9-component | Phase Lab | 10,000 | 9,932 | 99.32 | 1.122 |
| 12-component | Phase Lab | 10,000 | 9,814 | 98.14 | 2.19 |
Multicomponent phase equilibria
Thermodynamic accuracy was assessed by comparing calculated multicomponent phase diagrams with experimental data from the literature. Figure 2A and B present the calculated isothermal sections of the Al-Co-Cr and Al-Co-Ni ternary systems at 1,273 K, respectively. The predicted phase boundaries agree well with experimental measurements[46,47], reproducing the topology of multiphase regions and the stability ranges of ordered intermetallic phases. To evaluate performance in higher-order systems, Figure 2C presents the calculated isothermal section at the Al-rich corner of the Al-Cu-Mg-Zn quaternary system. Despite increased compositional complexity, the predicted phase regions remain consistent with experimentally determined boundaries[48], indicating good performance of the thermodynamic descriptions and equilibrium solver. In addition, Figure 2D shows a calculated vertical section of the Fe-C-Cr-Mn quaternary system, which is relevant to steel heat-treatment design. The predicted transformation temperatures and phase stability ranges closely match experimental observations[49], indicating that the equilibrium solver can handle multidimensional composition spaces in the tested cases. Beyond validating thermodynamic accuracy, these multicomponent equilibrium maps - including phase boundaries, transition temperatures, and phase fraction evolution - can be directly exported as structured datasets, providing consistent thermodynamic constraints for AI-assisted surrogate modeling, composition screening, and ICME phase-stability analysis across alloy systems.
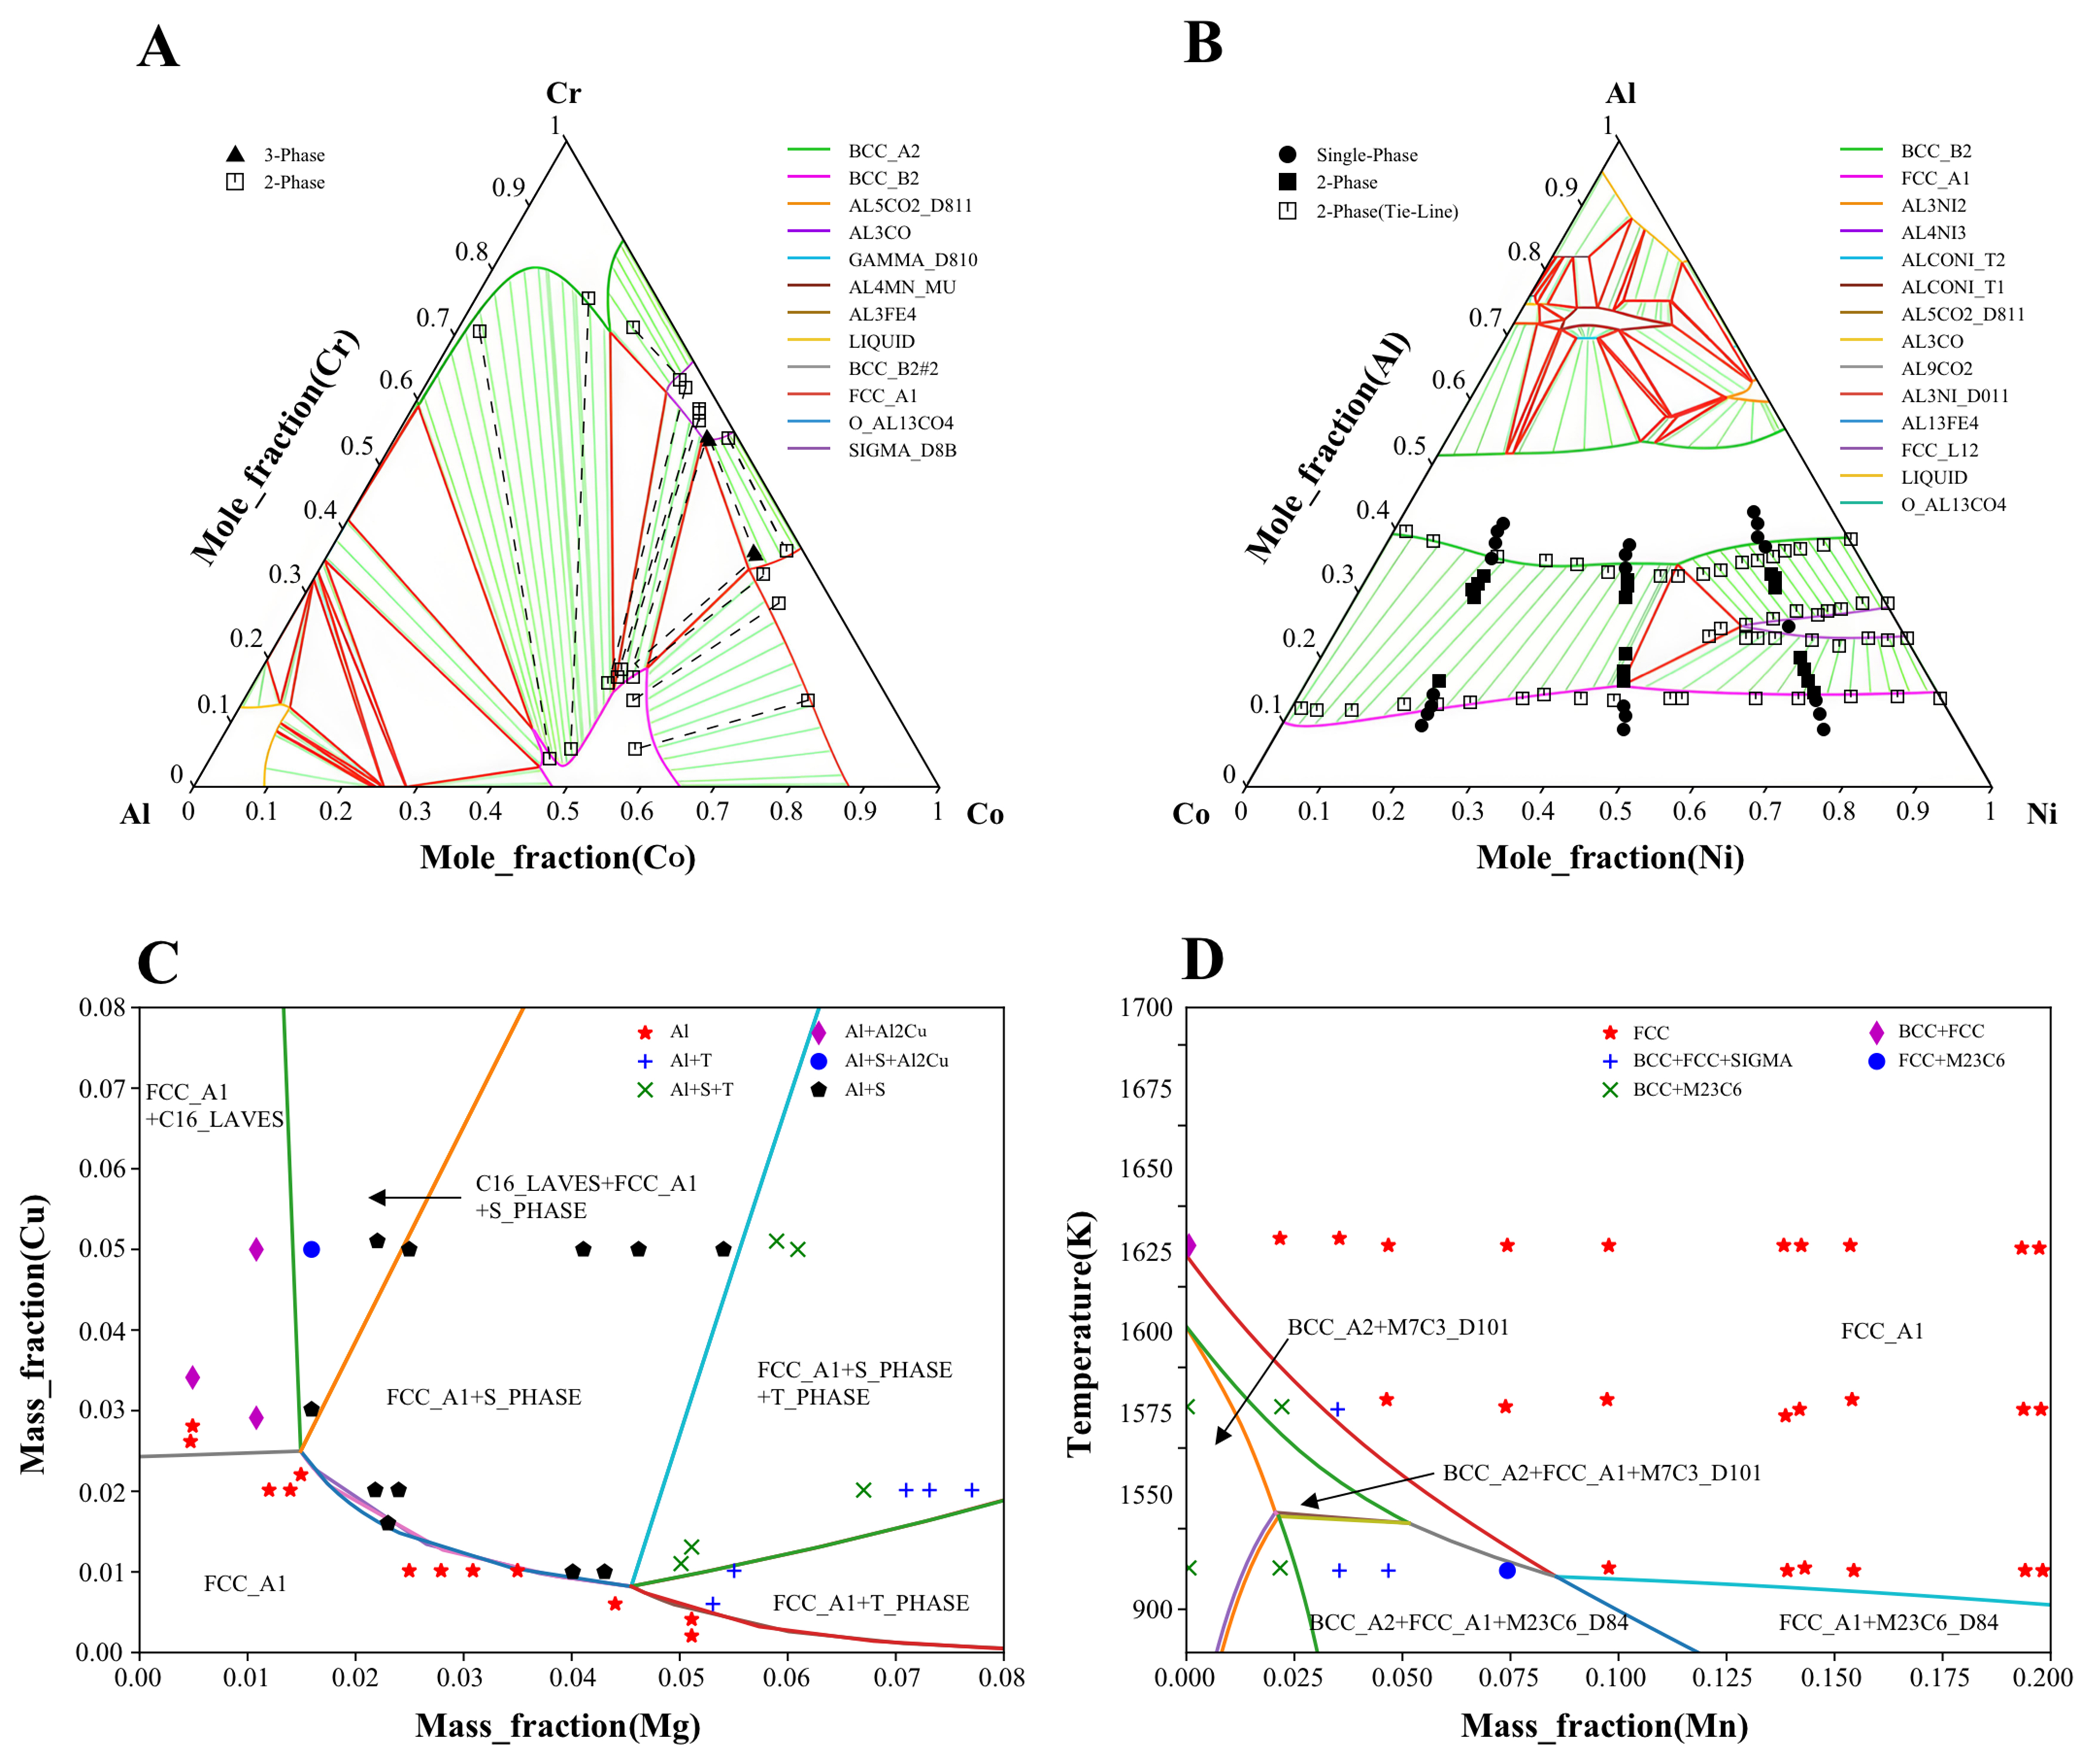
Figure 2. Calculated multicomponent phase diagrams compared with experimental data: (A) isothermal section of the Al-Co-Cr ternary system at 1,273 K[46]; (B) isothermal section of the Al-Co-Ni ternary system at 1,273 K[47]; (C) isothermal section of the Al-Cu-Mg-Zn quaternary system at the Al-rich corner[48]; (D) vertical section of the Fe-C-Cr-Mn quaternary system[49].
Diffusion and phase transformations
Diffusion is the fundamental kinetic mechanism governing microstructural evolution and homogenization in multicomponent alloys[27]. Phase Lab validates its kinetic module through a hierarchical approach, starting from atomic mobility and extending to complex precipitation and phase transformation phenomena. This module is benchmarked using diffusion coefficient benchmarks and composition-profile predictions from diffusion-couple simulations. Figure 3A compares the calculated interdiffusion coefficients for the face-centered cubic (FCC) phase in the binary Ni-Ti system with experimental measurements[50], showing good agreement. Moving to complex systems, Figure 3B demonstrates the platform’s capability to simulate composition profiles in the multicomponent Ni-Al-Co-Cr-Ta-Ti-W superalloy. The predicted diffusion paths align closely with high-throughput measurements[51], supporting the applicability of the mobility database for high-order systems.
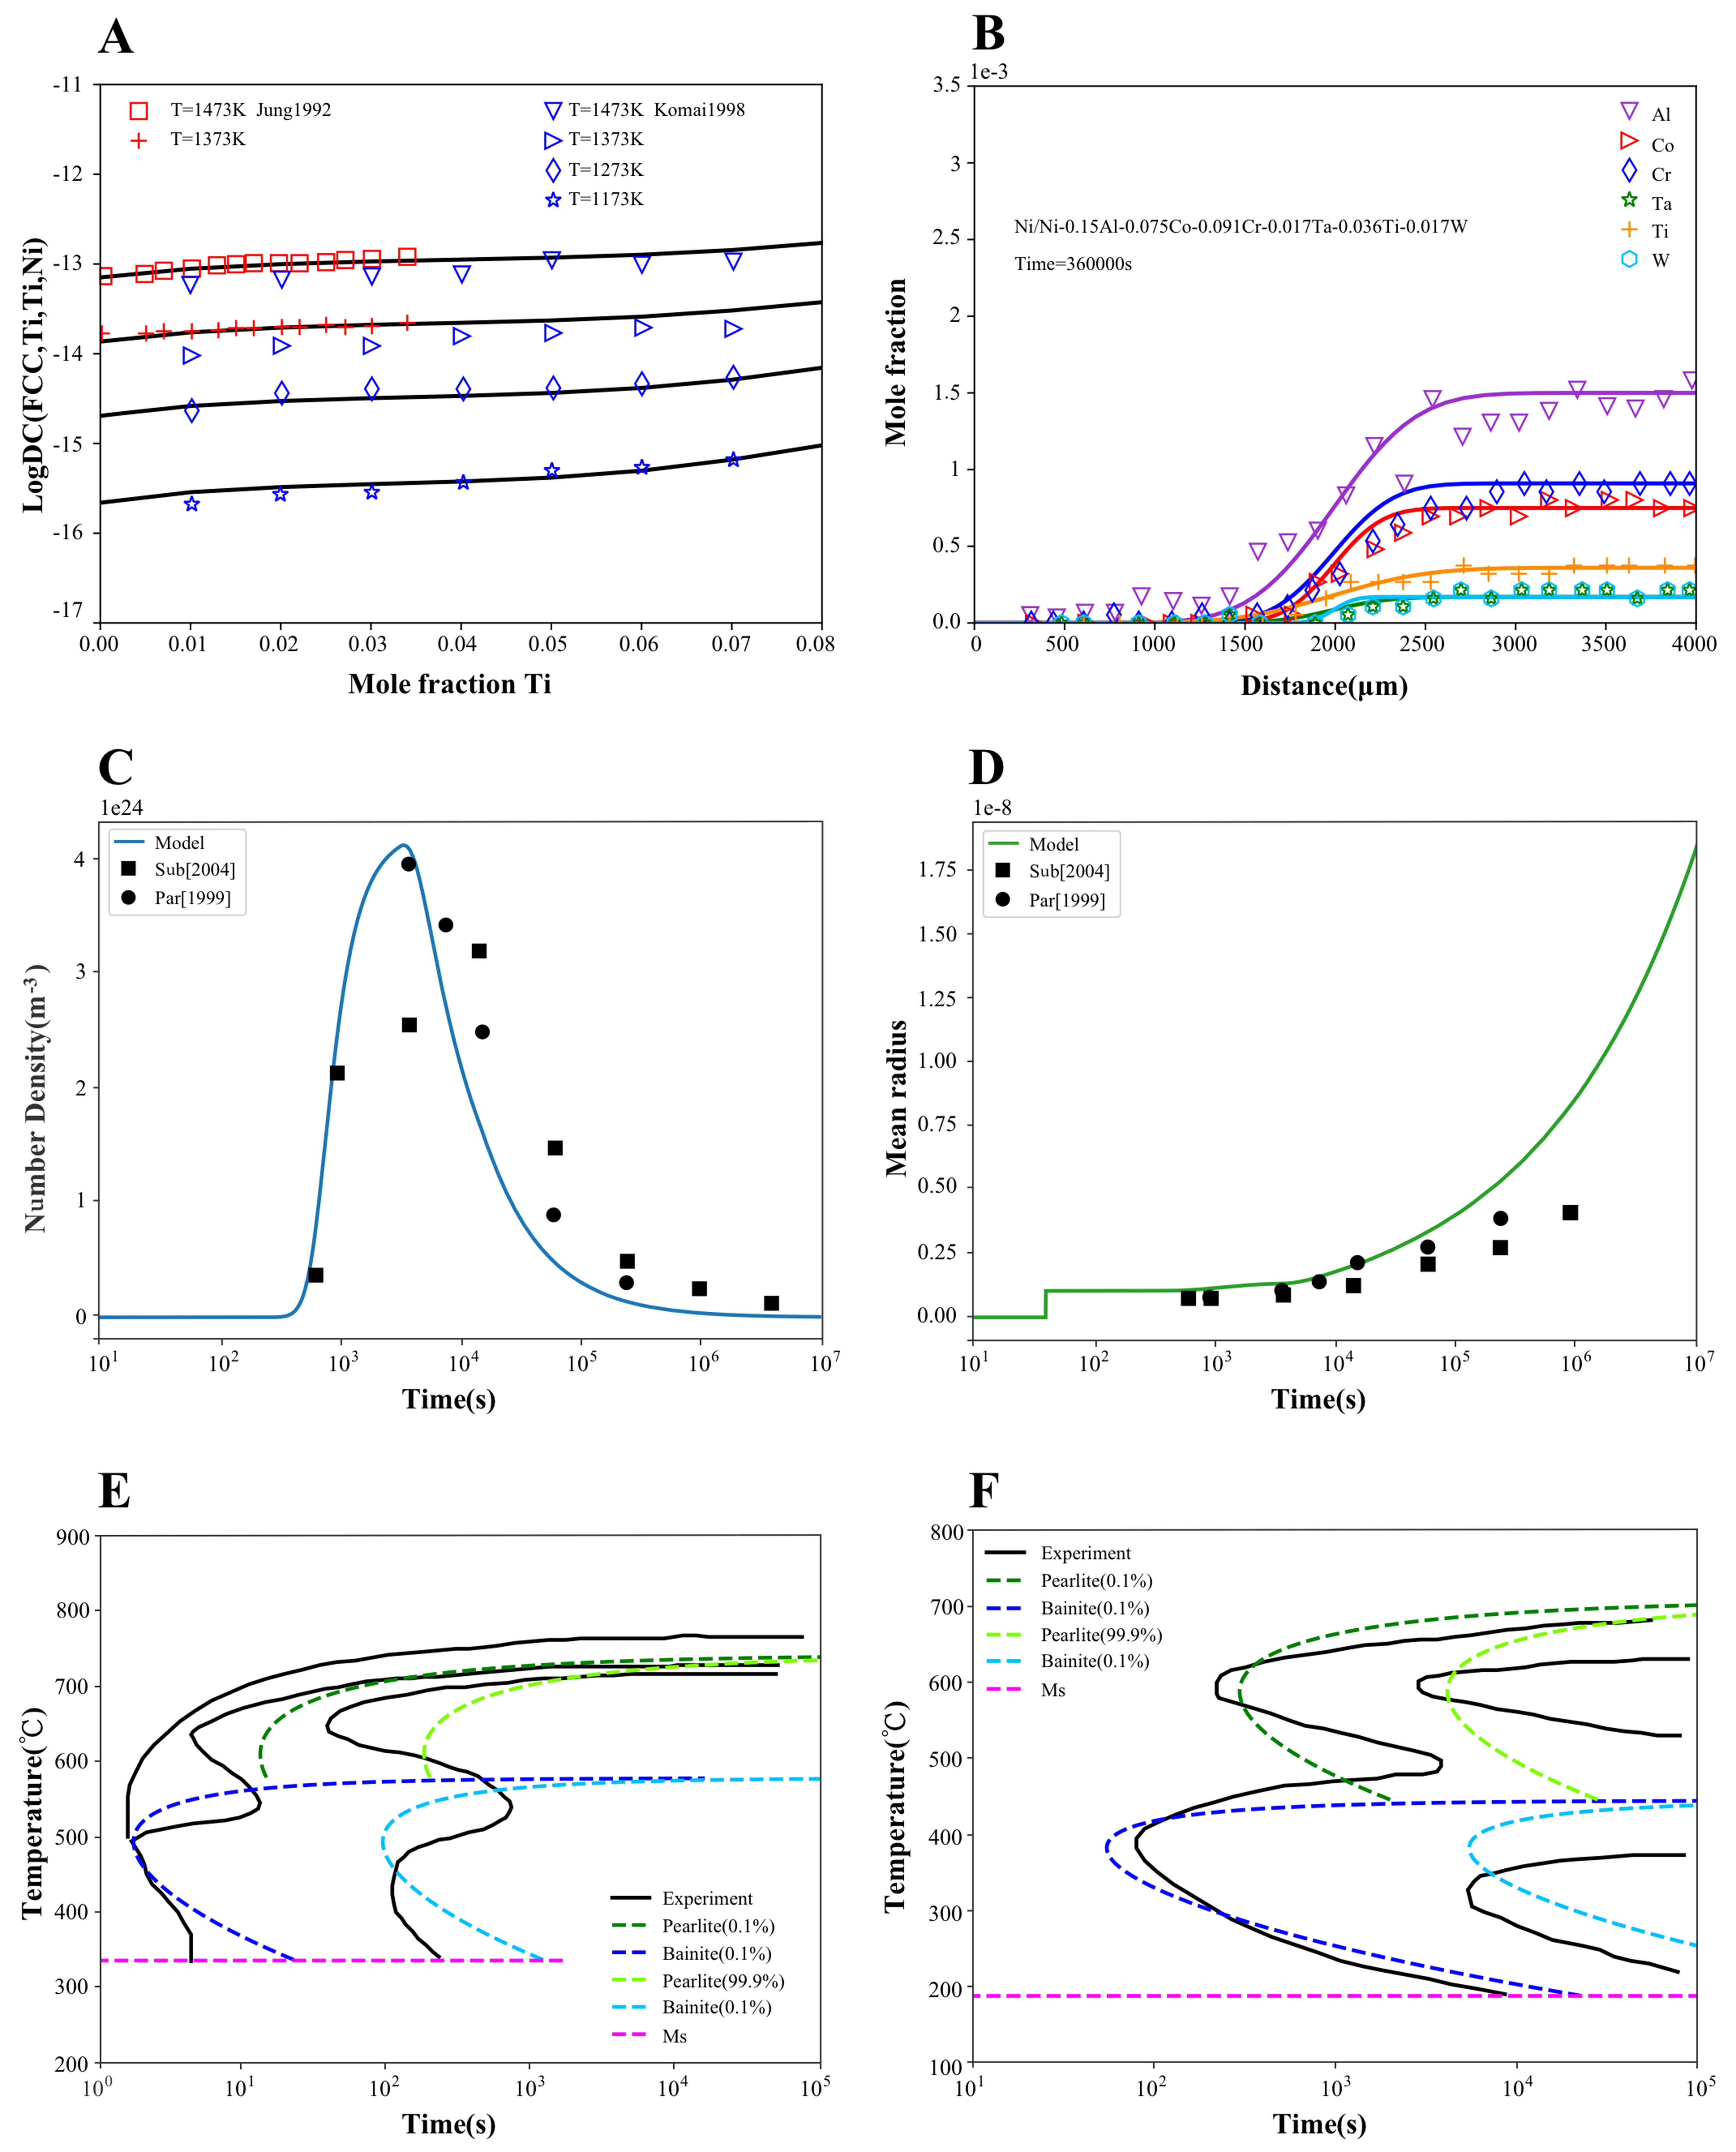
Figure 3. Validation of kinetic simulations regarding diffusion and phase transformations: (A) interdiffusion coefficients for the FCC phase in the binary Ni-Ti[50]; (B) composition profiles in the multicomponent Ni-Al-Co-Cr-Ta-Ti-W superalloy[51]; (C) temporal evolution of number density and (D) mean radius of γ′ precipitates in Ni-5.2Al-14.2Cr (at.%) alloy aged at 600 °C[41]; (E) TTT diagrams for 5140 steel (Fe-0.42C-0.68Mn-0.16Si-0.93Cr, wt.%)[53]; (F) TTT diagram for En36 carburized steel (Fe-0.7C-0.35Mn-0.16Si-3.24Ni-0.96Cr-0.06Mo, wt.%)[54]. FCC: Face-centered cubic; TTT: time-temperature-transformation.
Building upon accurate diffusion data, Phase Lab simulates diffusion-controlled phase transformations by combining CALPHAD driving forces with kinetic models (nucleation, growth, and coarsening). Figure 3C and D present the calculated temporal evolution of number density and mean radius for γ′ precipitation in a Ni-5.2Al-14.2Cr (at.%) alloy aged at 600 °C. These results show reasonable agreement with measurements[41], demonstrating that the implemented framework effectively captures the multi-stage precipitation kinetics in multicomponent alloys.
For steel heat treatment design, TTT and CCT diagrams are critical yet labor-intensive to determine experimentally[52]. Phase Lab enables efficient computation of these diagrams. Figure 3E and F compare the calculated TTT diagrams with experimental data for 5140 steel (Fe-0.42C-0.68Mn-0.16Si-0.93Cr, wt.%)[53] and En36 carburized steel (Fe-0.7C-0.35Mn-0.16Si-3.24Ni-0.96Cr-0.06Mo, wt.%)[54]. The agreement in transformation-start and transformation-finish boundaries supports the applicability of the implemented kinetic models to the tested ferrous alloys. The resulting diffusion coefficients, composition profiles, precipitation descriptors, and TTT/CCT boundary points constitute machine-readable kinetic datasets that are directly reusable in ICME process-microstructure models and AI-driven analysis of transformation kinetics.
Thermophysical properties
Accurate prediction of thermophysical properties is essential for process modeling because they govern phenomena such as thermal expansion and melt flow during solidification - as well as for assessing the functional performance of alloys[14,55]. To address these needs, Phase Lab employs CALPHAD-consistent formulations to evaluate molar volume, viscosity, and transport properties as functions of temperature and composition. Regarding volumetric and rheological behaviors, Figure 4A compares the calculated linear thermal expansion coefficient of pure FCC Ni against Ref.[32], showing that the main temperature dependence is reproduced. Figure 4B compares calculated liquid densities in the Ni-Co-Al ternary system with experiments[56], showing quantitative agreement across the measured temperature range. For melt rheology, Figure 4C and D present calculated liquid viscosities for the Ni-Ta binary and Al-Nb-Ti ternary systems, respectively, again exhibiting good agreement with experimental data[57,58]. In terms of transport phenomena, Figure 4E and F show the calculated thermal conductivities for the hexagonal close-packed (HCP) phase in the Al-Mg binary system and the FCC phase in the Al-Mg-Zn ternary system, respectively. The results show quantitative agreement with experimental data within the tested composition and temperature ranges[36,37]. For electrical transport, Figure 4G and H present electrical conductivity predictions for the FCC phase in the Cu-Mn binary and Cu-Mn-Sn ternary systems, showing good agreement with reported measurements[38,59]. Collectively, these benchmarks indicate reasonable performance of the implemented physical models, suggesting that Phase Lab can support integrated process simulations, alloy screening, and property optimization. Because these thermophysical properties are evaluated as continuous functions of temperature and composition using CALPHAD-consistent formulations, the resulting property curves and tables can be systematically aggregated into reusable datasets for ICME process simulation and MGE-oriented property mapping.
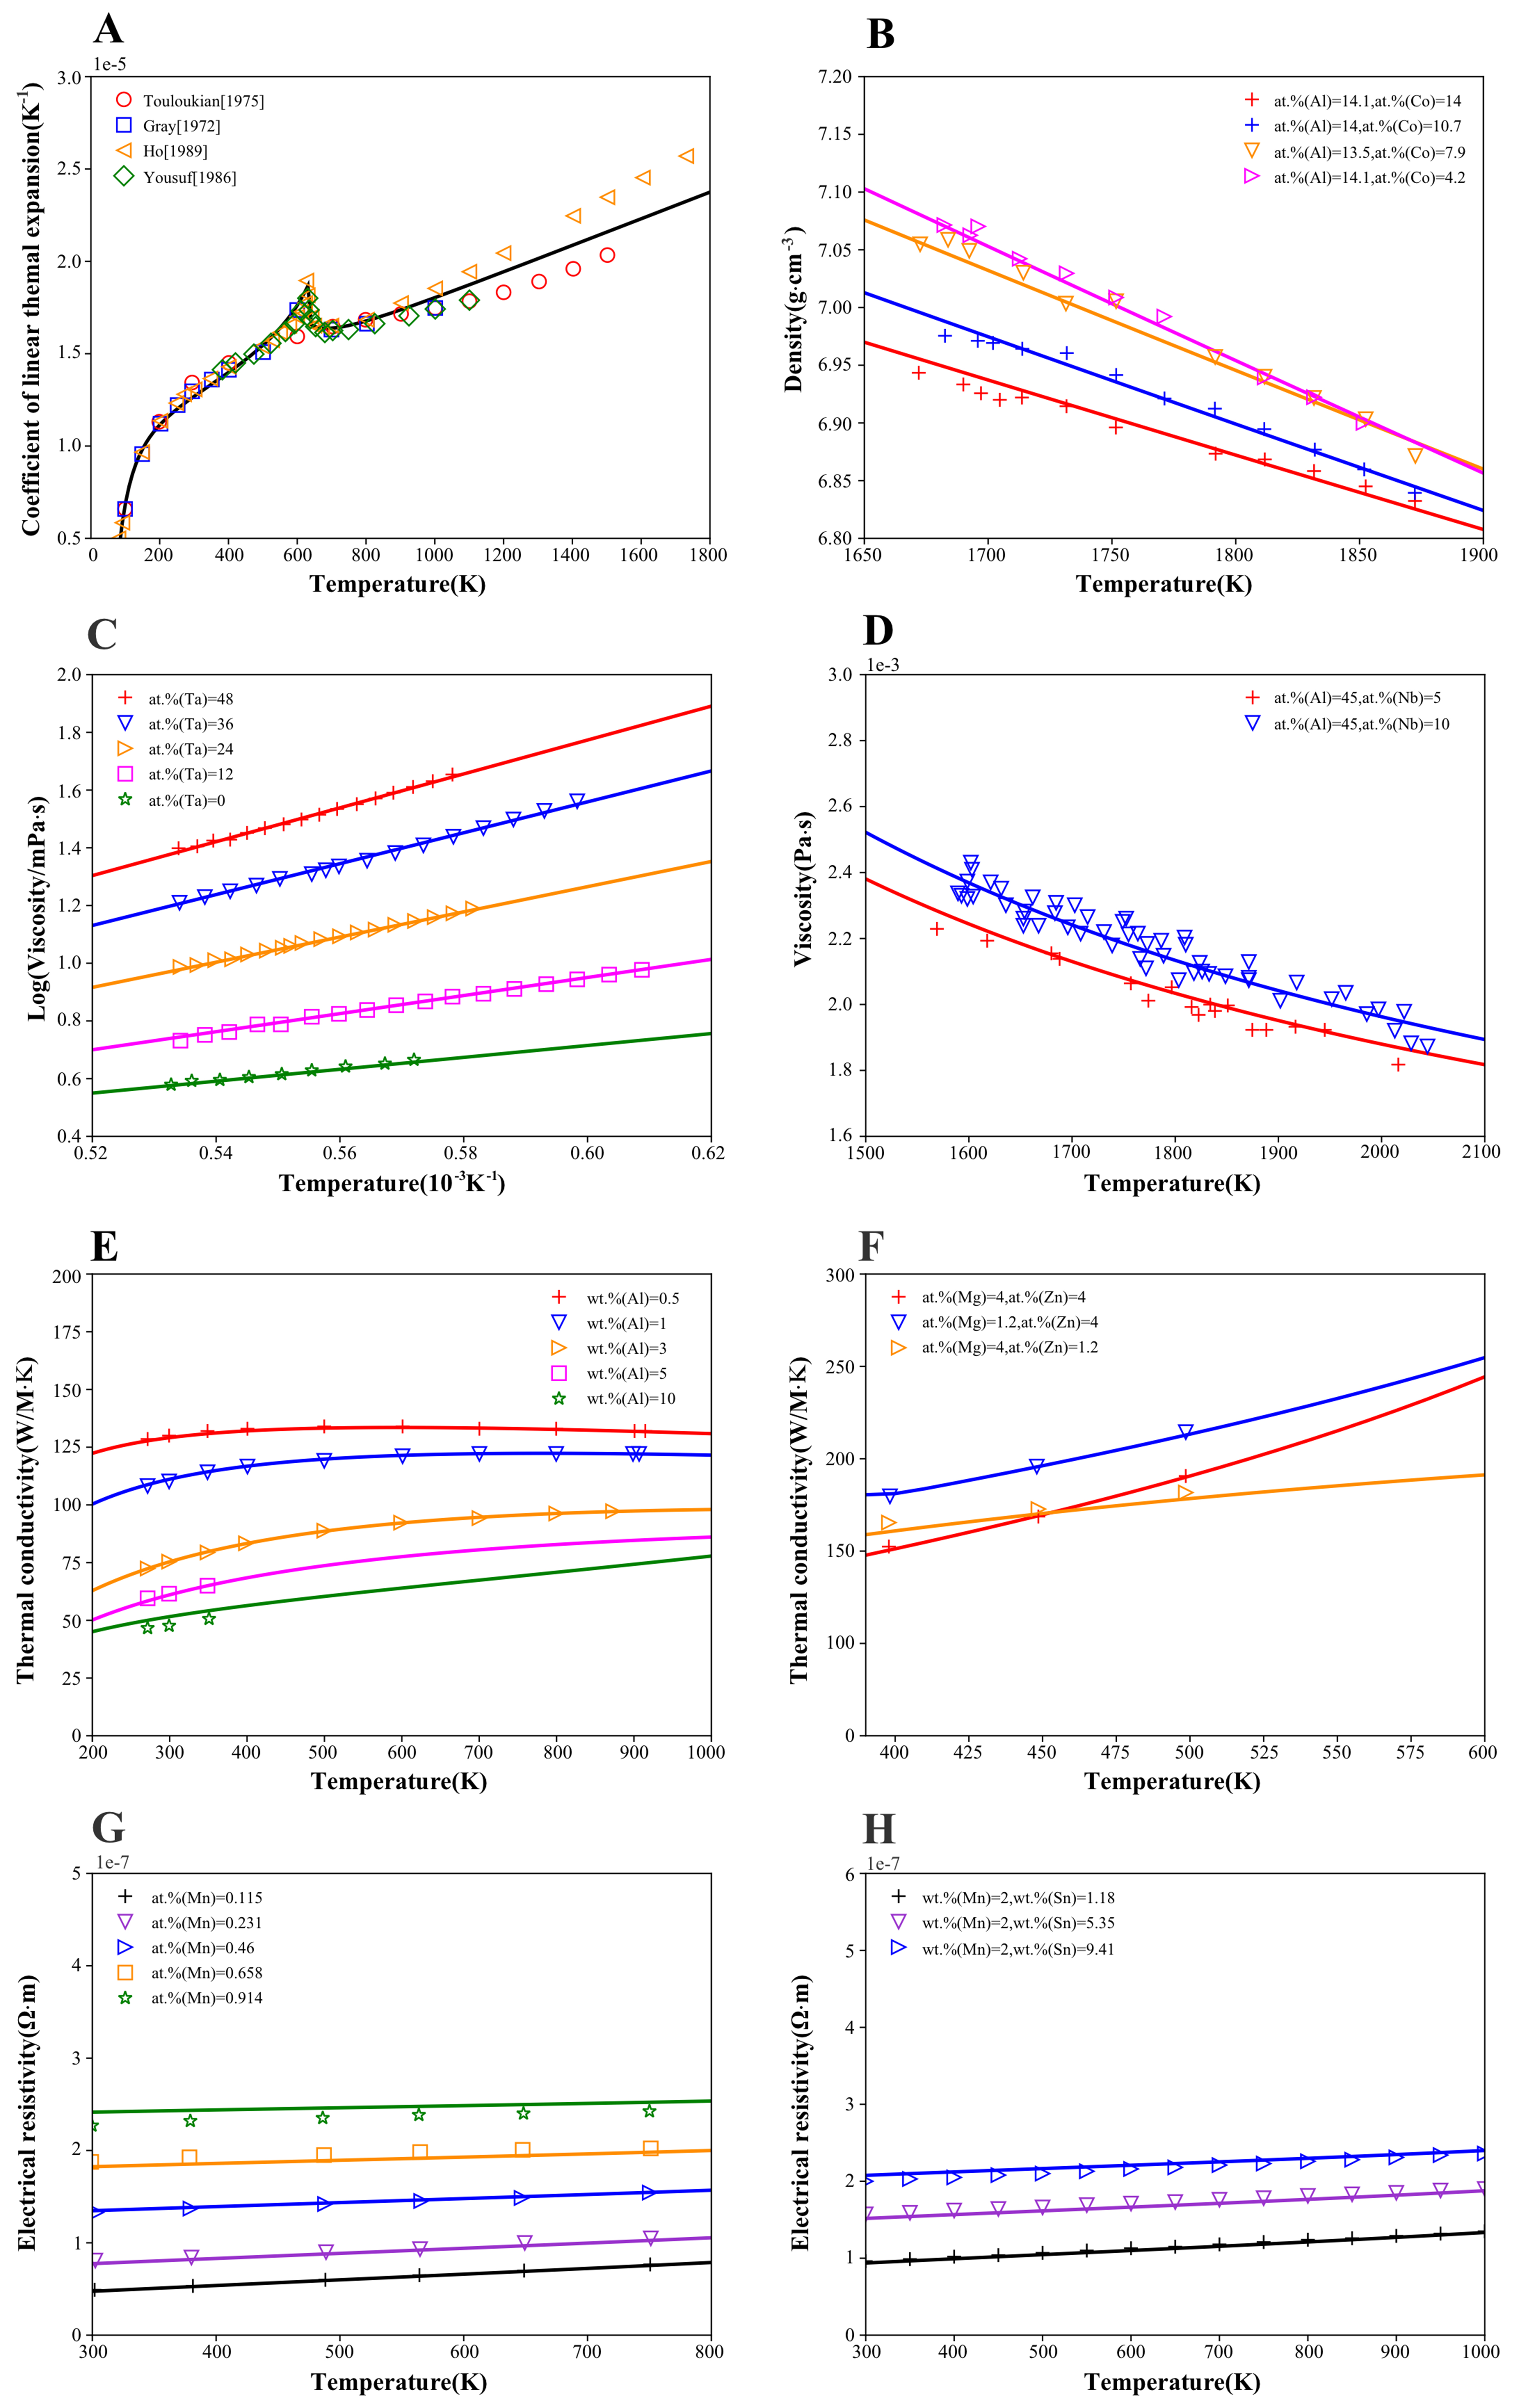
Figure 4. Validation of thermophysical properties: (A) linear thermal expansion coefficient of pure FCC Ni[32]; (B) liquid-phase densities in the ternary Ni-Co-Al[56]; (C) viscosity of the binary Ni-Ta[57]; (D) viscosity of the ternary Al-Nb-Ti[58]; (E) thermal conductivity of HCP phase in the binary Al-Mg[36]; (F) thermal conductivity of FCC phase in the ternary Al-Mg-Zn[37]; (G) electrical conductivity of FCC phase in the binary Cu-Mn[59]; (H) electrical conductivity of FCC phase in the ternary Cu-Mn-Sn[38]. FCC: Face-centered cubic; HCP: hexagonal close-packed.
Solidification performance and hot cracking susceptibility
Solidification behavior critically affects manufacturability and defect formation in casting and additive manufacturing[9,60]. Figure 5 evaluates the solidification module by comparing calculated solidification paths with experimental data. For the steel case [Figure 5A], the partial equilibrium approximation is used to account for the fast diffusion of interstitial carbon, showing good agreement with measurements reported by Koshikawa et al.[61]. For the Ni-based superalloy case [Figure 5B], the Scheil-Gulliver model captures the segregation behavior of substitutional alloying elements and is consistent with experimental data from Zheng et al.[62]. These case studies illustrate that Phase Lab flexibly selects appropriate approximations to treat different diffusion regimes and alloy classes.
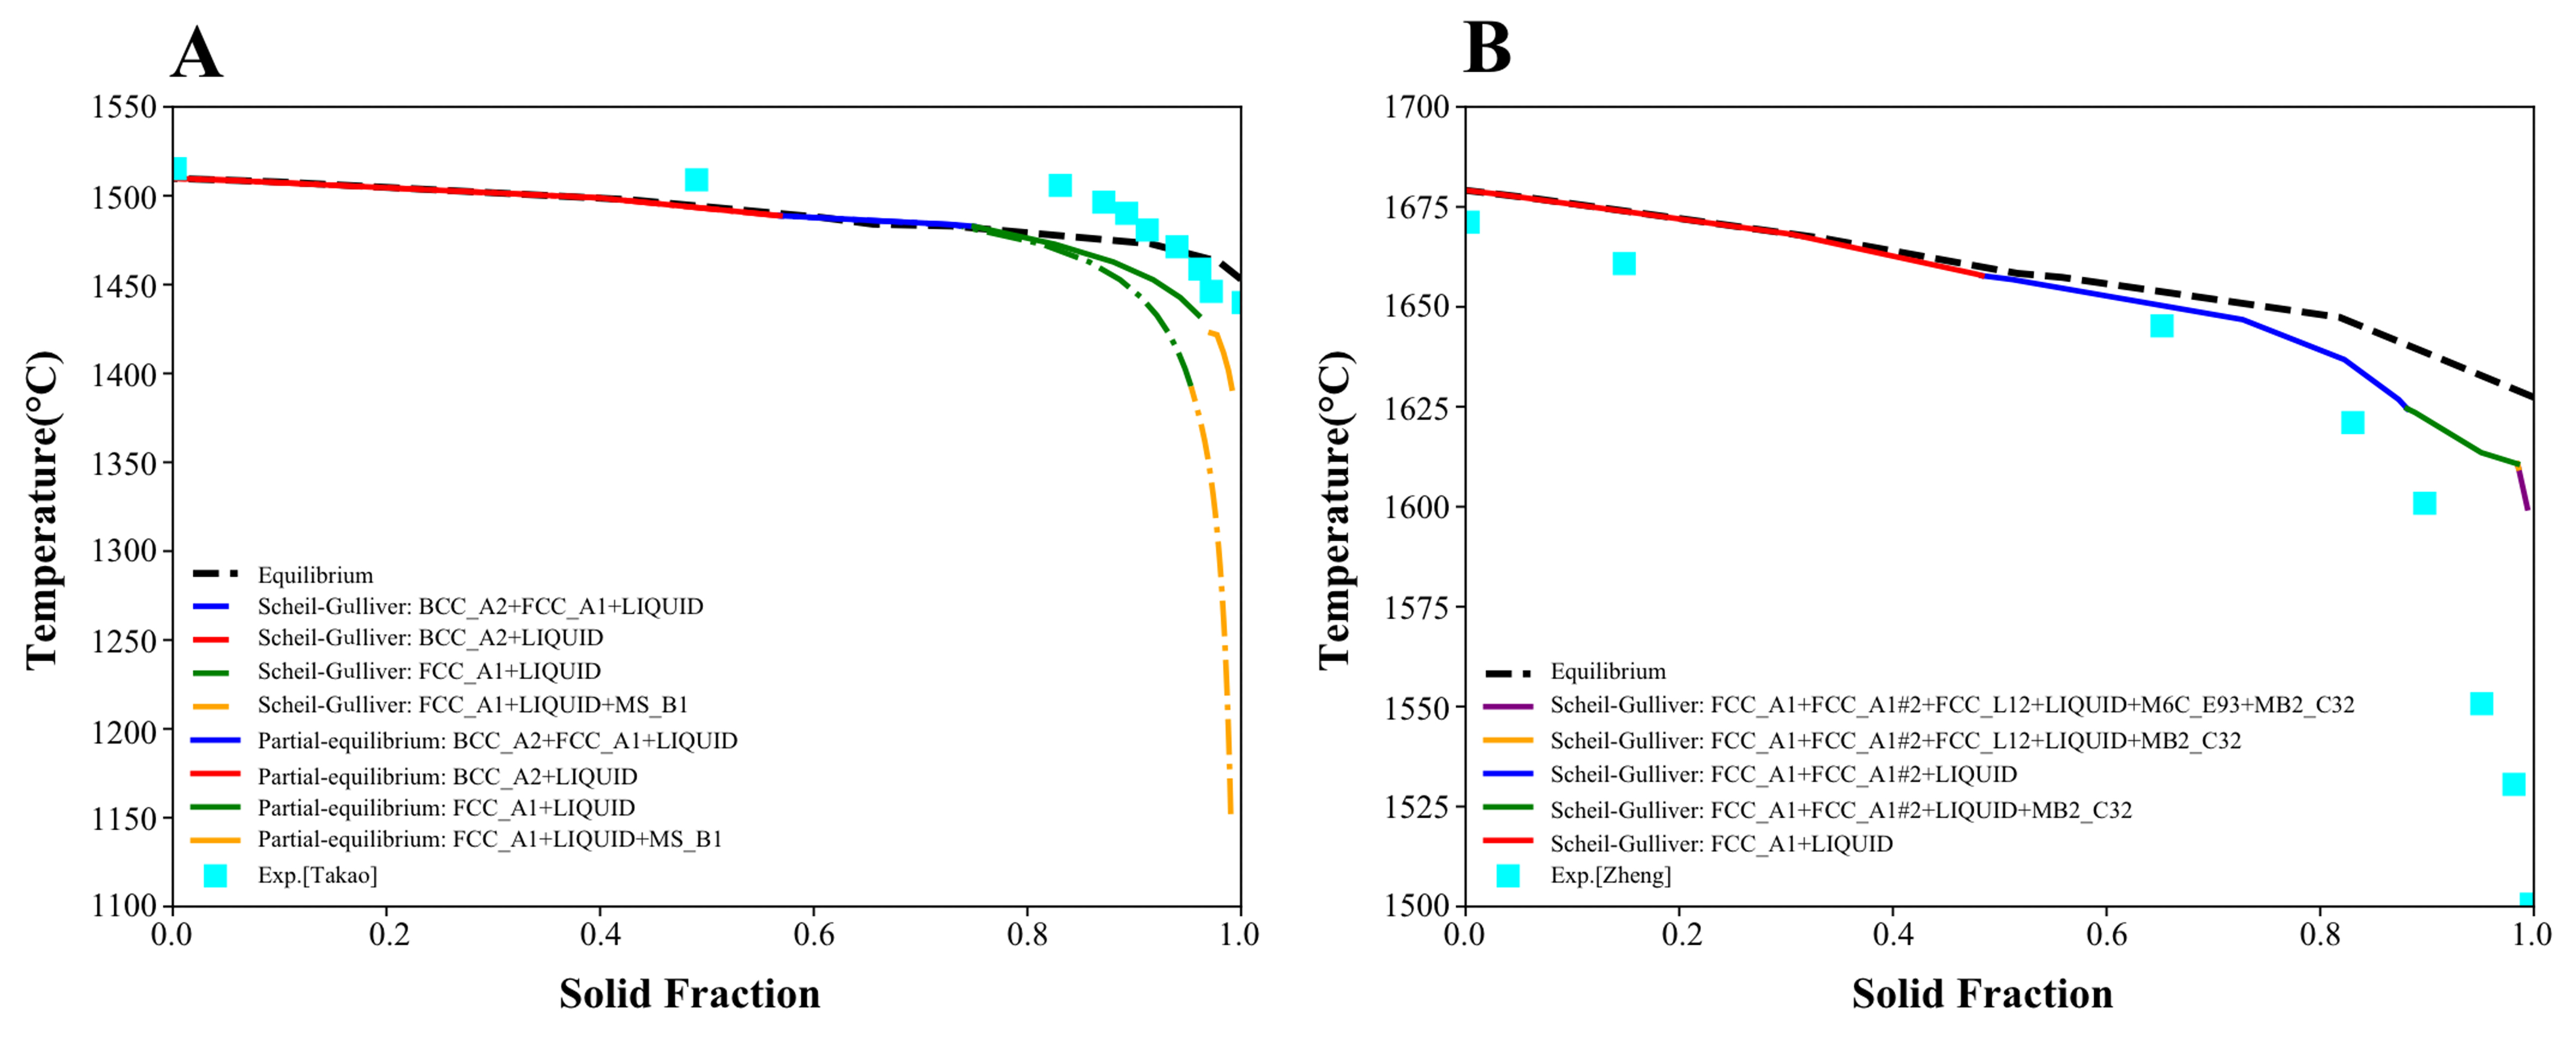
For Ni-based superalloys, solidification behavior is closely related to weldability and hot cracking susceptibility because thermal stress and wide freezing ranges often promote crack formation during welding and additive manufacturing[2,12,60,63]. In this context, Phase Lab has also been applied in a recent study on the GH3539 superalloy to analyze the effects of minor alloying additions on solidification-assisted cracking[64]. The calculations showed that Zr significantly widens the solidification temperature range (STR), consistent with its crack-promoting role, whereas C and Si also modify the STR and solidification response but with more complex effects associated with both increased cracking tendency and eutectic-assisted crack filling. These application studies demonstrate that the solidification module can support not only standard path prediction, but also composition-sensitive interpretation of weldability and crack formation in engineering alloys. For broader solidification-related hot-cracking assessment, Phase Lab integrates multiple commonly used cracking indices (SI, CSC, CTI, and SCI) within a single workflow. With a consistent non-equilibrium solidification setting, users can obtain all indices and comparative rankings in a single run, with results directly exportable for alloy down-selection. This integrated implementation avoids duplicated and potentially inconsistent recalculation of terminal solidification characteristics (e.g., freezing range and end-of-solidification metrics) and segregation paths across disparate tools, thereby improving computational efficiency and reproducibility for screening purposes. As summarized in Table 4, susceptibility criteria were calculated for a set of commercial superalloys. The results indicate that CSC and SCI show stronger correspondence with experimentally reported printability/weldability for the alloy set considered, whereas SI and CTI provide weaker discrimination. Alloys with high CSC/SCI values - such as IN738LC, IN939, CM247LC, and Mar-M247 - are widely reported to exhibit poor weldability and elevated cracking risk[2,65-67], while alloys with lower indices - such as IN718 and the ABD-series alloys - exhibit improved processability[2,13,31,68-71]. The calculations also quantify the role of minor alloying additions: trace Hf and Zr additions (e.g., in CM247LC and IN939) increase cracking susceptibility by expanding the terminal freezing range, consistent with experimental observations. The integrated, single-run evaluation of multiple solidification cracking indices enables the generation of consistent ranking datasets without duplicated or inconsistent recalculation, which is particularly advantageous for high-throughput alloy down-selection in AI-assisted and ICME-based design workflows.
Calculated hot cracking susceptibility criteria (SI, CSC, CTI, and SCI) for typical Ni-based superalloys compared with literature data included for comparison
| Ni | Al | B | C | Co | Cr | Fe | Hf | Mo | Nb | Ta | Ti | W | Zr | SI | CSC | CTI | SCI (fs = 0.90-0.99) | SCI (fs = 0.99) | |
| Mar-M247 | Bal | 5.5 | 0.015 | 0.15 | 10 | 8.4 | - | 1.5 | 0.7 | - | 3.0 | 1.0 | 10 | 0.05 | 128 245[31] | 2.92 | 40 40[31] | 4,572 | 21,626 |
| CM247LC | Bal | 5.6 | 0.01 | 0.07 | 9 | 8 | - | 1.4 | 0.5 | - | 3.2 | 0.7 | 10 | 0.01 | 128 238[2] | 3.2 | 40 | 5,161 15,980[2] | 28,890 |
| CM247LC Hf free | Bal | 5.6 | 0.01 | 0.07 | 9 | 8 | - | - | 0.5 | - | 3.2 | 0.7 | 10 | 0.01 | 81 151[2] | 1.85 | 40 | 2,001 5,036[2] | 7,733 |
| IN939 | Bal | 1.76 | 0.009 | 0.16 | 18.8 | 22.1 | - | 0.01 | - | 0.97 | 1.37 | 3.8 | 1.96 | 0.11 | 172 193[2] | 1.85 | 30 | 4,194 7,170[2] | 21,291 |
| IN939 Zr free | Bal | 1.76 | 0.009 | 0.16 | 18.8 | 22.1 | - | 0.01 | - | 0.97 | 1.37 | 3.8 | 1.96 | - | 155 178[2] | 1.29 | 30 | 2,692 4,352[2] | 7,111 |
| IN718 | Bal | 0.6 | 0.005 | 0.05 | - | 19 | 19 | - | 3 | 5 | - | 0.9 | - | - | 242 243[2] | 0.24 | 20 | 865 921[2] | 2,696 |
| IN738LC | Bal | 3.4 | 0.01 | 0.09 | 8.5 | 16 | - | - | 1.7 | 0.8 | 1.7 | 3.4 | 2.6 | 0.06 | 135 148[2] | 2.52 | 30 | 3,537 6,681[2] | 20,628 |
| ABD-850AM | Bal | 1.29 | 0.003 | 0.01 | 8.99 | 8.3 | - | - | 1.89 | 0.6 | 0.44 | 2.22 | 4.74 | - | 86 142[2] | 2 | 10 | 2,318 5,545[2] | 11,711 |
| ABD900-AM | Bal | 2.11 | 0.005 | 0.05 | 19.93 | 16.96 | - | - | 2.09 | 1.78 | 1.42 | 2.39 | 3.08 | - | 187 198[2] | 1.16 | 42 | 2,821 3,577[2] | 1,063 |
Mechanical properties
To evaluate the predictive capability for mechanical performance, Phase Lab was benchmarked against experimental strength and creep data for a wide range of Ni-based superalloys. The strength module combines CALPHAD-derived state variables with physics-based strengthening contributions from solid solution, grain boundaries (Hall-Petch), and precipitation hardening. Experimental datasets for UNS-series alloys were compiled from standard industry references, including Special Metals technical datasheets and ASM handbooks[72,73]. Figure 6A and B compare the calculated room-temperature YS and UTS with experimental values, showing strong linear correlation. To assess thermal responses, Figure 6C illustrates the temperature-dependent strength evolution of Nimonic 901, where the model reproduces the main experimental trends over the measured range. Extending this validation, Figure 6D compares calculated and experimental high-temperature YSs across multiple commercial alloys, demonstrating good agreement.
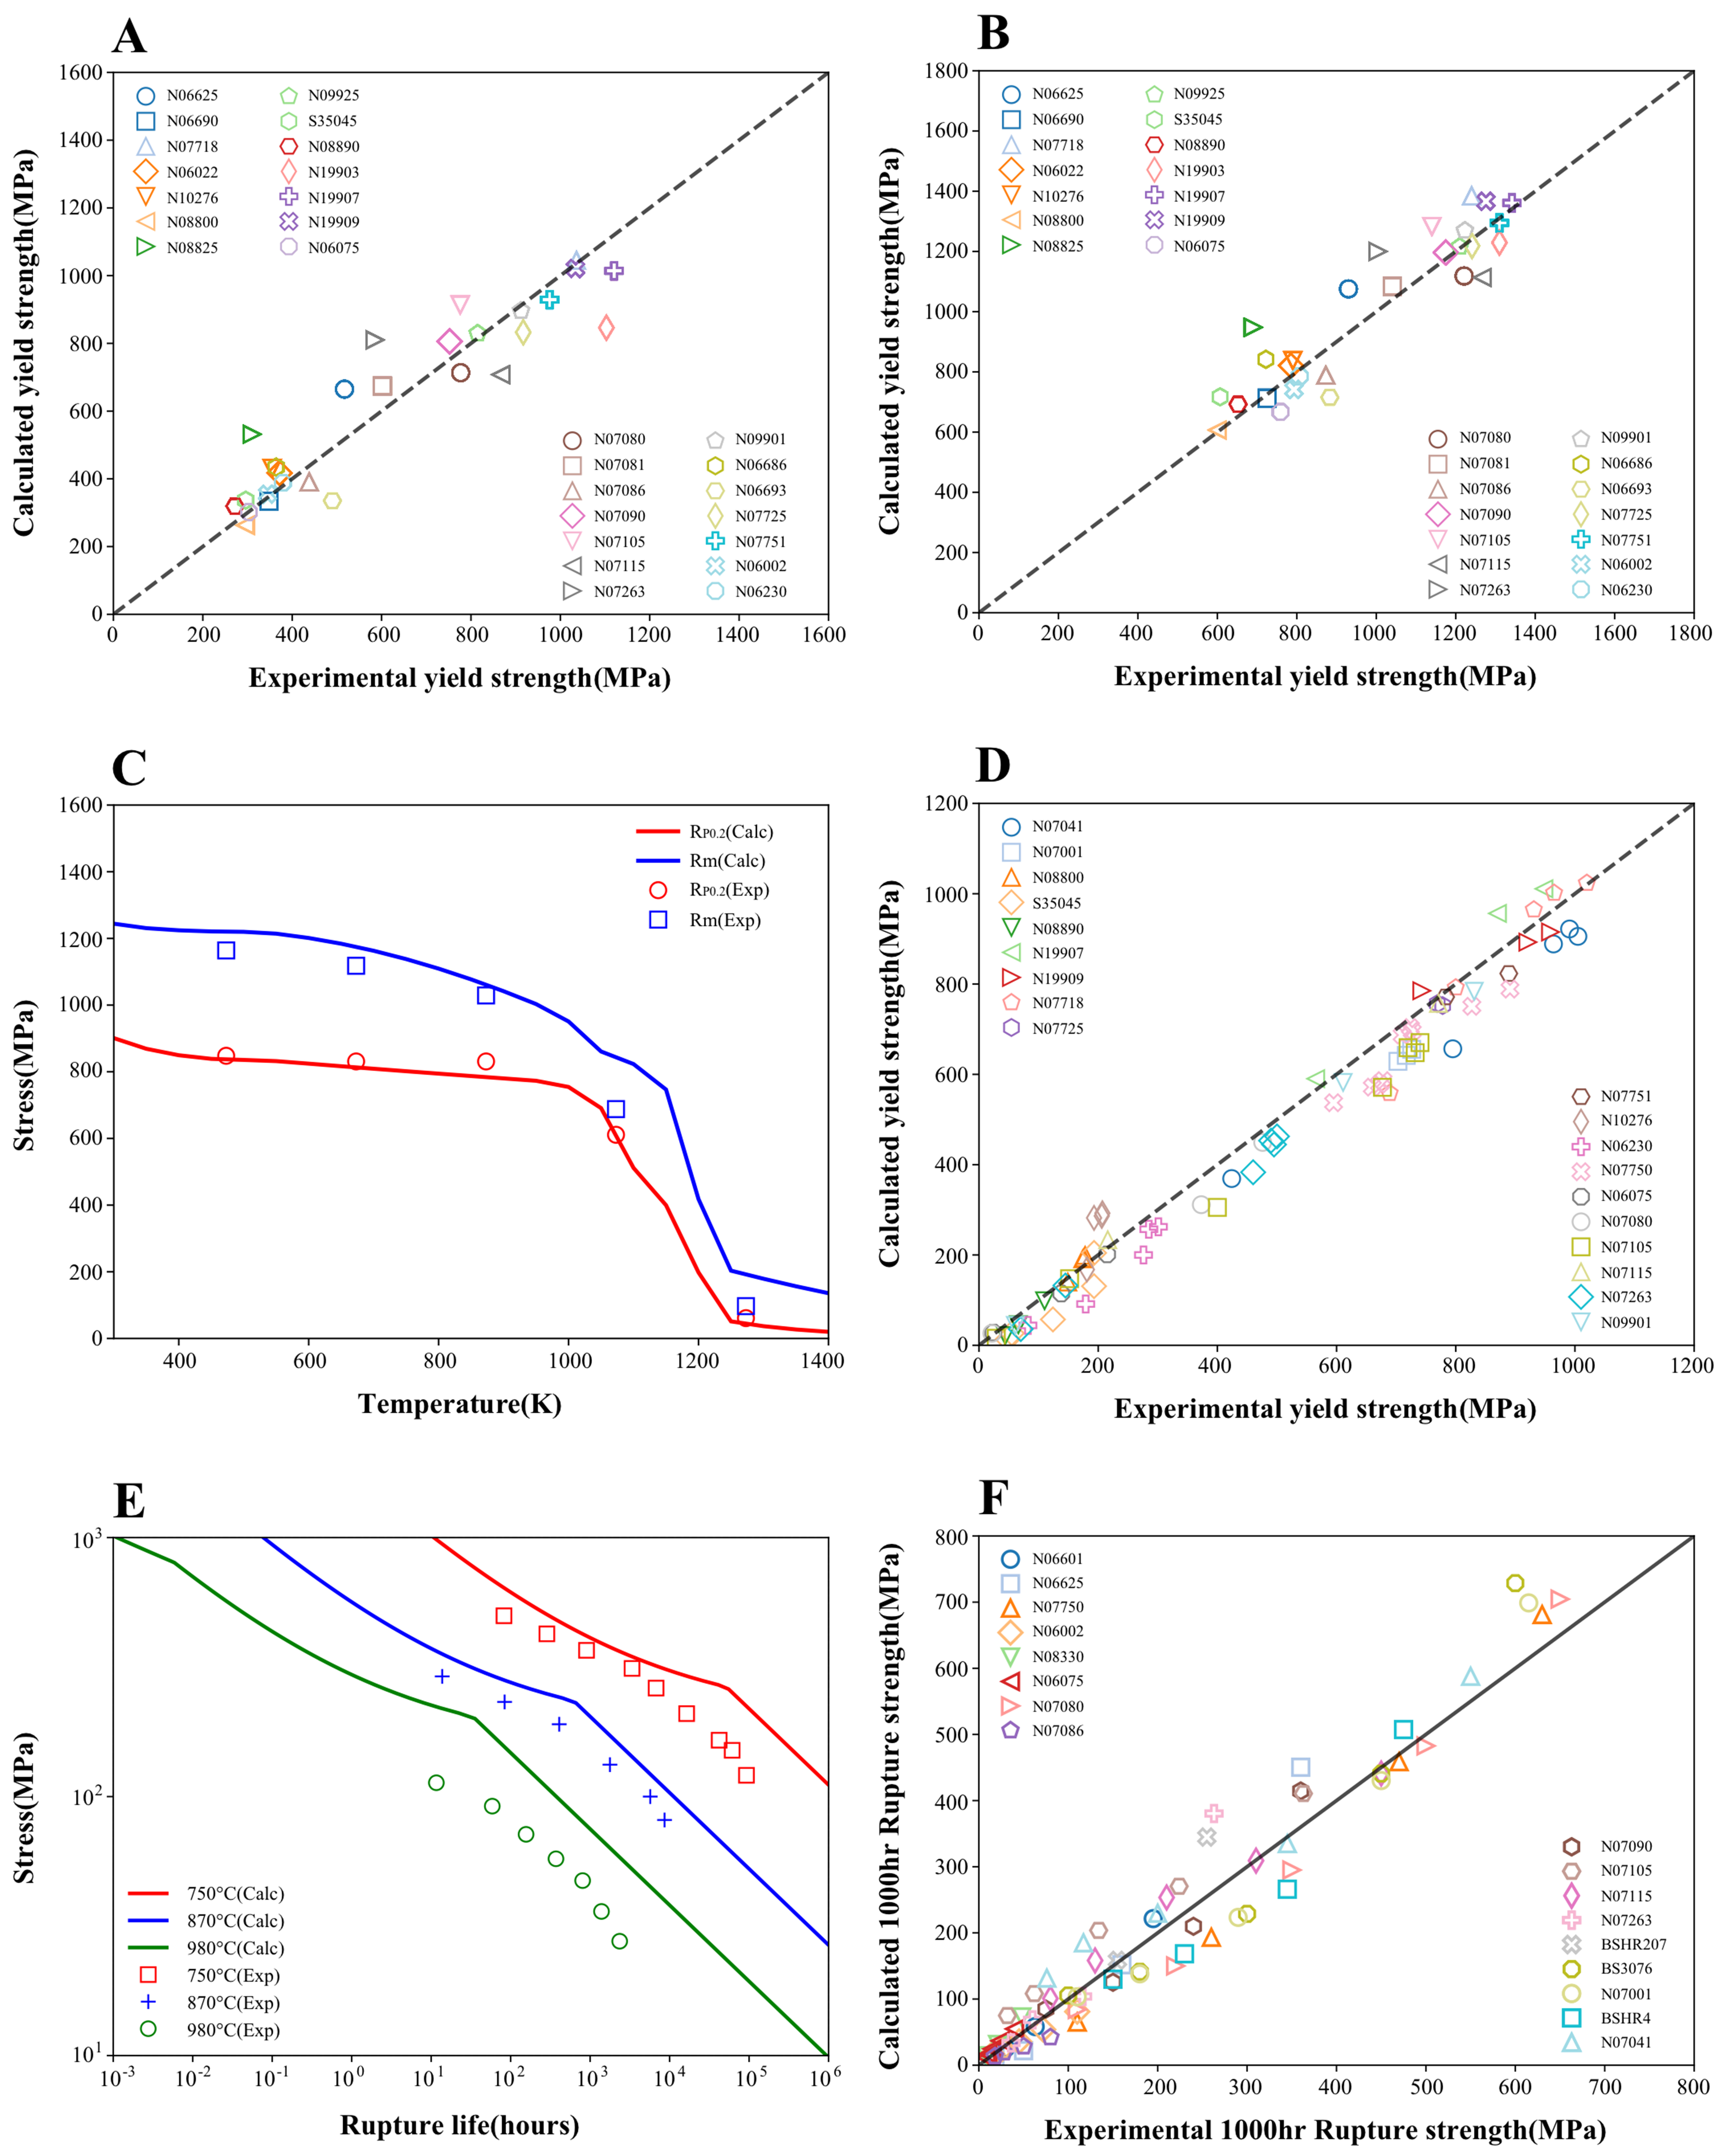
Figure 6. Validation of strength and creep performance predictions for Ni-based superalloys with experimental data[72,73]: (A) YS and (B) UTS at room temperature; (C) temperature-dependent strength evolution curve for Nimonic 901; (D) high-temperature YS for various commercial alloys; (E) log(stress) vs. log(rupture life) plots for Nimonic 105 at varying temperatures; (F) 1,000-hour rupture strength for various alloys. YS: Yield strength; UTS: ultimate tensile strength.
Beyond static strength, Phase Lab integrates thermodynamic and kinetic data to support creep assessment. Figure 6E presents the calculated log(stress)-log(rupture life) relationships for Nimonic 105 at various temperatures, capturing the general time-dependent trend. Figure 6F validates the 1,000-hour rupture strength for a broad range of commercial Ni-based alloys. Quantitative error statistics for these datasets are summarized in Table 5, where N is the number of data points, R2 is the coefficient of determination, MAE is the mean absolute error, MAPE is the mean absolute percentage error, and MaxAE is the maximum absolute error. Overall, the strength predictions show reasonable agreement with experiments. The 1,000-hour creep rupture strength predictions capture the general trend across alloys but exhibit larger scatter, and should therefore be regarded as screening-level estimates rather than high-precision lifetime predictions.
Summary of prediction errors for mechanical properties (Ni-based superalloys)
| Property | N (data points) | R 2 (coefficient of determination) | MAE (mean absolute error) | MAPE (mean absolute percentage error) | MaxAE (maximum absolute error) |
| Room-temperature YS | 27 | 0.858 | 78.8 MPa | 14.2% | 256.8 MPa |
| Room-temperature UTS | 28 | 0.824 | 81.5 MPa | 8.9% | 258.1 MPa |
| High-temperature YS | 77 | 0.968 | 47.5 MPa | 15.9% | 138.4 MPa |
| 1,000-hour creep rupture strength | 76 | 0.878 | 41.3 MPa | 26.8% | 317.2 MPa |
Taken together, the cross-domain comparisons indicate that the integrated CALPHAD-based models provide reasonable agreement with reference data in the tested cases and highlight the value of a consistent CALPHAD-to-data workflow. By exporting results as standardized, provenance-rich data products, Phase Lab enables reproducible aggregation across alloy systems and provides directly reusable inputs for surrogate modeling, screening, and data-driven ICME/MGE workflows that are difficult to realize with ad hoc, tool-specific practices.
CONCLUSIONS
This work presents Phase Lab as a cloud-native CALPHAD-to-data platform for alloy designers, CALPHAD practitioners, and AI/ICME/MGE researchers who require scalable computation together with standardized data products. The main contribution of the platform is not the development of new thermodynamic or kinetic models, but the standardization of CALPHAD calculations into reproducible, metadata-linked, and machine-readable data products. By integrating server-side computation, task orchestration, provenance tracking, database/model versioning, and structured export, Phase Lab provides a practical route for connecting physics-based calculations with AI/ML, ICME, and MGE workflows.
The benchmark and validation results demonstrate that Phase Lab can reproduce representative CALPHAD calculations and maintain stable execution in high-throughput settings. In point-to-point ternary benchmarks, Phase Lab matched Thermo-Calc results for molar Gibbs energy, liquidus temperature, and solidus temperature under aligned calculation settings. In batch tests, Phase Lab achieved a 100% completion rate for 20,000 ternary calculations with an average runtime of 0.006933 s per task. For 9-component and 12-component calculations, Phase Lab achieved completion rates of 99.32% and 98.14%, respectively, with average runtimes of 1.122 and 2.19 s per task. Across the validation cases, the platform showed agreement with literature or experimental data for phase equilibria, diffusion and precipitation kinetics, transformation diagrams, thermophysical properties, solidification behavior, hot-cracking indicators, and mechanical properties. For Ni-based superalloys, the room-temperature yield-strength and ultimate-tensile-strength predictions gave R2 values of 0.858 and 0.824, respectively.
The present platform is most reliable within the alloy systems, databases, and model assumptions covered by the implemented thermodynamic, kinetic, mobility, and property descriptions. Its current validation is mainly focused on metallic systems, and extensions to non-metallic materials require suitable databases and further assessment. Some property predictions, especially creep rupture strength, conductivity, and mechanical properties involving detailed precipitate morphology or dislocation evolution, should currently be regarded as screening-level or model-dependent estimates rather than universal high-precision predictions.
Future work will focus on expanding database coverage, improving user-defined database support, adding uncertainty information to exported data products, and strengthening extensibility for customized property models. Further integration with DFT, MD, phase-field, and finite-element workflows would also allow Phase Lab to serve as a data-oriented bridge between CALPHAD calculations and broader multiscale alloy design.
DECLARATIONS
Acknowledgments
The authors thank Prof. Xiaogang Lu, Prof. Yong Du, Prof. Libin Liu, Prof. Jianyun Shen, Prof. Weisen Zheng, Prof. Weiwei Xu, Prof. Xiangxi Ye and Prof. Xiaoyu Chong for helpful discussions and support regarding algorithm optimization, thermodynamic database assessment and refinement, and model development.
Authors’ contributions
Conceived and designed the study; provided supervision and project administration; and wrote and revised the manuscript: Yan, L.; Liu, X.; Gong, K.; Wang, Y.
Developed the methodology and computational framework: Yan, L.; Chen, Y.; Wu, Q.; Dong, R.; Zhang, W.
Performed software development and code implementation: Chen, Y.; Yan, L.
Optimized databases and curated thermodynamic and mobility data: Wu, Q.; Dong, R.; Zhang, W.
Collected, organized, and analyzed the validation datasets: Yan, L.; Dong, R.
All authors read and approved the final manuscript.
Availability of data and materials
A representative export example (results and metadata) is available from the corresponding authors upon request. Phase Lab is accessible at https://cloud.hzwtech.com/phase-lab. Please note that access may require account registration and is subject to licensing and user permissions.
AI and AI-assisted tools statement
During the preparation of this manuscript, the AI tool GPT-5.4 and Gemini 3.1 were used solely for language editing. These tools did not influence the study design, data collection, analysis, interpretation, or the scientific content of the work. All authors take full responsibility for the accuracy, integrity, and final content of the manuscript.
Financial support and sponsorship
None.
Conflicts of interest
Liu, X. is the Executive Editor-in-Chief of the journal Journal of Materials Informatics, but was not involved in any steps of editorial processing, notably including reviewer selection, manuscript handling, and decision making. Yan, L.; Wu, Q.; Chen, Y.; Dong, R.; Zhang, W.; Gong, K.; Wang, Y. are affiliated with Hongzhiwei Technology (Shanghai) Co., Ltd.
Ethical approval and consent to participate
Not applicable.
Consent for publication
Not applicable.
Copyright
© The Author(s) 2026.
REFERENCES
1. Li, X.; Zheng, M.; Pan, H.; Mao, C.; Ding, W. An integrated design of novel RAFM steels with targeted microstructures and tensile properties using machine learning and CALPHAD. J. Mater. Inf. 2024, 4, 27.
2. Tang, Y. T.; Panwisawas, C.; Ghoussoub, J. N.; et al. Alloys-by-design: application to new superalloys for additive manufacturing. Acta. Mater. 2021, 202, 417-36.
3. Alabort, E.; Barba, D.; Shagiev, M.; et al. Alloys-by-design: application to titanium alloys for optimal superplasticity. Acta. Mater. 2019, 178, 275-87.
4. Yang, Q.; Wang, Z.; Xiao, X.; Xie, J. CALPHAD-assisted composition and processing design of high-strength and high-conductivity copper alloy. Mater. Sci. Eng. A. 2023, 881, 145432.
5. Shen, C. The synergy of machine learning and CALPHAD: revitalizing traditional approaches. Comput. Mater. Sci. 2025, 258, 113970.
6. Li, X.; Chen, X. Data‐driven discovery of new eutectic high‐entropy alloys via calculation of phase diagrams and machine learning integration. Adv. Eng. Mater. 2025, 27, 2500879.
7. He, L.; Wang, C.; Zhang, M.; Li, J.; Chen, T.; Zhou, X. Design of BCC/FCC dual-solid solution refractory high-entropy alloys through CALPHAD, machine learning and experimental methods. npj. Comput. Mater. 2025, 11, 105.
8. Sheikh, S.; Vela, B.; Honarmandi, P.; et al. High-throughput alloy and process design for metal additive manufacturing. npj. Comput. Mater. 2025, 11, 179.
9. Wall, A.; Benoit, M. J. A review of existing solidification crack tests and analysis of their transferability to additive manufacturing. J. Mater. Process. Technol. 2023, 320, 118090.
10. Balluffi, R. W.; Mehl, R. F. Grain boundary diffusion mechanisms in metals. Metall. Trans. A. 1982, 13, 2069-95.
11. Sheikh, S.; Vela, B.; Attari, V.; et al. Exploring chemistry and additive manufacturing design spaces: a perspective on computationally-guided design of printable alloys. Mater. Res. Lett. 2024, 12, 235-63.
12. Mu, Y.; Zhang, X.; Chen, Z. Modeling of crack susceptibility of Ni-based superalloy for additive manufacturing via thermodynamic calculation and machine learning. Acta. Metall. Sin. 2023, 59, 1075-86.
13. Peachey D, He Y, Zhang P, et al. ABD-1000AM: a highly processible superalloy for additive manufacturing, computationally designed for 1000 °C applications. In AM-EPRI 2024, Indian Wells, USA, 2024; pp. 861-72.
14. Wang, J.; Kwon, H.; Oh, S.; Kim, H. S.; Lee, B. Interpretable and physics-informed modeling of solidification in alloy systems: a generalized framework for multi-component prediction. Acta. Mater. 2025, 286, 120716.
15. Lou, M.; Xu, K.; Chen, L.; et al. Development of robust surfaces for harsh service environments from the perspective of phase formation and transformation. J. Mater. Inf. 2021, 1, 5.
16. Szymanski, N. J.; Rendy, B.; Fei, Y.; et al. An autonomous laboratory for the accelerated synthesis of novel materials. Nature 2023, 624, 86-91.
17. Merchant, A.; Batzner, S.; Schoenholz, S. S.; Aykol, M.; Cheon, G.; Cubuk, E. D. Scaling deep learning for materials discovery. Nature 2023, 624, 80-5.
18. Zhu, S.; Sarıtürk, D.; Arróyave, R. Accelerating CALPHAD-based phase diagram predictions in complex alloys using universal machine learning potentials: opportunities and challenges. Acta. Mater. 2025, 286, 120747.
19. Andersson, J. O.; Helander, T.; Höglund, L.; Shi, P.; Sundman, B. Thermo-Calc & DICTRA, computational tools for materials science. Calphad 2002, 26, 273-312.
20. Chen, S.; Daniel, S.; Zhang, F.; et al. The PANDAT software package and its applications. Calphad 2002, 26, 175-88.
21. Saunders, N.; Guo, U. K. Z.; Li, X.; Miodownik, A. P.; Schillé, J. Using JMatPro to model materials properties and behavior. JOM 2003, 55, 60-5.
22. Lukas, H.; Fries, S. G.; Sundman, B. Computational thermodynamics: the Calphad method. Cambridge University Press: Cambridge, 2007. https://dl.acm.org/doi/10.5555/1537219. (accessed 2026-05-26).
24. Sundman, B.; Chen, Q.; Du, Y. A review of Calphad modeling of ordered phases. J. Phase. Equilib. Diffus. 2018, 39, 678-93.
25. Sundman, B.; Lu, X.; Ohtani, H. The implementation of an algorithm to calculate thermodynamic equilibria for multi-component systems with non-ideal phases in a free software. Comput. Mater. Sci. 2015, 101, 127-37.
26. Schmid, R.; Chang, Y. A thermodynamic study on an associated solution model for liquid alloys. Calphad 1985, 9, 363-82.
27. Campbell, C.; Boettinger, W.; Kattner, U. Development of a diffusion mobility database for Ni-base superalloys. Acta. Mater. 2002, 50, 775-92.
28. Ury, N.; Neuberger, R.; Sargent, N.; Xiong, W.; Arróyave, R.; Otis, R. Kawin: an open source Kampmann–Wagner Numerical (KWN) phase precipitation and coarsening model. Acta. Mater. 2023, 255, 118988.
29. Gulliver, G. H. The quantitative effect of rapid cooling upon the constitution of binary alloys. J. Inst. Met. 1915, 13, 120-57.
30. Chen, Q.; Sundman, B. Computation of partial equilibrium solidification with complete interstitial and negligible substitutional solute back diffusion. Mater. Trans. 2002, 43, 551-9.
31. Wahlmann, B.; Leidel, D.; Markl, M.; Körner, C. Numerical alloy development for additive manufacturing towards reduced cracking susceptibility. Crystals 2021, 11, 902.
32. Lu, X.; Selleby, M.; Sundman, B. Assessments of molar volume and thermal expansion for selected bcc, fcc and hcp metallic elements. Calphad 2005, 29, 68-89.
33. Zhu, N.; Liu, W.; Wang, Z.; Lu, X. Modeling of molar volume for the Ni–Al γ/γ′ binary phases within the framework of CALPHAD method. Calphad 2020, 71, 101792.
34. Sichen, D.; Bygd’en, J.; Seetharaman, S. A model for estimation of viscosities of complex metallic and ionic melts. Metall. Mater. Trans. B. 1994, 25, 519-25.
35. Schick, M.; Brillo, J.; Egry, I.; Hallstedt, B. Viscosity of Al–Cu liquid alloys: measurement and thermodynamic description. J. Mater. Sci. 2012, 47, 8145-52.
36. Ho, C. Y.; Ackerman, M. W.; Wu, K. Y.; Oh, S. G.; Havill, T. N. Thermal conductivity of ten selected binary alloy systems. J. Phys. Chem. Ref. Data. 1978, 7, 959-1178.
37. Du, B.; Tan, J.; Wu, Q.; Wen, S.; Liu, Y.; Du, Y. Assessment of thermal conductivity for FCC Al-X (X=Zn, Mg) and Al-Zn-Mg alloys: experiments and modeling. Calphad 2024, 87, 102763.
38. Bochvar, N. R.; Vigdorovich, V. N.; Leonova, N. P.; Lysova, E. V. Electrical resistivity of alloys in the systems Cu–Mn–Ge, Cu–Mn–Sn, and Cu–Ge–Sn. Met. Sci. Heat. Treat. 1984, 26, 175-8.
39. Gypen, L. A.; Deruyttere, A. Multi-component solid solution hardening: Part 2 Agreement with experimental results. J. Mater. Sci. 1977, 12, 1034-8.
41. Cao, W.; Zhang, F.; Chen, S.; et al. Precipitation modeling of multi-component nickel-based alloys. J. Phase. Equilib. Diffus. 2016, 37, 491-502.
42. Hall, E. O. The deformation and ageing of mild steel: III discussion of results. Proc. Phys. Soc. B. 1951, 64, 747.
43. Chen, S. L.; Chou, K. C.; Chang, Y. A. On a new strategy for phase diagram calculation 1. Basic principles. Calphad 1993, 17, 237-50.
44. Chen, S. L.; Chou, K. C.; Chang, Y. On a new strategy for phase diagram calculation 2. Binary systems. Calphad 1993, 17, 287-302.
45. Sundman, B.; Dupin, N.; Hallstedt, B. Algorithms useful for calculating multi-component equilibria, phase diagrams and other kinds of diagrams. Calphad 2021, 75, 102330.
46. Liu, X. L.; Lindwall, G.; Gheno, T.; Liu, Z. Thermodynamic modeling of Al–Co–Cr, Al–Co–Ni, Co–Cr–Ni ternary systems towards a description for Al–Co–Cr–Ni. Calphad 2016, 52, 125-42.
47. Wang, Y.; Cacciamani, G. Experimental investigation and thermodynamic assessment of the Al-Co-Ni system. Calphad 2018, 61, 198-210.
48. Chen, H.; Chen, Q.; Engström, A. Development and applications of the TCAL aluminum alloy database. Calphad 2018, 62, 154-71.
49. Lee, B. A thermodynamic evaluation of the Fe-Cr-Mn-C system. Metall. Trans. A. 1993, 24, 1017-25.
50. Liu, M.; Zhang, L.; Chen, W.; Xin, J.; Du, Y.; Xu, H. Diffusivities and atomic mobilities in fcc_A1 Ni–X (X=Ge, Ti and V) alloys. Calphad 2013, 41, 108-18.
51. Liu, F.; Wang, Z.; Wang, Z.; et al. High-throughput determination of interdiffusivity matrices in Ni-Al-Ti-Cr-Co-Mo-Ta-W multicomponent superalloys and their application in optimization of creep resistance. Mater. Today. Commun. 2020, 24, 101018.
52. Saunders, N.; Guo, Z.; Li, X.; Miodownik, A. P.; Schillé, J. P. The calculation of TTT and CCT diagrams for general steels. 2004. https://www.researchgate.net/publication/242271477_The_Calculation_of_TTT_and_CCT_diagrams_for_General_Steels. (accessed 2026-05-26).
53. American Society for Metals. Atlas of isothermal transformation and cooling transformation diagrams. 1977. https://www.scribd.com/document/572302665/ATLAS-OF-ISOTHERMAL-TRANSFORMATION-AND-COOLING-TRANSFORMATION-DIAGRAMS-compressed. (accessed 2026-05-26).
54. British Iron And Steel Research Association Metallurgy (General) Division. Atlas of isothermal transformation diagrams of B.S. En Steels. 2nd ed.; Iron and Steel Institute: London, 1949. https://books.google.com/books/about/Atlas_of_Isothermal_Transformation_Diagr.html?id=UeTJCnjaMRIC. (accessed 2026-05-26).
55. Fang, X.; Li, Y.; Zheng, Q.; et al. Theoretical prediction of structural, mechanical, and thermophysical properties of the precipitates in 2xxx series aluminum alloy. Metals 2022, 12, 2178.
56. Feng, X.; Liang, F. Measurement and analysis of molten Ni-Co-Al alloy density. J. Mater. Sci. Technol. 2003, 19, 388-90. https://www.jmst.org/CN/abstract/abstract6501.shtml. (accessed 2026-05-26).
57. Sato, Y. Representation of the viscosity of molten alloy as a function of the composition and temperature. Jpn. J. Appl. Phys. 2011, 50, 11RD01.
58. Zhou, K.; Wang, H. P.; Chang, J.; Wei, B. Surface tension measurement of metastable liquid Ti–Al–Nb alloys. Appl. Phys. A. 2011, 105, 211-4.
59. Otter, F. A. Thermoelectric power and electrical resistivity of dilute alloys of Mn, Pd, and Pt in Cu, Ag, and Au. J. Appl. Phys. 1956, 27, 197-200.
60. Yang, L.; Yang, J.; Han, F.; et al. Hot cracking susceptibility prediction from quantitative multi-phase field simulations with grain boundary effects. Acta. Mater. 2023, 250, 118821.
61. Koshikawa, T.; Gandin, C.; Bellet, M.; Yamamura, H.; Bobadilla, M. Computation of phase transformation paths in steels by a combination of the partial- and para-equilibrium thermodynamic approximations. ISIJ. Int. 2014, 54, 1274-82.
62. Zheng, L.; Gu, C.; Zheng, Y. Investigation of the solidification behavior of a new Ru-containing cast Ni-base superalloy with high W content. Scr. Mater. 2004, 50, 435-9.
63. Chen, Y.; Lu, F.; Zhang, K.; et al. Dendritic microstructure and hot cracking of laser additive manufactured Inconel 718 under improved base cooling. J. Alloys. Compd. 2016, 670, 312-21.
64. Tian, J.; Song, A.; Chen, S.; Liu, C.; Ye, X. Weldability of GH3539 superalloy: unraveling the dueling roles of Zr, C, and Si in solidification crack formation and healing. J. Mater. Res. Technol. 2025, 39, 4561-75.
65. Cloots, M.; Uggowitzer, P. J.; Wegener, K. Investigations on the microstructure and crack formation of IN738LC samples processed by selective laser melting using Gaussian and doughnut profiles. Mater. Design. 2016, 89, 770-84.
66. Zhang, X.; Chen, H.; Xu, L.; Xu, J.; Ren, X.; Chen, X. Cracking mechanism and susceptibility of laser melting deposited Inconel 738 superalloy. Mater. Design. 2019, 183, 108105.
67. Hariharan, A.; Lu, L.; Risse, J.; et al. Misorientation-dependent solute enrichment at interfaces and its contribution to defect formation mechanisms during laser additive manufacturing of superalloys. Phys. Rev. Mater. 2019, 3, 123602.
68. Ogawa, Y.; Noguchi, K.; Takakuwa, O. Criteria for hydrogen-assisted crack initiation in Ni-based superalloy 718. Acta. Mater. 2022, 229, 117789.
69. Qi, H.; Azer, M.; Ritter, A. Studies of standard heat treatment effects on microstructure and mechanical properties of laser net shape manufactured INCONEL 718. Metall. Mater. Trans. A. 2009, 40, 2410-22.
70. Chen, Y.; Zhang, K.; Huang, J.; Hosseini, S. R. E.; Li, Z. Characterization of heat affected zone liquation cracking in laser additive manufacturing of Inconel 718. Mater. Design. 2016, 90, 586-94.
71. Johnson, L.; Mahmoudi, M.; Zhang, B.; et al. Assessing printability maps in additive manufacturing of metal alloys. Acta. Mater. 2019, 176, 199-210.
72. Special Metals. https://www.specialmetals.com/. (accessed 2026-05-26).
73. Davis, J. R. Metals Handbook Desk Edition. 2nd Edition. ASM International; 1998. https://books.google.com/books/about/Metals_Handbook_Desk_Edition_2nd_Edition.html?id=IpEnvBtSfPQC. (accessed 2026-05-26).
Cite This Article
 Open Access
How to Cite
Download Citation
Export Citation File:
Type of Import
Tips on Downloading Citation
Citation Manager File Format
Type of Import
Direct Import: When the Direct Import option is selected (the default state), a dialogue box will give you the option to Save or Open the downloaded citation data. Choosing Open will either launch your citation manager or give you a choice of applications with which to use the metadata. The Save option saves the file locally for later use.
Indirect Import: When the Indirect Import option is selected, the metadata is displayed and may be copied and pasted as needed.
About This Article
Copyright

Data & Comments
Data
0










Comments
Comments must be written in English. Spam, offensive content, impersonation, and private information will not be permitted. If any comment is reported and identified as inappropriate content by OAE staff, the comment will be removed without notice. If you have any queries or need any help, please contact us at [email protected].