


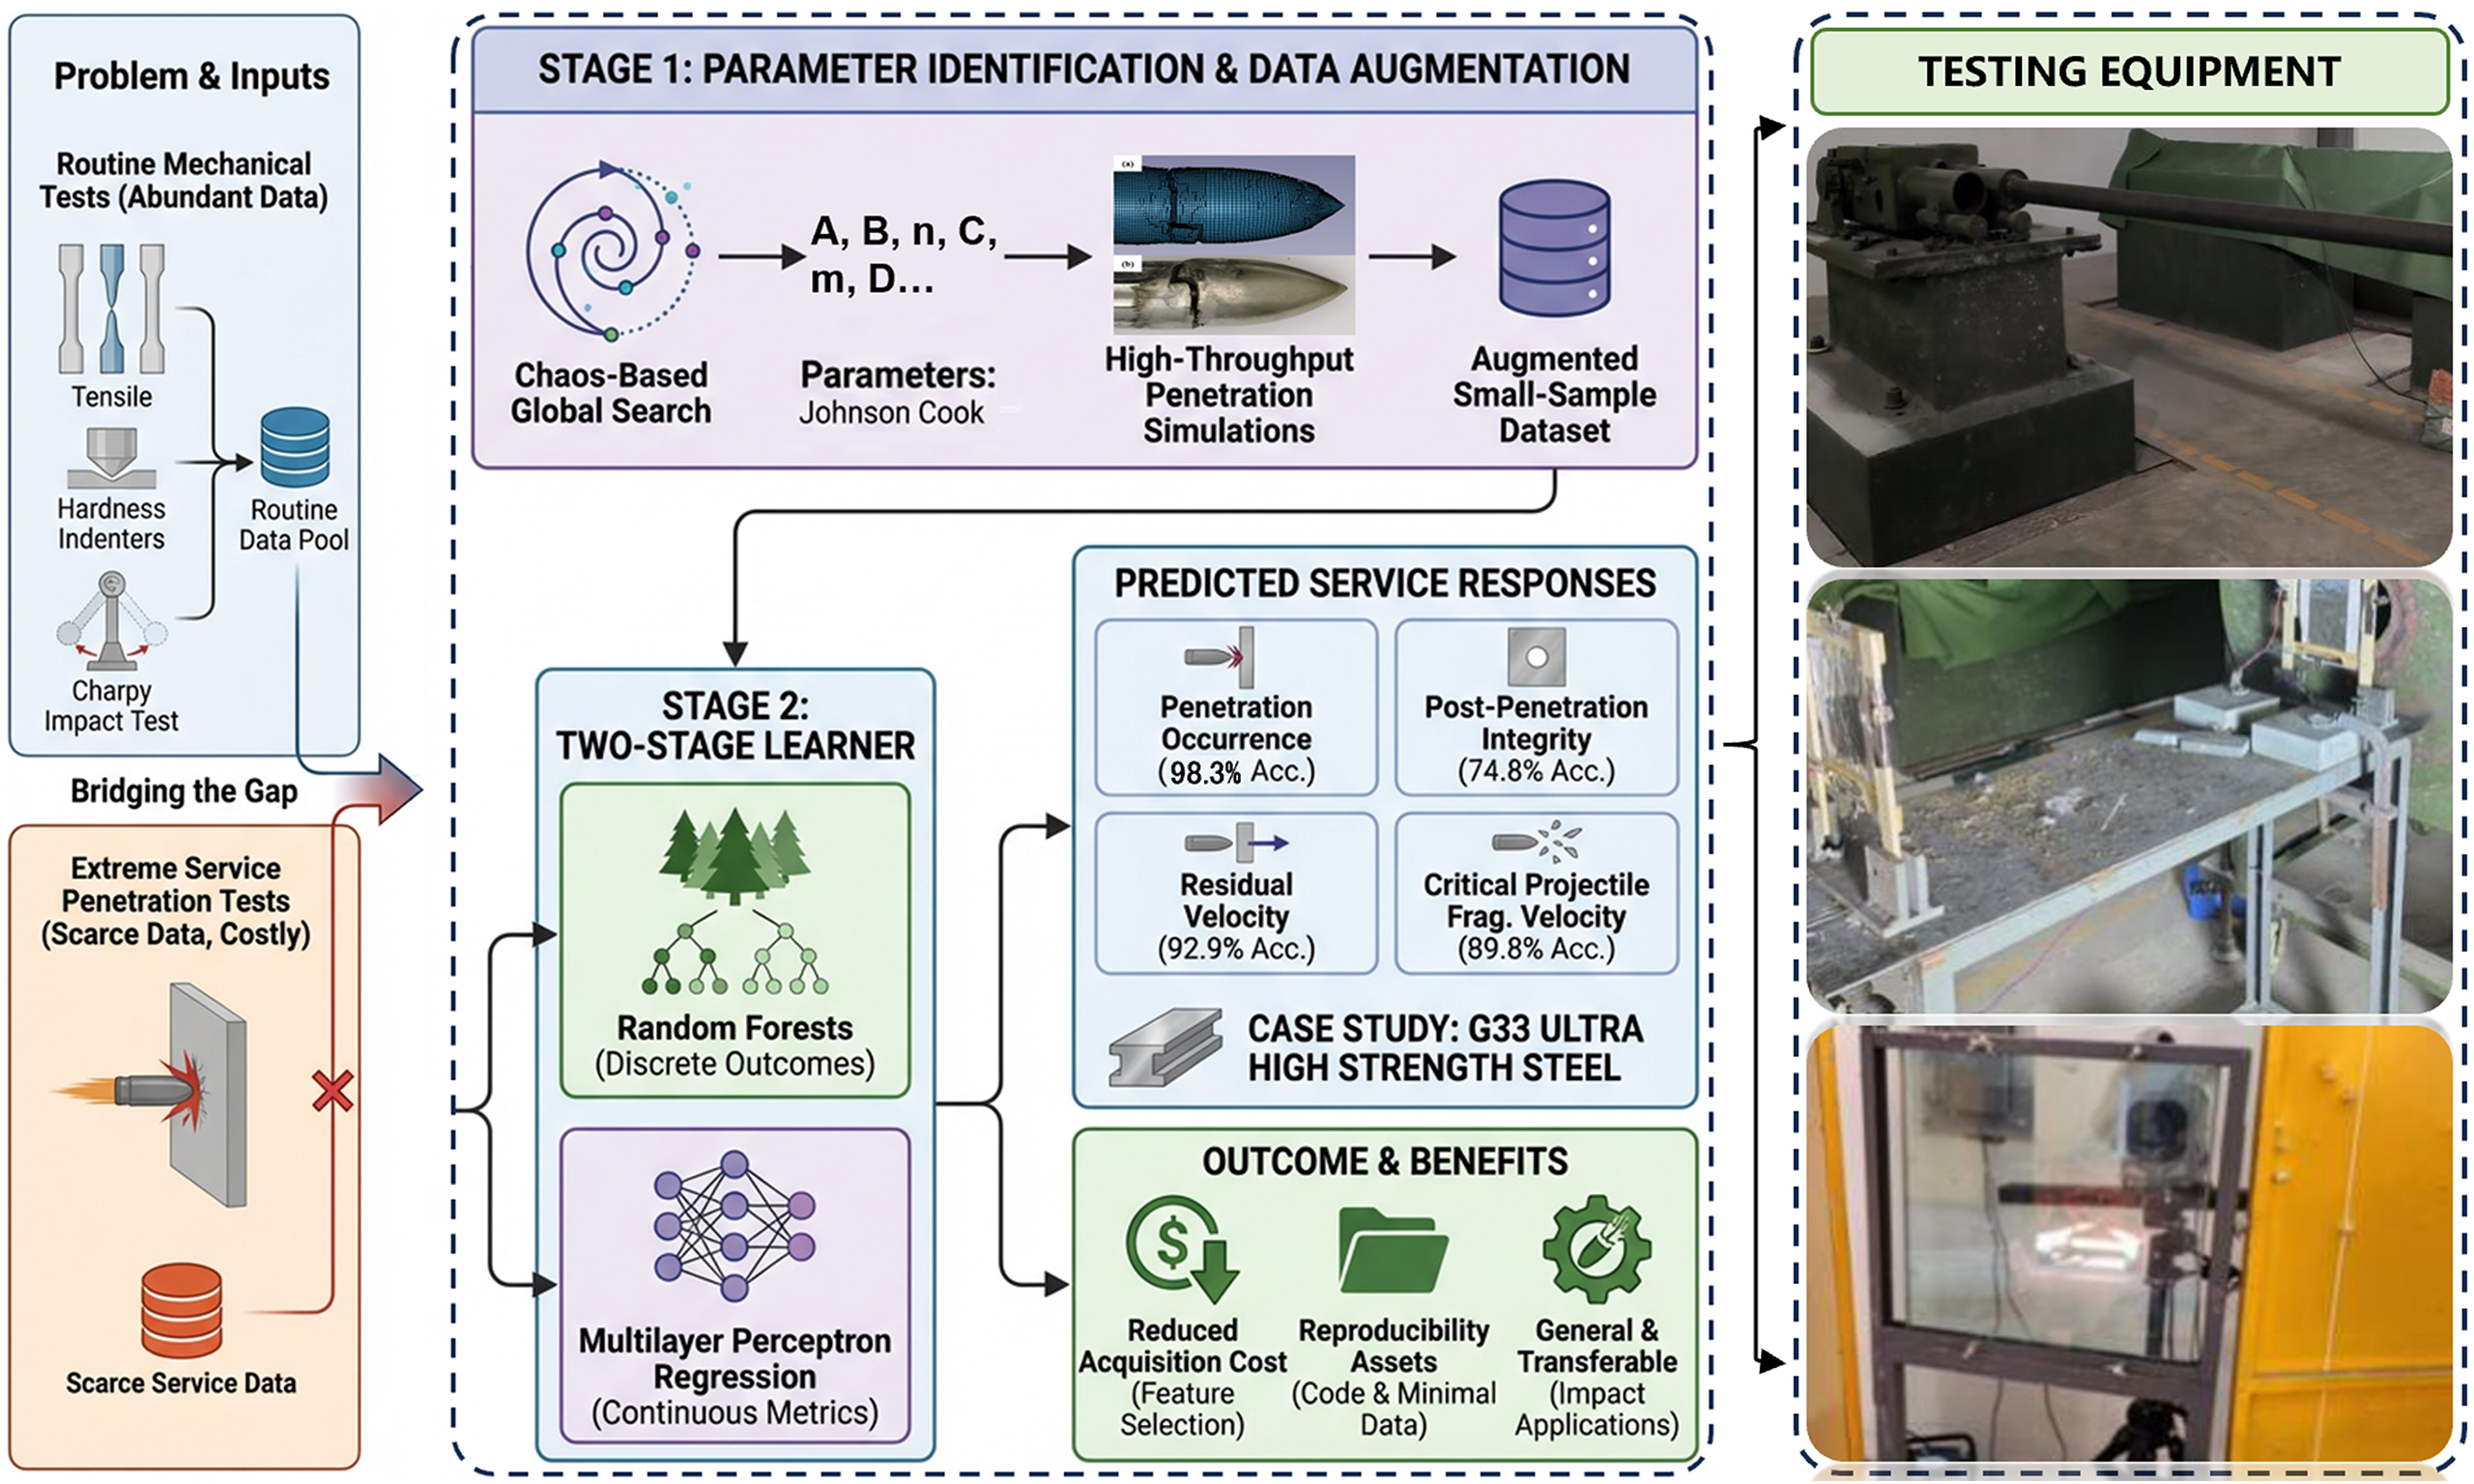
Simulation-augmented learning for ballistic performance prediction of ultra-high-strength steel
 0
0 Abstract
Direct measurement of ballistic service performance in extreme-service materials is costly and data-limited because penetration testing requires specialized facilities and yields only a small number of valid observations. This limitation makes it difficult to establish reliable links between routine mechanical properties and terminal ballistic responses. To address this gap, we propose a simulation-augmented two-stage learning framework that maps standard mechanical-test results to service-level ballistic responses under small-sample conditions. The framework first identifies the Johnson-Cook (JC) constitutive and failure parameters, together with a pressure-cutoff criterion, from limited experiments using chaos-based global optimization. The identified parameters are then used to perform high-throughput penetration simulations, thereby augmenting the scarce experimental service data. The augmented dataset is processed using a two-stage learner, in which random forests classify discrete outcomes and a multilayer perceptron regression predicts continuous metrics. In a case study of G33 ultra-high-strength steel, the optimized feature-selected model achieved cross-validated prediction accuracies of 98.3%, 74.8%, 92.9%, and 89.8% for penetration occurrence, post-penetration projectile integrity, residual velocity, and critical projectile fragmentation velocity, respectively. The proposed framework provides a transferable strategy for ballistic performance prediction in other impact-dominated material systems with limited service data.
Keywords
INTRODUCTION
Ultra-high-strength steels, which optimally balance high strength with adequate toughness, are essential for critical components subjected to extreme stresses. This exceptional profile has driven its widespread use in heavy industries. In the aerospace industry, these steels are critical constituents of high-load elements such as landing gears, main wing beams, and horizontal stabilizer spars[1-3]. Similarly, the automotive sector utilizes these steels in car frames, crash beams, and A- and B-pillars to deliver cost-effective safety and durability[4-6]. Driven by increasingly stringent engineering demands, the steel industry has continuously developed innovative ultra-high-strength steels[7,8]. An example is G33 ultra-high-strength steel, which integrates bainitic and martensitic design principles to achieve an excellent balance of strength and toughness at a reduced cost. However, because its properties are highly sensitive to heat, it is critical to quantify the extent to which specific processing routes dictate the mechanical and service behaviors. Consequently, a pressing need exists for rapid and cost-effective methods to evaluate the terminal performance of advanced steels[9,10].
In the digital era, material genome engineering has emerged as a primary driver of data-driven materials research. The launch of the Materials Genome Initiative in 2011 marked a major step toward data-centric strategies in materials science[11] and accelerated the adoption of big data and artificial intelligence in the field[12,13]. This paradigm relies on the systematic collection, analysis, and interpretation of large datasets of materials to support the optimization and evaluation of new materials. For example, Yang et al. reviewed recent progress in data-driven materials research from the perspectives of functional material design and guided synthesis, and highlighted common indicators and methods for property design and synthesis-route prediction[14]. Merayo et al. developed a large data-driven artificial neural network system to predict the physical and mechanical properties relevant to the selection of metallic materials[15]. Guo et al. proposed a machine-learning-based nonlinear programming approach for predicting multiple properties of steels from industrial big data[16]. Taken together, these studies demonstrate the growing potential of advanced data analytics in accelerating material design and performance prediction.
However, experimental constraints, technological limitations in characterization, and data complexity pose significant challenges to data acquisition. For instance, high-cost, complex experimental designs are necessary to obtain data on service performance attributes such as penetration ability and fatigue life[17]. These complications are exemplified by the efforts of researchers such as He et al., who developed complex geometries for high-speed penetrators, including detailed specifications of the total length, nose and rod sections, and various diameters. Data collection involved the use of high-speed cameras to measure the free-flight speed and impact behavior of these penetrators, all of which necessitated a substantial investment[18]. In studies conducted by Kılıç et al., ballistic tests on high-hardness armor plates using Secure 500 steel and 7.62 × 54 mm B32 API armor-piercing bullets were performed according to NATO Stanag 4569 level 3 standards. Their meticulous recordings of the bullet speed and target interactions using synchronized high-speed cameras and precise timers entailed intricate data collection processes and expensive equipment[19]. An additional example of the complexity and high costs of experimental designs is the work of Børvik et al., who conducted penetration tests on granular materials with various small-caliber bullets, totaling 126 experiments[20].
Attempts to lower the costs of complex and expensive experimental settings have resulted in the emergence of finite-element simulations as an efficient alternative that enables the rapid acquisition of material performance data through the precise simulation of actual test conditions. Nonetheless, the interplay of multiple simulation parameters and the accumulation of errors from testing and fitting pose significant obstacles to accurately determining simulation parameters. For example, Manes et al. combined experimental and simulation approaches using ABAQUS and LS-DYNA to study the penetration and perforation behaviors of aluminum plates of varying thicknesses. They focused on a multitude of simulation parameters such as different friction coefficients, impact speeds, and the characteristics of the projectile and target materials[21]. Zhu et al., who used the Johnson-Cook (JC) strength model to simulate the penetration performance of depleted uranium alloys, considered a variety of simulation parameters, including the equivalent stress, equivalent strain, strain rate, homologous temperature, material melting point, room temperature, yield stress, strain hardening coefficient, and temperature softening coefficient[22]. These efforts suggest that an investigation of the structure–performance relationship between the mechanical properties and service performance of G33 ultra-high-strength steel would require an efficient method for deriving the simulation parameters. A comprehensive dataset can be built by conducting batch parallel simulation calculations to support the data-driven predictions of the material performance.
This study aims to rapidly assess the service performance of metal by learning the nonlinear mapping from conventional mechanical properties (for example, the yield strength) to service behavior (for example, the penetration performance) using G33 ultra-high-strength steel as a case study. We prepared 134 microstructures using various heat-treatment methods and measured their mechanical properties at different temperatures and strain rates, which were then used to construct a comprehensive dataset comprising these properties. Subsequently, using limited penetration test data and techniques, such as chaotic optimization, we determined the key simulation parameters for all 134 variants, which made it possible to construct an extensive service performance dataset. Based on these data, we developed a two-stage prediction framework that uses random forests for discrete outcomes and multilayer perceptrons (MLPs) for continuous metrics. Unlike conventional single-stage models, which have difficulties accommodating sharp discontinuities at the ballistic limit, the proposed architecture separates the physical failure sequence into classification and regression tasks. The Stage-1 classifier defines the penetration boundary and the Stage-2 regressor predicts continuous responses only within the relevant regime. This physics-informed decomposition improves the predictive stability and provides practical guidance for process optimization and material selection.
MATERIALS AND METHODS
The methodological workflow consisted of four connected stages. The first stage generated a broad mechanical-property dataset from 134 heat-treated G33 steel variants. The second stage obtained limited but reliable service-performance data through scaled penetration experiments. The third stage identified the simulation parameters required for finite element penetration modeling and used the validated models to augment the service-performance dataset. The fourth stage used the paired mechanical and service-performance data to train the two-stage prediction framework. This organization avoids treating the experimental, simulation, and learning components as independent procedures and instead presents them as consecutive steps in a unified prediction pipeline.
Raw materials
The G33 ultra-high-strength steel is a low-cost, high-performance steel that can develop either martensitic or bainitic microstructures upon exposure to heat. Its chemical composition is presented in Table 1.
Composition range of G33 ultra-high-strength steel (wt%)
| GRADE | C | Cr | W | Ni | Si | Mn | Mo | V | Fe |
| G33 | 0.33 | 3.5 | 4 | 4 | 0.8 | 0.8 | 0.8 | 0.4 | bal. |
The measured phase transition temperatures are as follows: AC3 at 800 °C, AC1 at 644 °C, Ms at 250 °C, and Bs at 360 °C. These phase transition points were used as the basis for designing a “three upsetting and three drawing” process, which was implemented for the steel ingots. The specific steps are as follows:
(1) The initial forging temperature was set at 1,150 °C. The ingot was upset to half of its original height and then drawn back to its original height.
(2) The ingot was reheated to a temperature of 1,080 °C, upset again to half its height, and then drawn back to the original height.
(3) The ingot was reheated to 1,050 °C, upset to half its height for the last time, and then forged into rods measuring Ф15 × 1,000 mm.
Finally, the rods underwent annealing treatment at 680 °C to effectively relieve the internal stresses induced by the forging process.
A comprehensive range of G33 microstructures was captured for the training dataset by designing heat-treatment schedules that encompass the major bainitic and martensitic transformation pathways. Consequently, we selected specific combinations of the temperature and holding time. Adjustment of the cooling rate and tempering temperature enabled systematic control of the microstructural morphology and distribution, along with the size and dispersion of the precipitated carbides. These microstructural changes strongly influence the toughness, hardness, corrosion resistance, and overall mechanical response of the steel.
Bainitic ultra-high-strength steel was produced via a newly designed two-step heat treatment route consisting of austenitization and isothermal quenching, the latter of which was performed in a salt bath containing 50 wt.% of NaNO3 and KNO3. Austenitization was accomplished by increasing the temperature in the range from 900 to 1,100 °C in increments of 100 °C. Because the temperature and holding time of isothermal quenching strongly affect the resulting microstructure, upper bainite was targeted at 345 and
Martensitic ultra-high-strength steel was produced by adopting a heat-treatment route with up to four stages - austenitization, quenching, cryogenic treatment, and tempering. Austenitization was conducted from 700 to 1,100 °C in increments of 50 °C to systematically examine its effect on the microstructural evolution. Water, oil, and air-cooling were used to compare the different quenching conditions. Some schedules also included cryogenic treatment at -73 °C for 1 h to evaluate the effect thereof on the phase morphology and distribution. Tempering was performed over low- (150-200 °C), medium- (200-400 °C), and high-temperature (400-700 °C) ranges with holding times of 2, 4, and 5 h, respectively. Some routes included double tempering to broaden the range of tempering strategies and resulting microstructures. Overall, the martensitic route involved as many as 12 key process parameters and 115 different processing schedules. In addition, nine conventional annealing treatments commonly used for other metallic materials were included for comparison with the pearlitic structures obtained under these conditions.
In total, 134 heat treatment schedules were designed and implemented, which yielded nearly 3 t of test material. Details of the heat-treatment design and the expected primary microstructures are provided in Supplementary Table 1.
Mechanical property dataset derived from experiments
The mechanical properties that were used to construct the training dataset were acquired directly through experimental testing and comprise 13 basic mechanical properties. The specific parameters are detailed in Supplementary Table 2.
(1) Quasi-static compression and tensile tests were performed at room temperature
Quasi-static compression and tensile tests were performed on the 134 steel variants using an INSTRON 5985 universal testing machine. Testing adhered to GB/T 7314-2017 and GB/T 228.1-2010 standards at a strain rate of 1 × 10⁻³ s-1. Compression specimens measured Φ6 mm × 9 mm, and tensile specimens had a gauge section of Φ5 mm × 30 mm. Each test was repeated at least three times to obtain quasi-static stress-strain curves at room temperature.
(2) Dynamic compression and tensile tests at room temperature
Dynamic compression and tensile tests were conducted using split Hopkinson pressure and tension bar systems in compliance with the GJB 8374-2015 and GB/T 34108-2017 standards. The dynamic compression tests were conducted with strain rates of 3,000 and 5,000 s-1, using samples sized Φ5 mm × 5 mm. The dynamic tensile tests were carried out at a strain rate of 2,000 s-1, with sample gauge lengths of Φ2 mm ×
(3) Vickers hardness tests
The Vickers hardness values of the 134 steel variants were measured using a Wolpert 450SVD tester in the same laboratory. These tests were conducted under a 5 kg load, following the standard GB/T 4340.1-2009. Each material was tested 10 times, and the average Vickers hardness value was used as the final result.
In total, we standardized and collected 1,072 stress–strain curves across various loading conditions. The tests produced 1,742 measurements of the mechanical properties of G33 steel under different heat treatment conditions. These measurements were then visualized, analyzed, and used to construct the dataset. As shown in Figure 1, the resulting dataset spans a broad numerical range, shows a well-distributed variation, and has a high overall quality. These mechanical property measurements formed the input feature space for subsequent service-performance prediction.
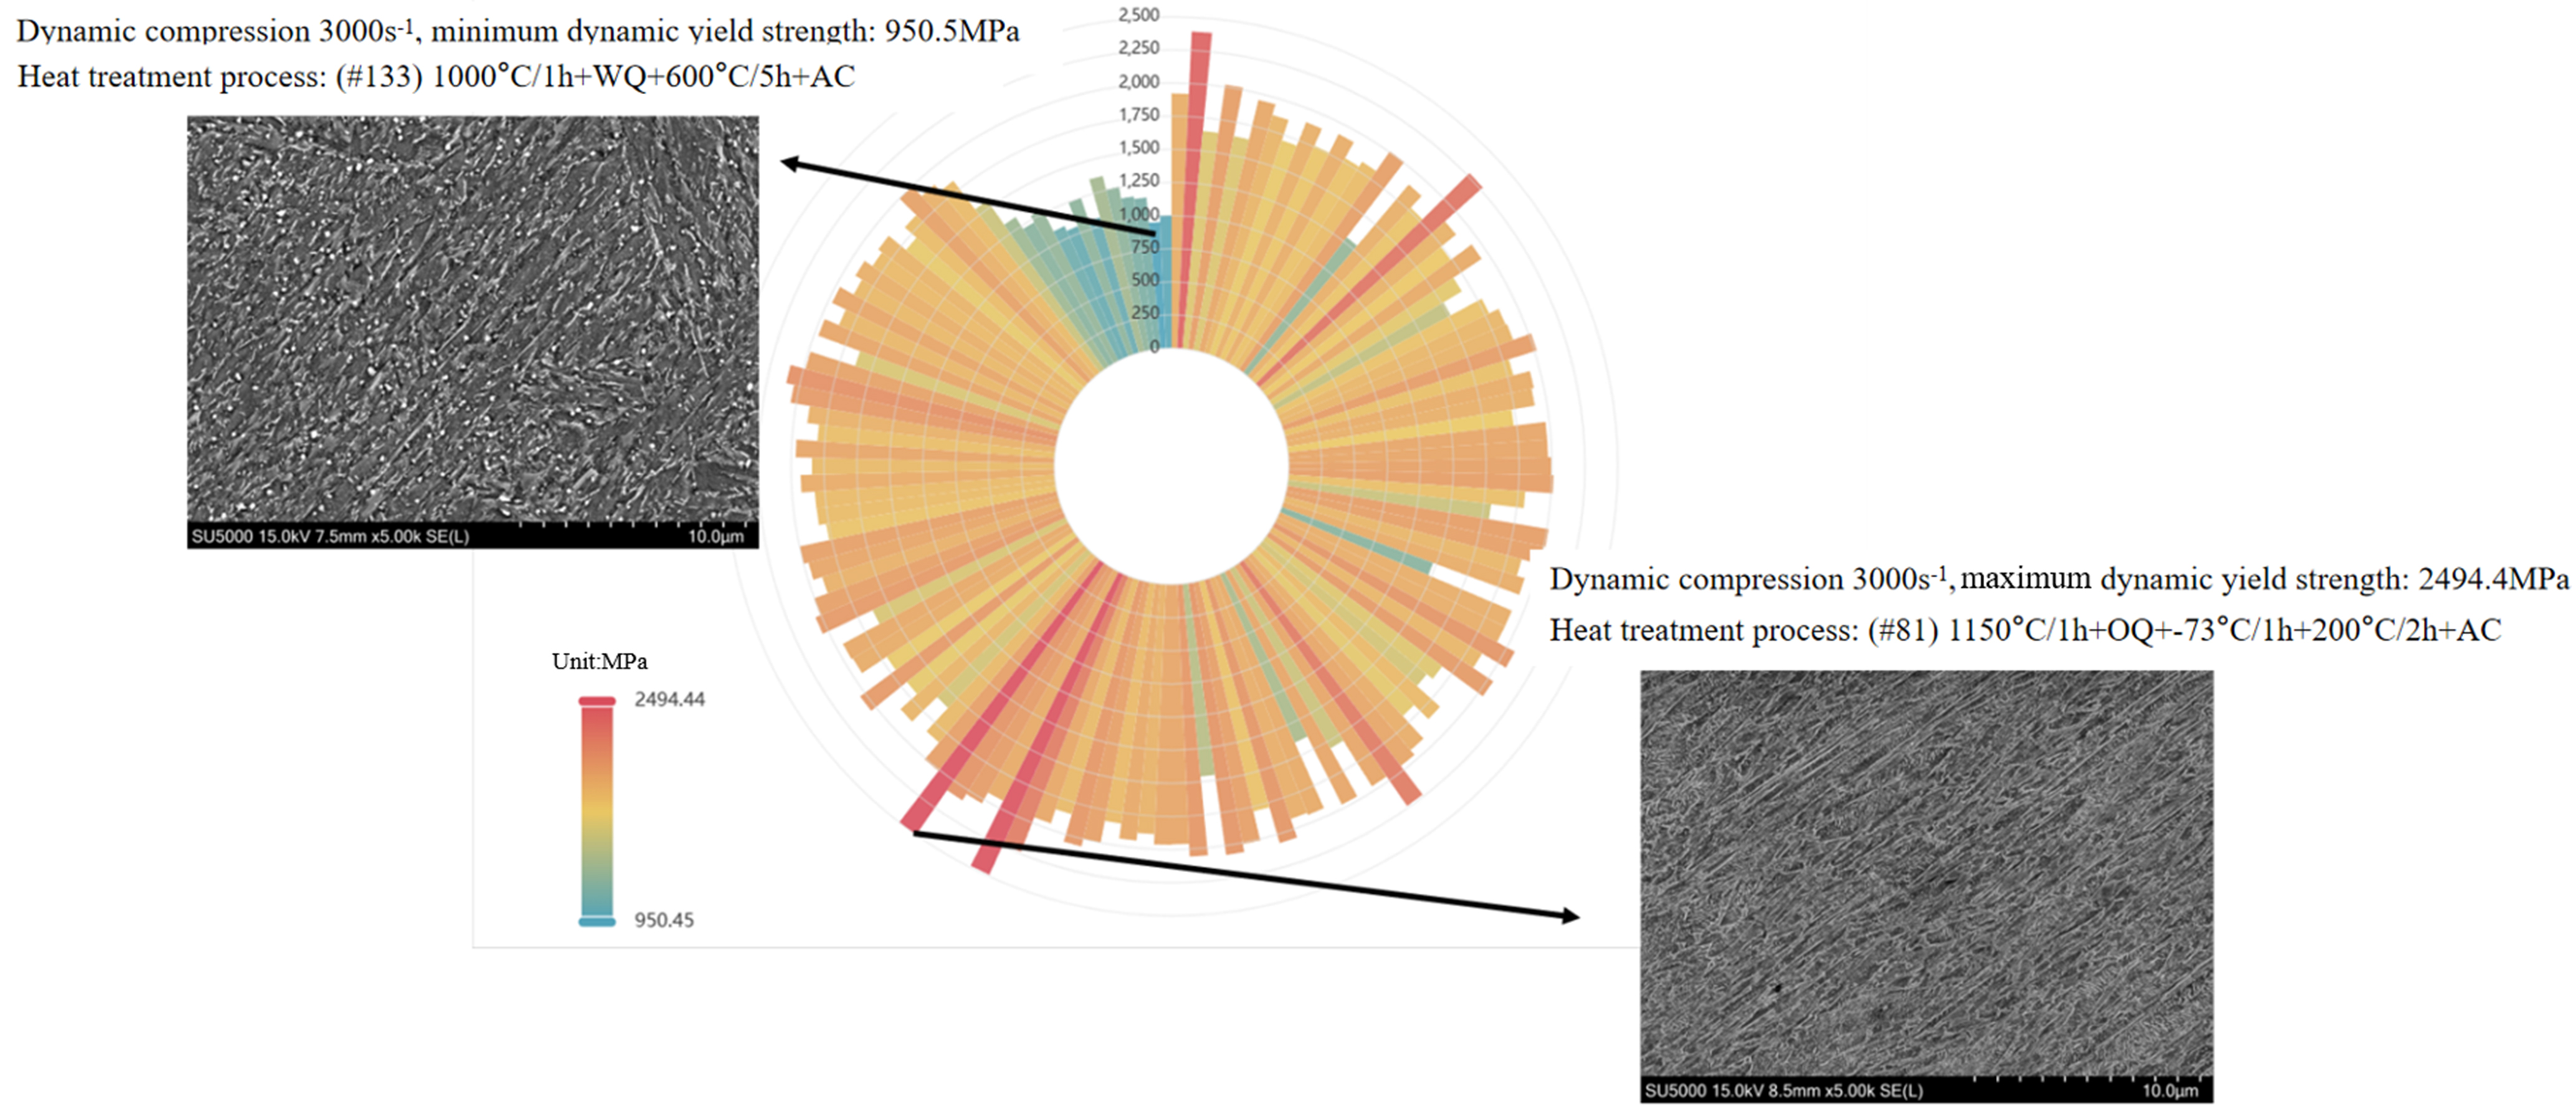
Figure 1. G33 dataset overview: radial map of dynamic yield strength (3,000 s-1) and SEMs of the lowest and highest specimens. SEMs: Scanning electron microscope images.
Service performance dataset generated via high-efficiency simulations
After establishing the mechanical property dataset, the next step was to obtain the corresponding service-performance labels. Because direct penetration testing for all 134 steel variants would be prohibitively expensive, a combined experimental–simulation strategy was adopted. G33 ultra-high-strength steel is primarily used in supersonic kinetic-energy penetrators operating at Mach 2-3; therefore, its service-performance evaluation is centered on penetration efficiency. For deep-penetration applications, two criteria are particularly important: whether the projectile maintains structural integrity after impact and whether it can retain sufficient penetration capability to reach the specified target depth. The essential service-performance parameters used for these evaluations are listed in Supplementary Table 3.
Scaled penetration experiment using simulated projectiles
The penetration performance of G33 steel was evaluated cost-effectively by performing scaled projectile penetration tests, considering that scaled models can reproduce the key penetration dynamics of actual projectiles at significantly lower costs. These tests also allow repeated testing under controlled conditions, which accelerates service data collection and supports the rapid optimization of both the structure and material.
Among the 134 steel variants, 30 representative samples were selected to cover a broad range of heat-treatment routes and microstructural states. For each category, at least one subgroup was selected to highlight steels with distinctly different performance characteristics to provide a comprehensive evaluation of the behavior of G33 steel under high-speed impact conditions. High-speed photographs of the projectile penetration process are presented in Figure 2A, where each sample underwent a minimum of three tests at different penetration speeds. A total of 95 penetration tests were completed. Figure 2B shows a selection of recovered targets and scaled simulated projectiles to illustrate the experimental outcomes.
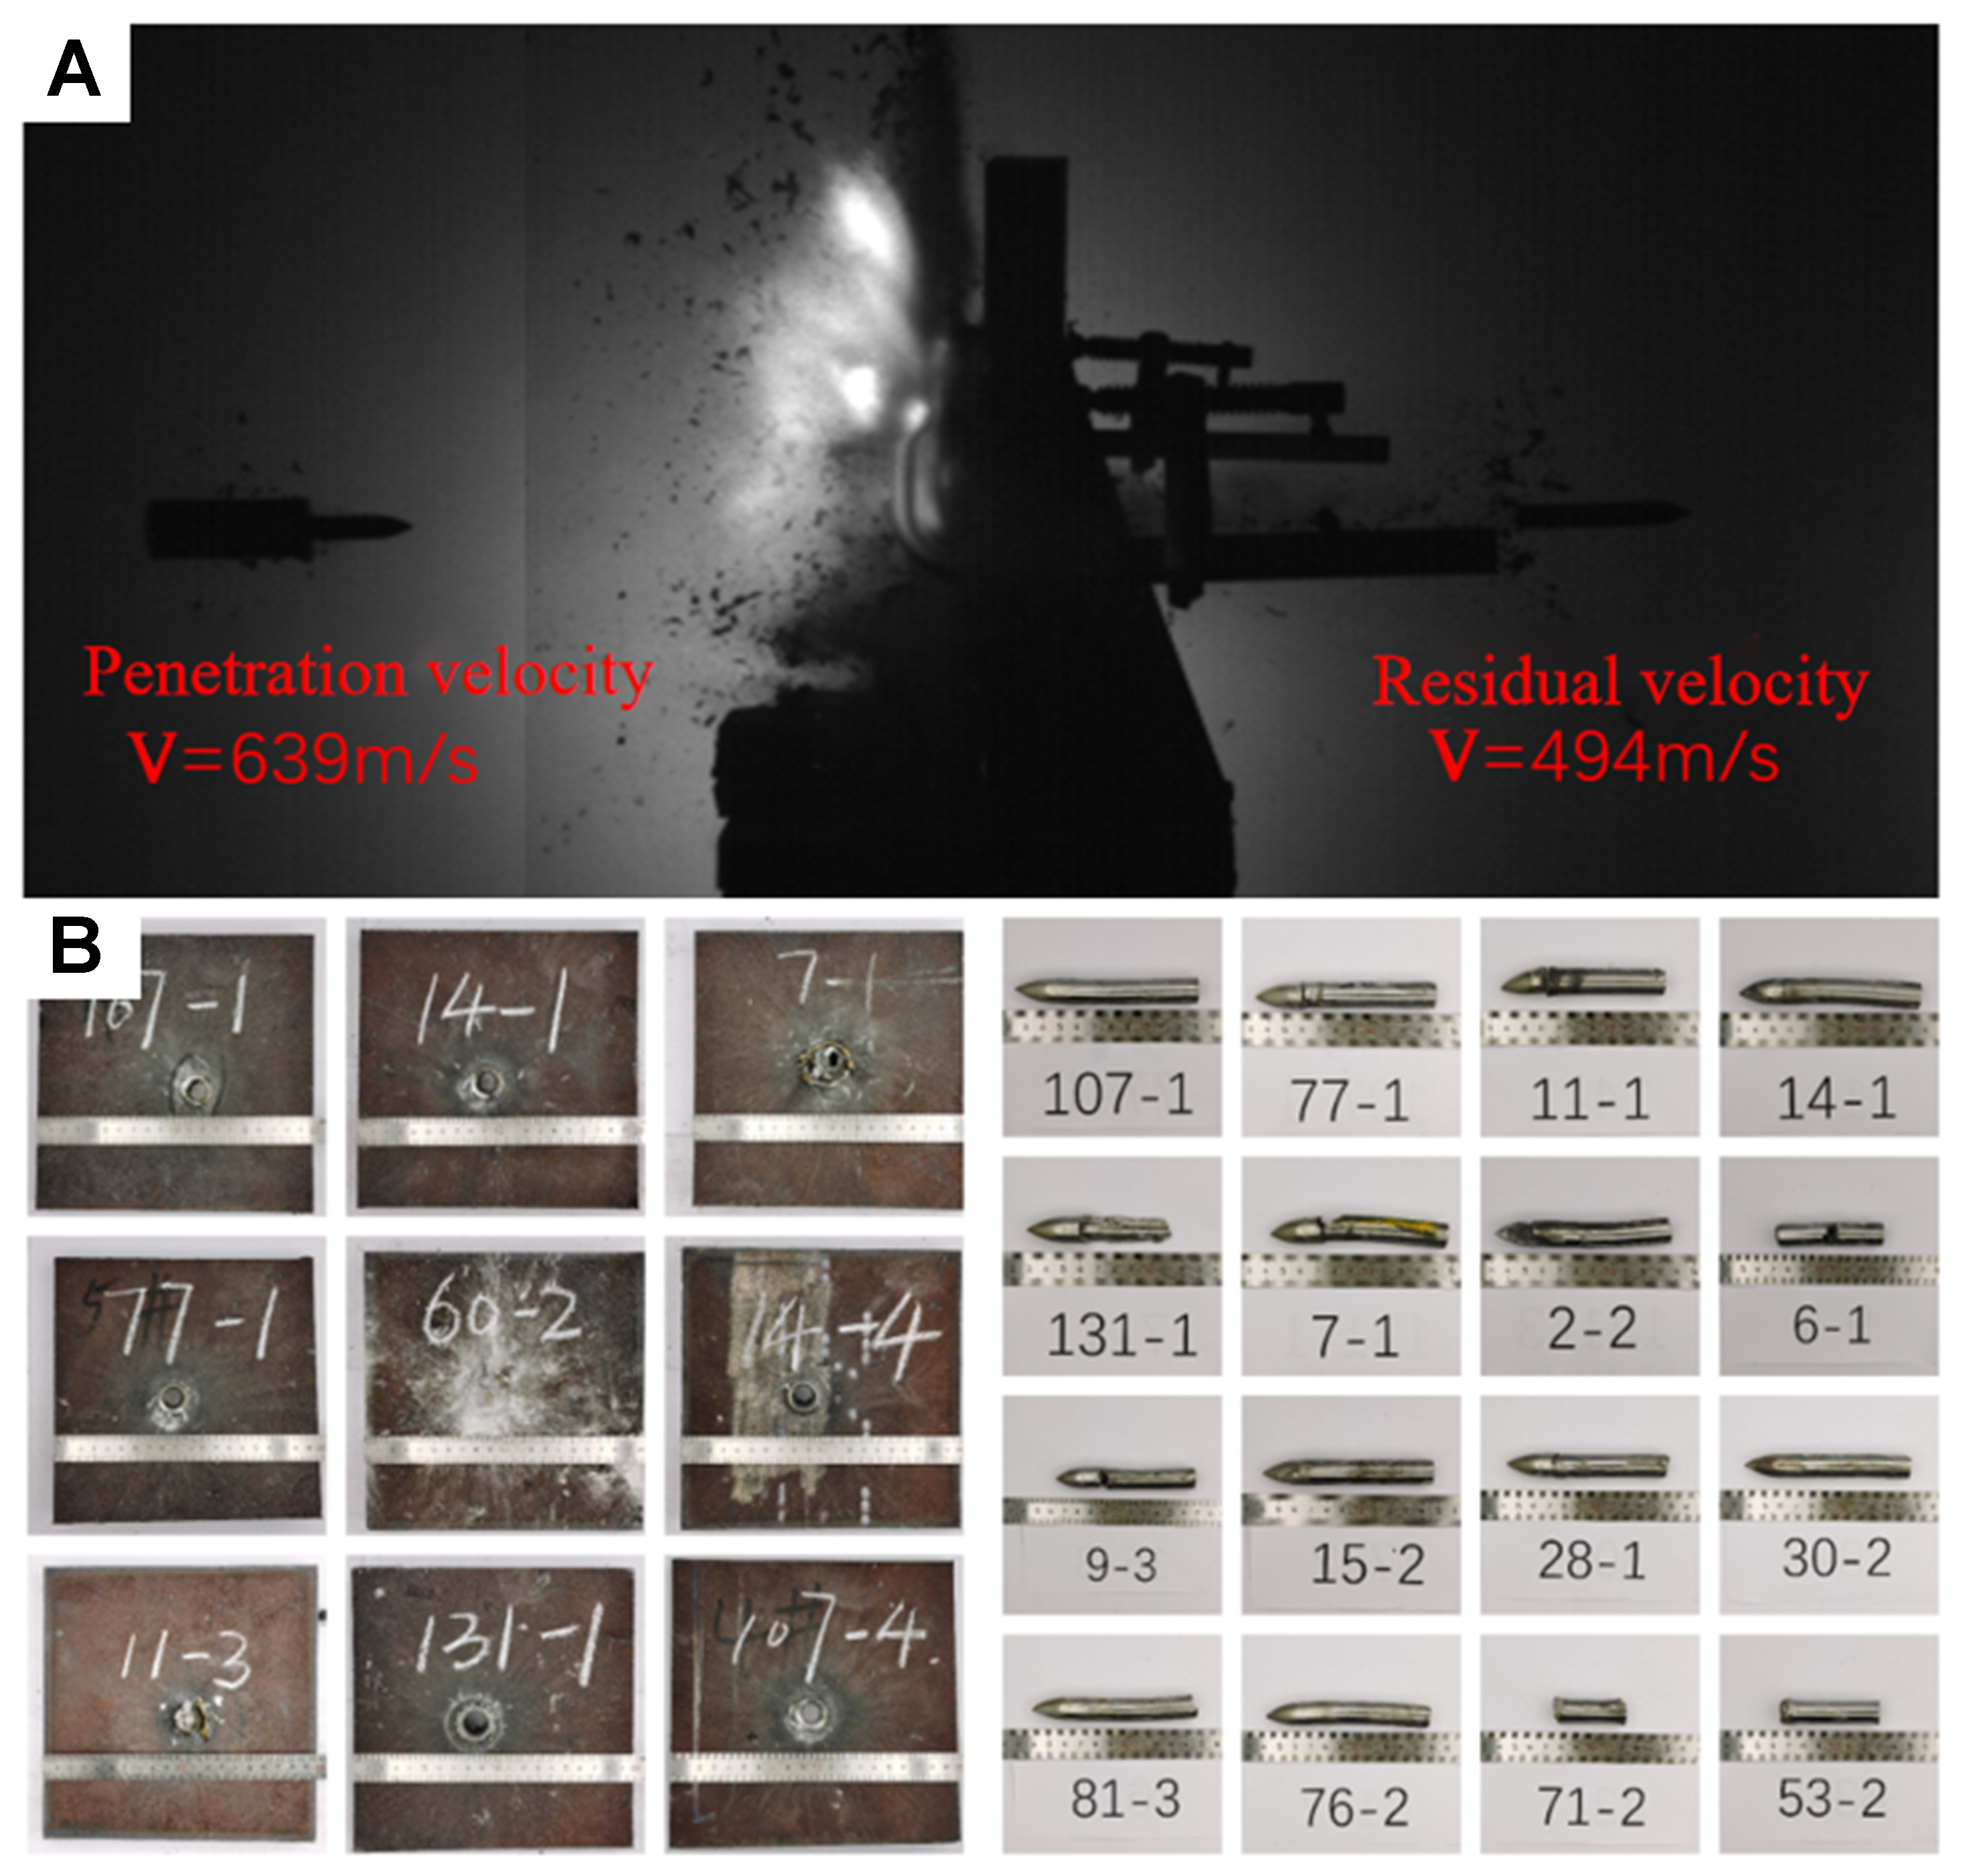
Figure 2. (A) High-speed camera images; (B) Target plates and scaled projectile samples.
(1) Scaled simulated projectile and target
An ogive-nosed scaled projectile with dimensions of 200 mm × 200 mm × 20 mm was used to impact the naval steel target plates.
(2) Sub-caliber launch platform
A 30-37 caliber smoothbore cannon served as the launch platform for the scaled simulated projectiles, as illustrated in Supplementary Figure 1A.
(3) Velocity measuring device
In this experiment, the firing distance was set to 3 m and the firing angle was set to 0° to the normal. The initial velocity was determined using a foil interrupt target positioned 1 m from the gun muzzle, as depicted in Supplementary Figure 1B. Additionally, a high-speed camera was employed to validate the launch velocity of the projectile and document the interaction between the projectile and the target, including the post-penetration posture and velocity of the projectile, as shown in Supplementary Figure 1C.
(4) Target frame and projectile recovery device
The steel plate was secured using F-type clamps to ensure that the clamping width around the perimeter did not exceed 20 mm. Rubber pads were applied to the front and back faces of the clamped sections for cushioning, as shown in Supplementary Figure 1D. To retrieve the projectile and any resulting post-penetration fragments, a recovery mat was strategically placed on the after-effect target stand, situated 50 mm behind the steel target, as shown in Supplementary Figure 1E.
A schematic diagram of the scaled projectile penetration test is shown in Supplementary Figure 2.
Efficient acquisition method for penetration simulation parameters
The scaled penetration experiments provided reliable reference data but were insufficient in number for robust machine-learning training. Therefore, finite element simulations were introduced to expand the service-performance dataset, provided that the simulation parameters could be accurately identified. Numerical simulations are an effective tool for augmenting the service performance data. Although the scaled penetration tests provided reliable experimental data, most of the service-performance data used in this study were generated by simulations. Because the validity of these results depends on the accuracy of the simulation parameters, an efficient method is required to accurately compute these parameters for the different G33 microstructures. The finite element method (FEM) is widely used in engineering to solve boundary value problems and analyze the response of complex physical systems under service conditions. LS-DYNA is a widely used finite element package that includes models of approximately 300 materials and 16 equations of state. Once reliable simulation parameters are obtained, high-performance computing can be used to lower the experimental costs, shorten the computation time, and support the selection of materials.
Figure 3 details the parameter acquisition process for penetration simulations. By incorporating these parameters into the models and utilizing large-scale parallel computing, this approach shifts the acquisition of service performance data from costly experimental testing to efficient numerical simulation. This innovative approach, which requires data from only a limited set of physical tests to rapidly compute the service performance parameters for G33 ultra-high-strength steel, substantially augments the sample size of the service performance dataset. Such enhancement significantly bolsters the accuracy of predictions made by machine learning models.
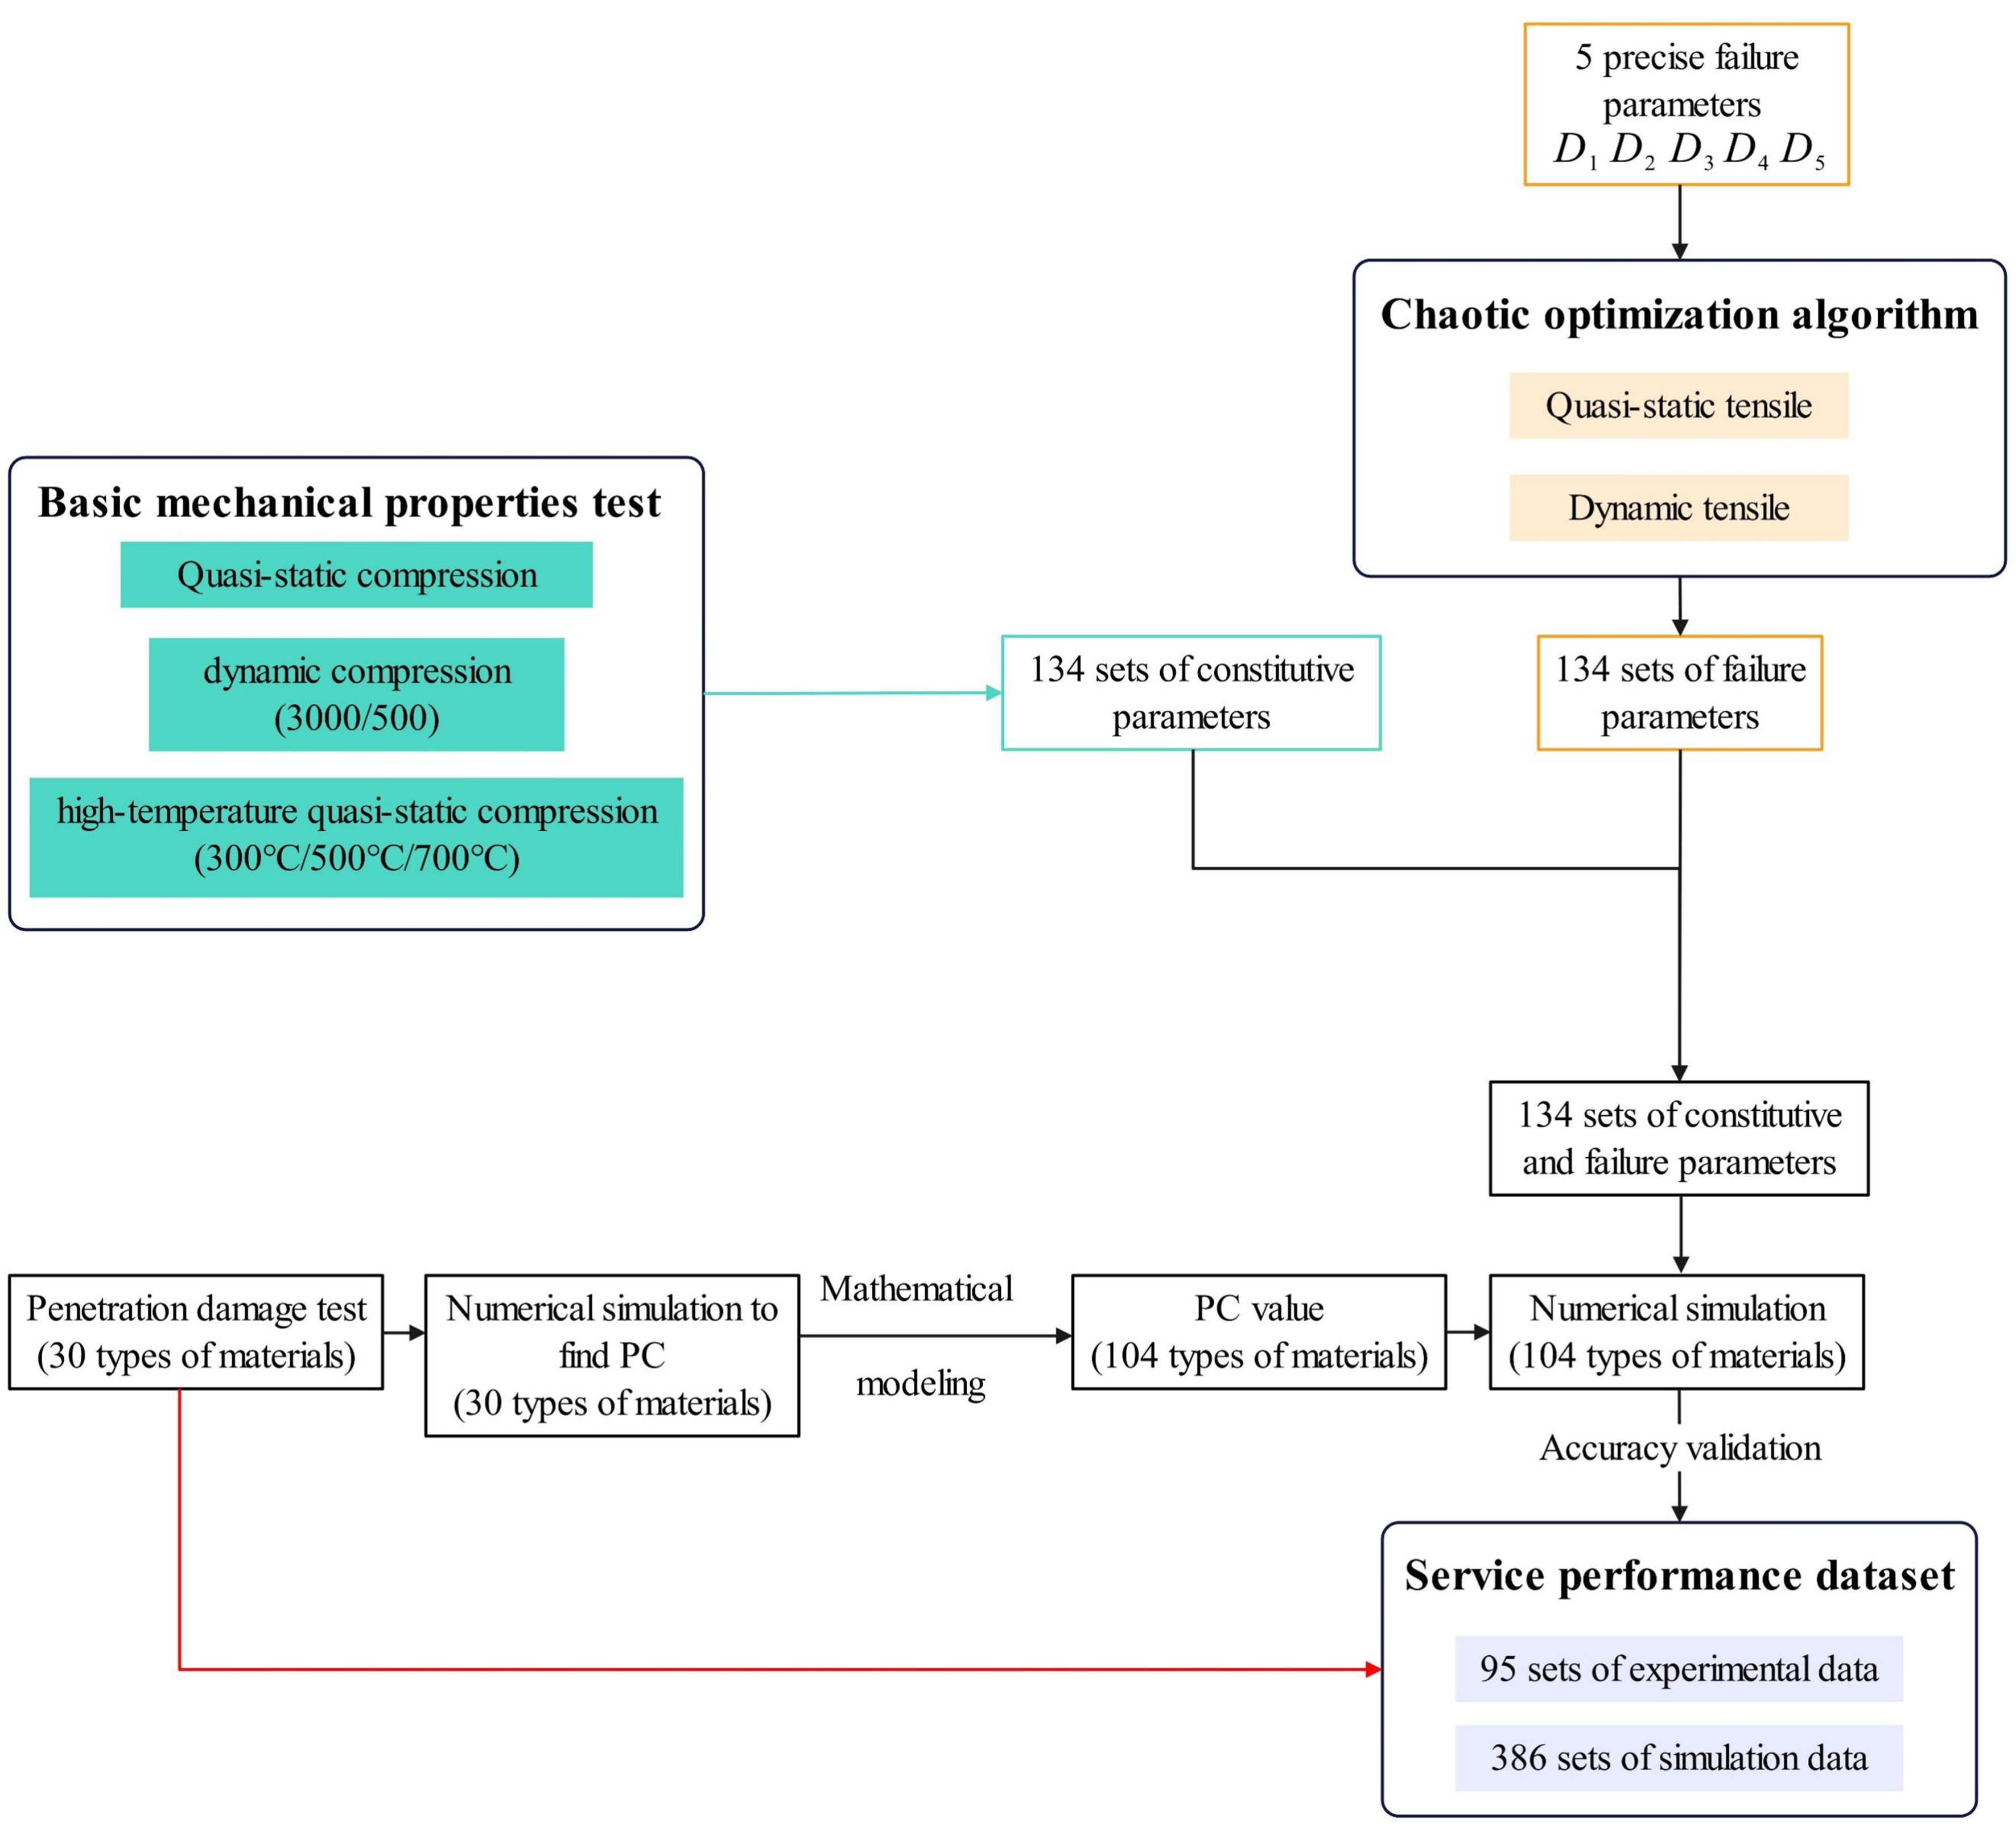
Figure 3. Flowchart of the parameter acquisition and optimization method for numerical simulation of penetration tests.
The JC constitutive and failure model is widely used in impact and dynamic loading analyses because this model accounts for strain hardening, strain rate sensitivity, and thermal softening. Accurately optimized parameters are necessary to improve the fidelity of the penetration simulations.
To ensure that the simulations accurately captured the behavior of the scaled projectiles penetrating the steel targets, we focused on the deflection of the projectile. A full-scale simulation model was built to match the experimental dimensions by defining the initial velocity using the *INITIAL_VELOCITY_GENERATION parameters. Both the projectile and the steel target were modeled using the JC constitutive and failure equations (*MAT_JOHNSON_COOK). The target JC parameters derived from experimental fitting are detailed in Table 2. An option to control hourglassing (*CONTROL_HOURGLASS) was included to prevent the zero-energy modes associated with single-point integration. The contact between the projectile and steel target was defined as the eroding surface-to-surface contact (*CONTACT_ERODING_SURFACE_TO_SURFACE). Fixed constraints (*BOUNDARY-SPC_SET) were applied to the contact area between the steel target and target frame to simulate the support provided by the frame.
JC constitutive and failure equation parameters for marine steel
| Constitutive parameters | A | B | n | C | m |
| 0.0068 | 0.0055 | 0.2000 | 0.0200 | 1.0000 | |
| Failure parameters | D 1 | D 2 | D 3 | D 4 | D 5 |
| 0.1580 | 0.2100 | 3.9700 | 0.0010 | 1.0000 |
In addition to the constitutive and failure parameters, the penetration simulation requires auxiliary parameters. Notably, the PC value (keyword: *MAT_JOHNSON_COOK_PC: Failure stress or pressure cutoff) is an integral failure criterion. Without an explicit physical interpretation, this parameter cannot be calibrated directly through experimentation. In the simulation model, once the first principal stress within an element reaches a predefined threshold, it is eliminated automatically. This mechanism, in concert with the JC failure parameters, effectively dictates the failure dynamics of the material.
Overall, the penetration simulation model required 11 parameters, as summarized in Table 3.
Parameters of the numerical simulation model for penetration tests
| Category | Required parameters | ||||
| JC constitutive equation | A | B | n | C | m |
| JC failure equation | D 1 | D 2 | D 3 | D 4 | D 5 |
| Other supporting parameters | Failure criterion PC value | ||||
The efficient determination of the parameters listed in Table 3 is described below.
(1) The JC constitutive equation is[23]:
where ε denotes the equivalent plastic strain,
(2) Understanding the behavior of a material under complex stress states is fundamental to the design of new structural materials. Macroscopic failure results from damage accumulation until a critical threshold is reached. This damage is associated with the microstructural changes induced by temperature, loading, and other service conditions, which initiate microdefects, cause them to grow and coalesce, and eventually form fractures. Because ductile fracture in metallic materials is strongly influenced by the stress triaxiality, strain rate, and temperature, an appropriate failure equation is required to describe the damage behavior of ultra-high-strength steel during loading.
The form of the JC failure equation is[23]:
In the equation, εf represents the failure strain, σ* denotes the stress triaxiality,
Traditional approaches for determining JC failure parameters require extensive empirical testing and often ignore parameter interdependencies. This disjointed fitting process is inefficient and rarely yields globally optimal solutions. By leveraging insights into the parameter influence patterns and utilizing global optimization algorithms, a novel methodology was developed to obtain the JC failure parameters from quasi-static and dynamic tensile tests. This approach enables accurate and relatively high-throughput parameter identification to build the service performance dataset.
The chaos optimization algorithm leverages the ergodicity and the sensitivity of chaotic systems to the initial conditions to enhance the search diversity. Unlike conventional algorithms, this approach effectively prevents premature convergence to local optima (a common complication in conventional optimization algorithms) making it highly suitable for complex multidimensional problems. Because it can search for multiple variables simultaneously, it is well-suited to the coupled multiparameter inversion problem addressed here.
Unlike traditional metaheuristic methods such as genetic algorithms (GA) and particle swarm optimization (PSO), which may converge prematurely in highly nonconvex multidimensional parameter spaces, the chaos optimization algorithm exploits the ergodicity and pseudo-randomness of chaotic maps. This feature renders it suitable for the inversion of JC parameters in the present study.
According to chaos theory, seemingly random behaviors can arise in deterministic systems. Although chaotic trajectories appear disordered, they follow deterministic rules and can provide broad, nonrepetitive coverage of a bounded interval after sufficient iteration. Chaotic variables can be generated using several mappings, including logistic, cubic, and infinite folding maps. Among these, the infinite folding map provides a relatively balanced distribution with fewer iterations, which helps accelerate the convergence in the present optimization procedure. Therefore, it was selected for the present study.
The logistic equation is shown in Equation (3), with the initial value μ in the range (0, 1). When ν = 4, the system is in a state of chaos[25].
The cubic mapping equation is given in Equation (4). Within the interval (-1, 1), chaos occurs when the initial value is not zero. After multiple iterations, the generated points were randomly distributed, and even a slight difference in the initial value could cause significant changes in the output[26].
The infinite folding mapping equation is presented in Equation (5). Within the interval (-1, 1), chaos occurs when the initial value is not zero. After multiple iterations, the generated points are randomly distributed, thereby facilitating traversal of the entire system space[27].
Chaos optimization linearly maps chaotic variables onto the search space of decision variables, using the resulting trajectories for global optimization. The algorithm explores candidate solutions through a chaotic search and progressively narrows the search interval to accelerate convergence. Because chaotic motion combines randomness with ergodicity, this procedure improves the chance of identifying a near-global or global optimum.
The simulations were performed using the actual dimensions of the experimental setup. The details are presented in Supplementary Figure 3.
In this study, specimen #121 of the G33 ultra-high-strength steel was examined with designated ranges for the JC failure parameters D1-D5. Numerical simulations of the quasi-static and dynamic tensile tests were performed to ascertain the impact of these parameters on the simulation results. Detailed analyses of the fracture elongation rates for both testing modalities were conducted, and the results are shown in Figure 4. The results indicated that increments in the JC parameters D1 and D2, along with a decrease in D3, significantly affected the fracture elongation rates observed in the numerical simulations, leading to continuous linear variations in the outcomes. This reveals the critical influence of these parameters on the material performance. In contrast, the modulation of parameters D4 and D5 has minimal impact on the experimental results, highlighting their limited effect on the material properties.
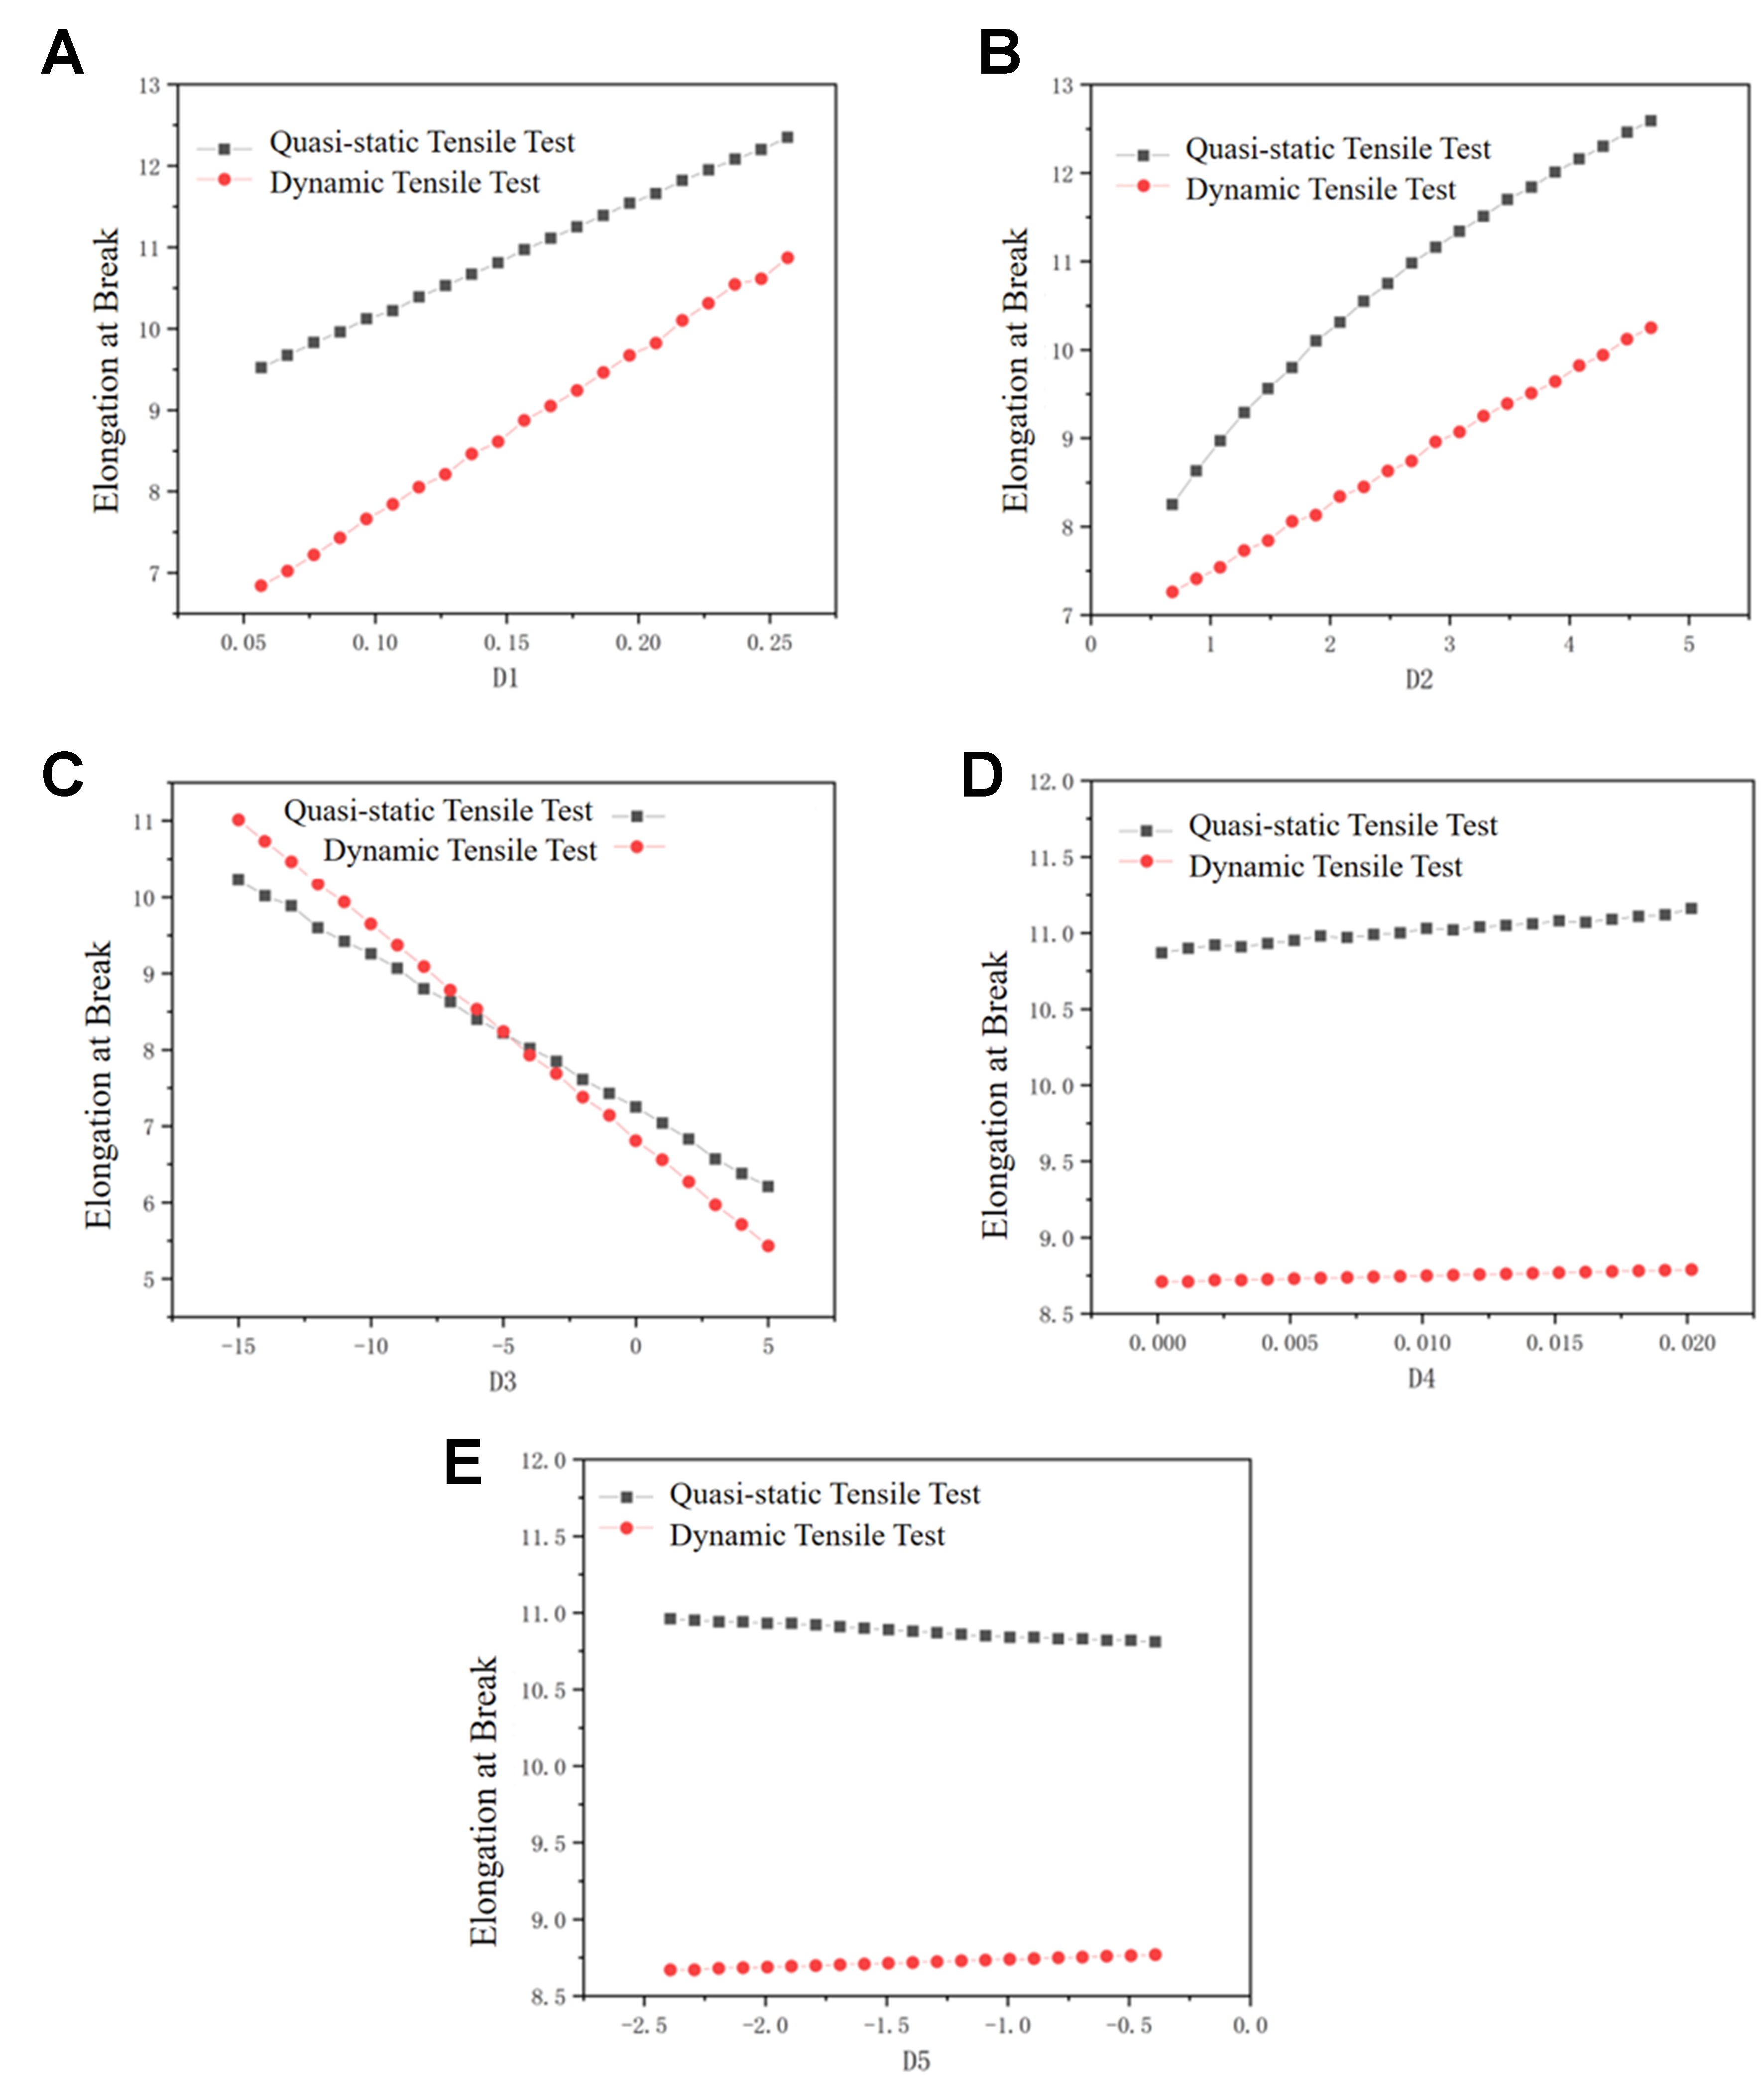
Figure 4. Influence of JC failure parameters D1-D5 on numerical simulation results.
The fracture failure behavior of G33 ultra-high-strength steel under quasi-static tensile testing was systematically analyzed to determine the optimal ranges for the JC failure parameters D1-D3, as well as specific values for D4 and D5. The fracture elongation rates were thoroughly examined, and the results are shown in Figure 5. The dataset was divided into five intervals, and one representative material was selected from each interval for fitting, resulting in five samples. Materials whose fracture elongation was close to the median value of each interval were selected, while differences in microstructure and heat-treatment history were also considered to ensure representativeness. The fitted JC failure parameters are listed in Table 4.
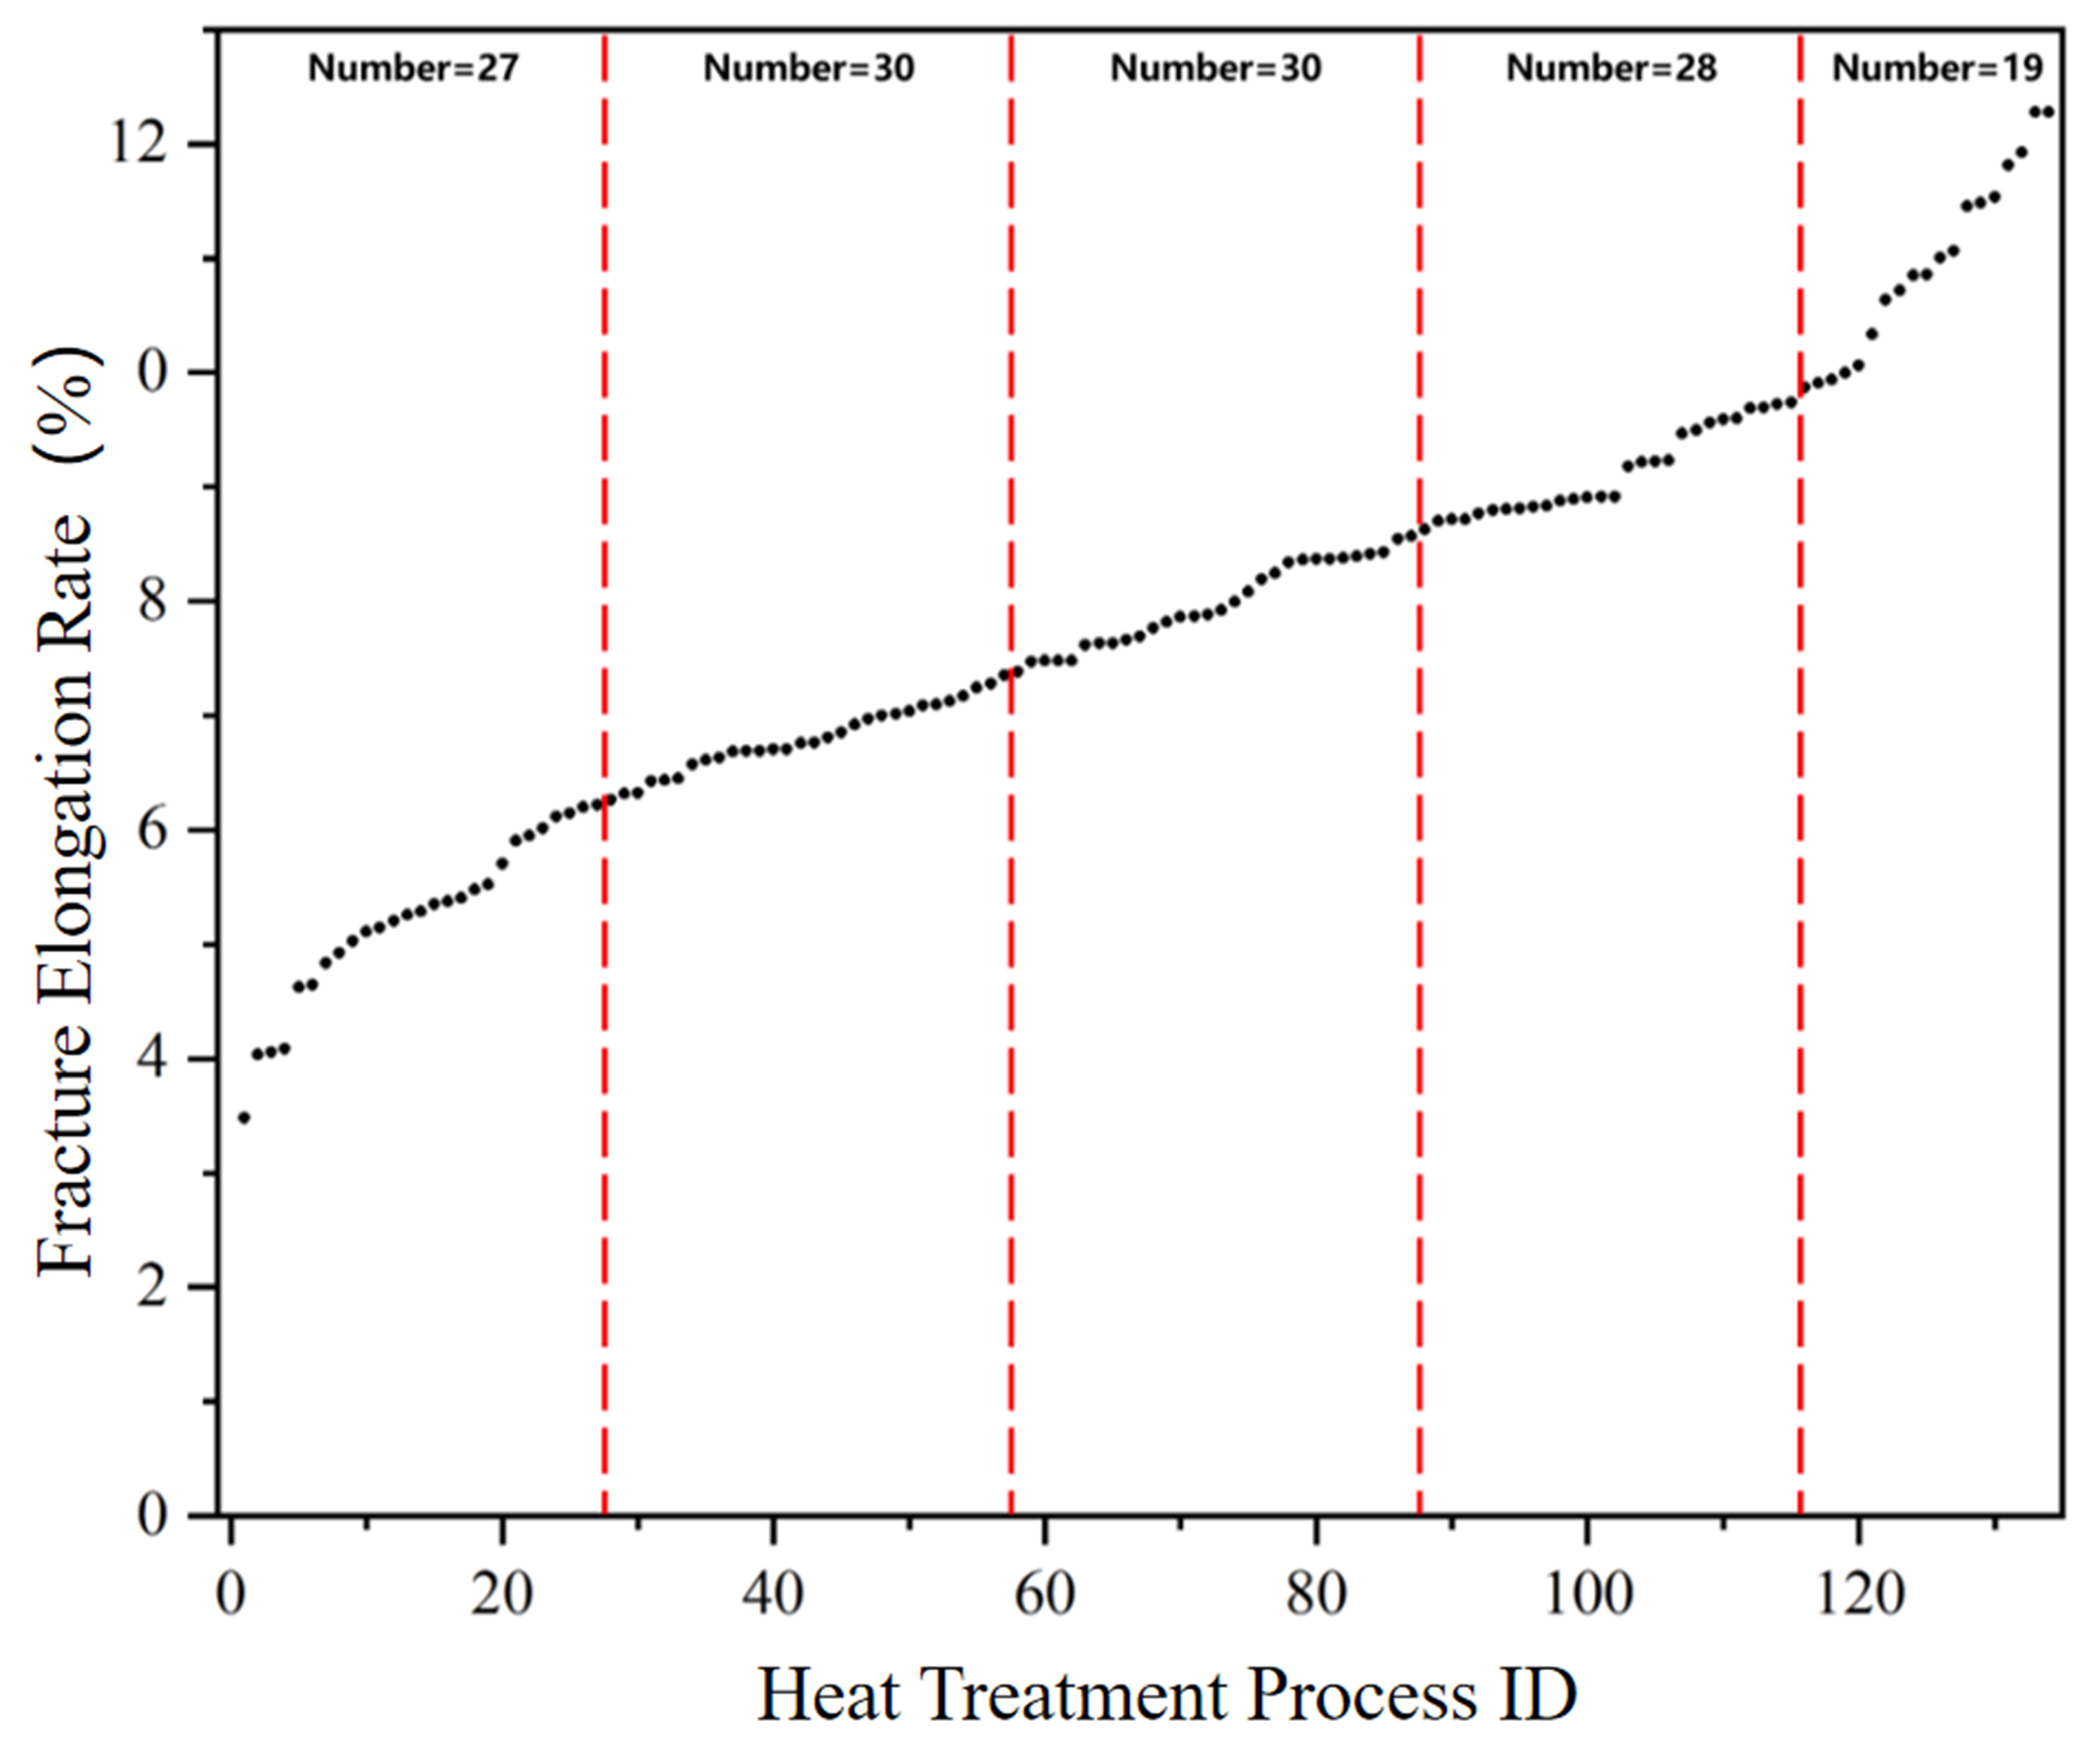
Figure 5. Statistical chart of fracture elongation in quasi-static tensile tests of ultra-high-strength steel.
Statistical table of JC failure equation parameters for 5 types of ultra-high-strength steel
| ID | D 1 | D 2 | D 3 | D 4 | D 5 |
| #25 | 0.0422 | 0.0736 | -2.1799 | -0.0185 | 0.5472 |
| #80 | 0.0357 | 2.4998 | -4.3184 | -0.0068 | -0.7419 |
| #93 | 0.2073 | 1.6284 | -2.8741 | -0.0182 | 0.1258 |
| #109 | 0.1139 | 3.1154 | -5.6164 | -0.0158 | 0.6378 |
| #121 | 0.1569 | 2.6815 | -5.4423 | 0.0062 | -1.3978 |
Within each interval, the fitted values for parameters D1-D3 were expanded both upward and downward to create numerical ranges that served as input domains for the chaotic optimization algorithm. Parameters D4 and D5 were assigned constant values common to all ultra-high-strength steel samples within these ranges. To precisely optimize parameters D1-D3 , simulation models were constructed for both the split Hopkinson tension bar (SHTB) test and the quasi-static tensile test. An infinite folding chaotic map is then used to generate candidate parameter sets within the prescribed ranges for global optimization. The optimization procedure is illustrated in Figure 6 and described below.
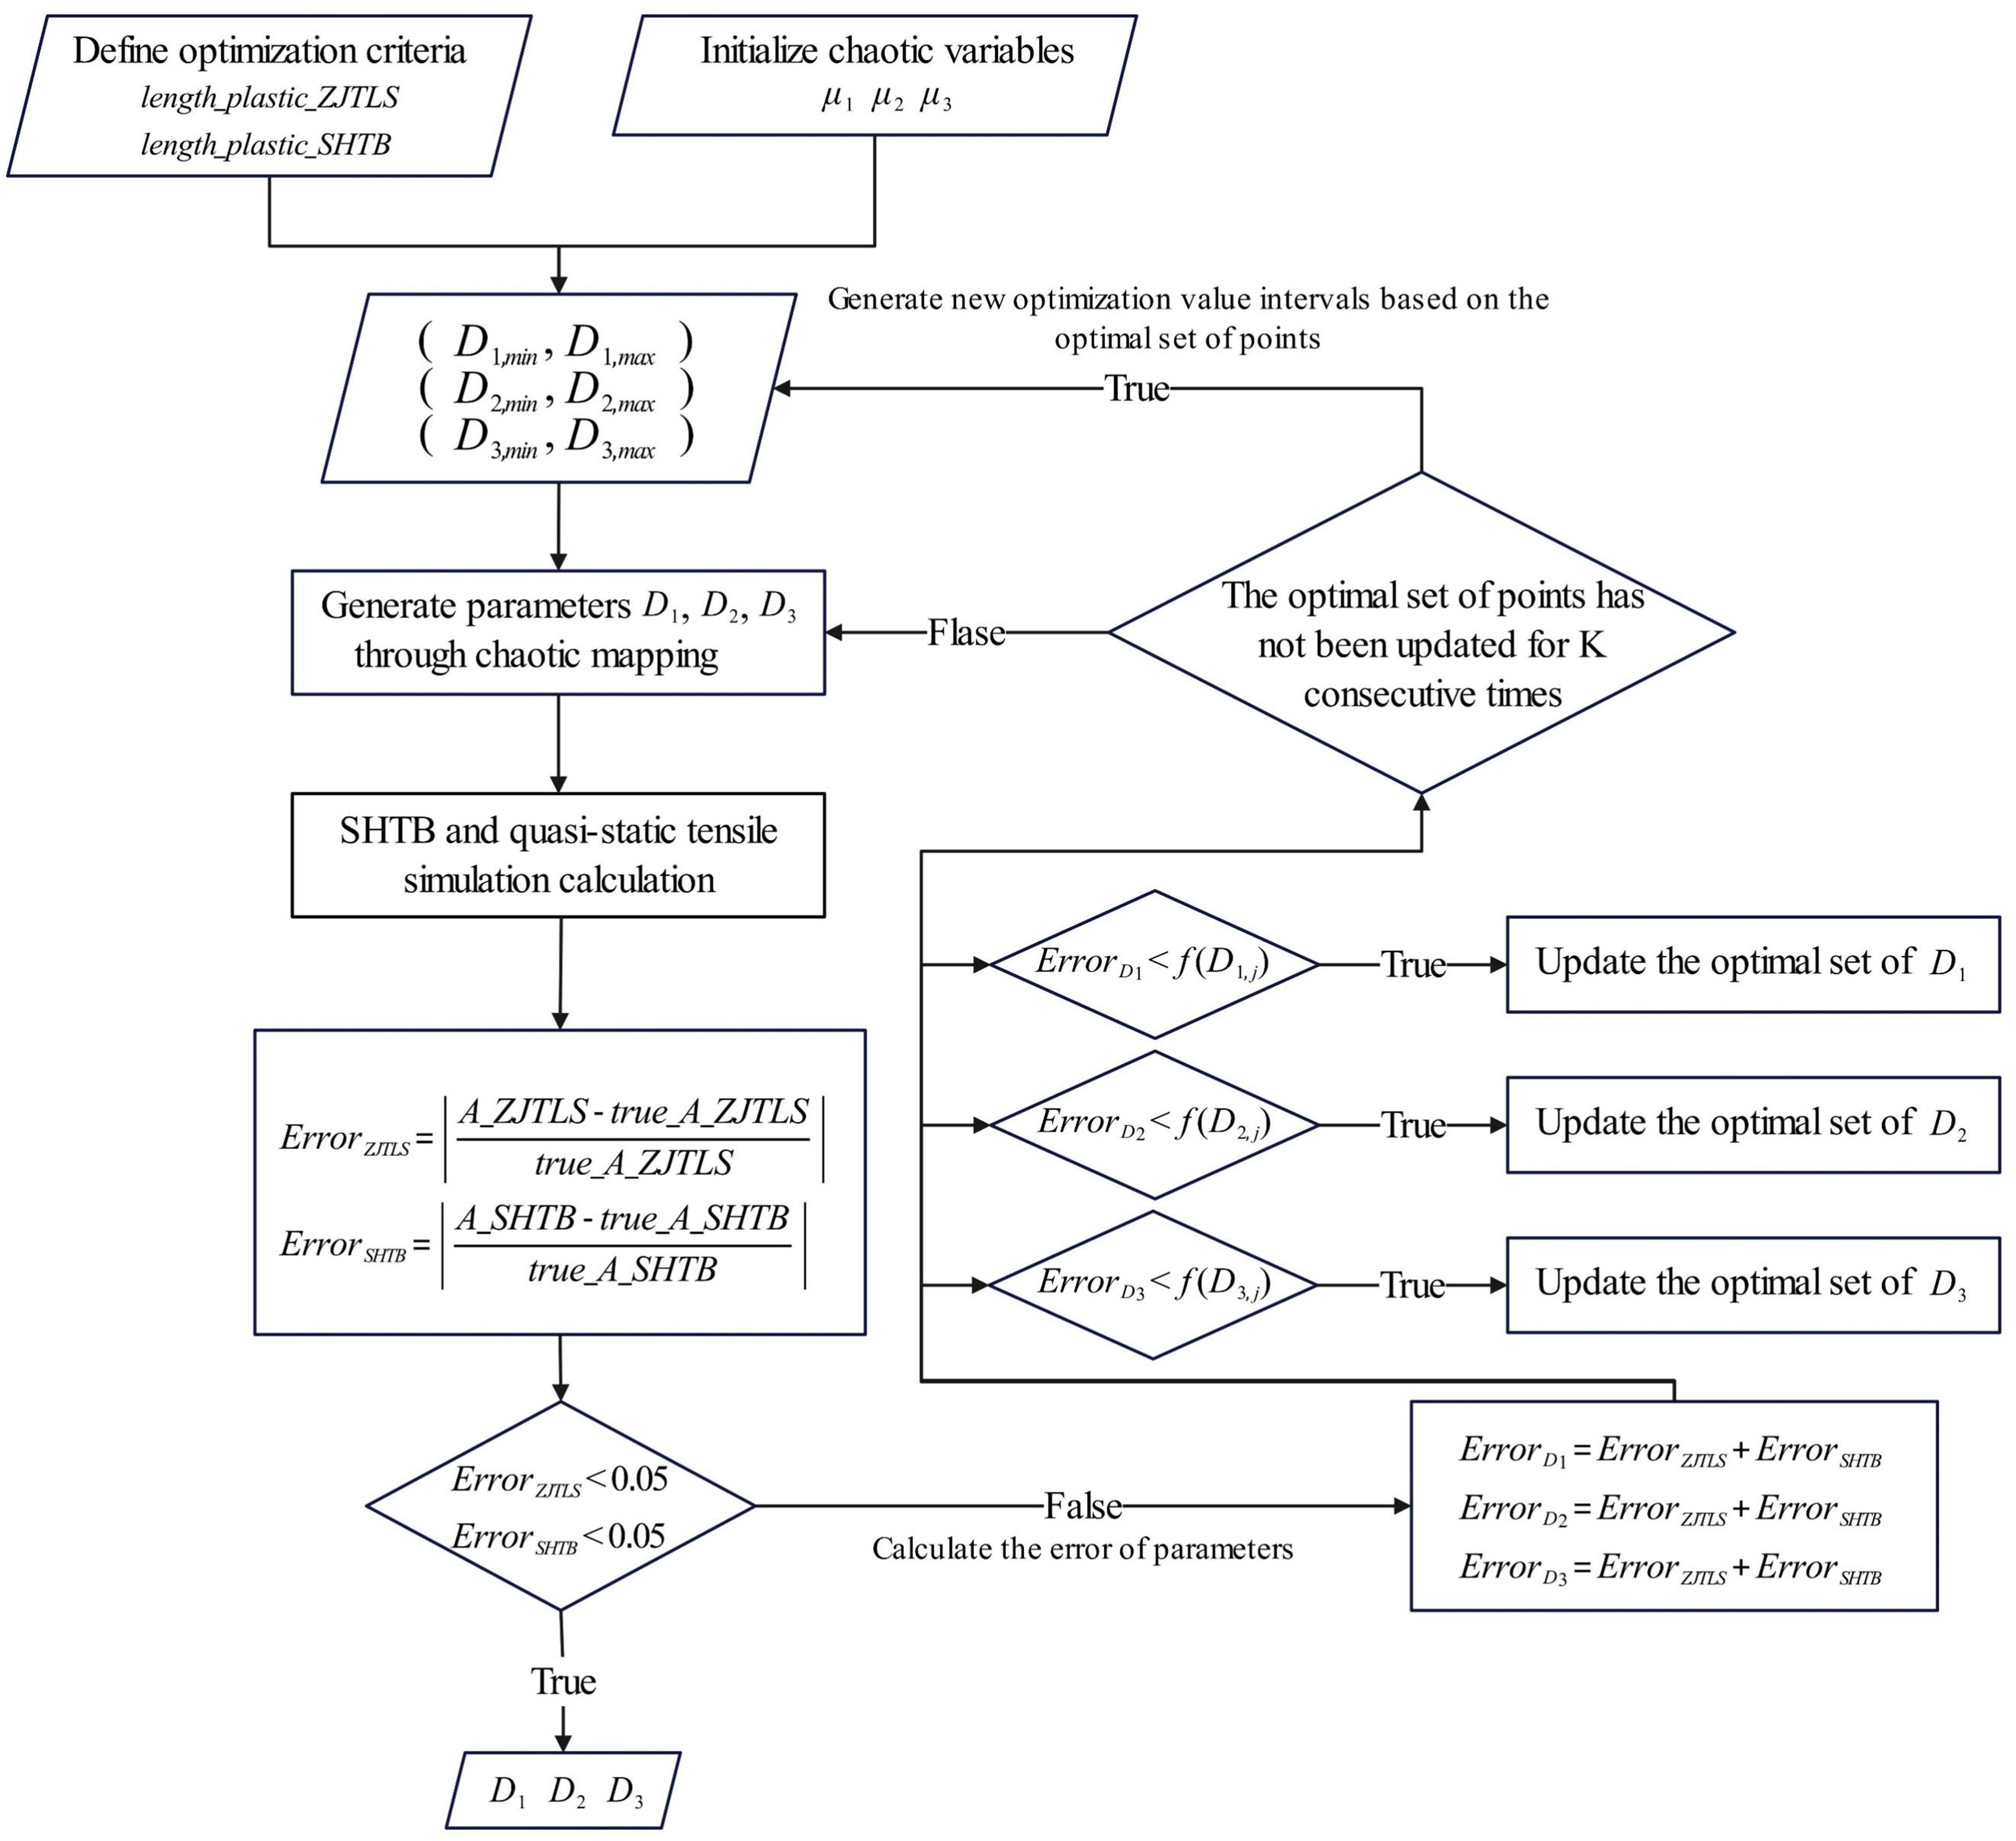
Figure 6. Chaotic optimization path for JC failure equation parameters. JC: Johnson-Cook; SHTB: split Hopkinson tension bar.
The model optimization procedure is summarized as follows:
① Initialization of Chaotic Variables and Setting Optimization Goals: Experimental results are used as target values for simulation calculations. Three distinct nonzero numbers, μ1, μ2, and μ3, within the range of (-1, 1) are selected as initial values for the chaotic variables.
② Determination of Optimization Intervals for Parameters D1-D3: Incorporate the optimization interval (-1, 1) and adjust its size according to practical considerations to enhance the computational efficiency.
③ Mapping Chaotic Variables to Parameter Values: Using Equation (6), the chaotic variables are mapped into the optimization intervals to generate the parameters D1-D3, which are then input into the simulation model for computation[28].
④ Extraction of Simulation Results and Calculation of Simulation Errors[29]: The error in the quasi-static tensile simulation is calculated as shown in Equation (7), where AZJTLS represents the fracture elongation rate from the quasi-static tensile simulation, and
⑤ Calculation of Errors for Parameters D1-D3[29]: Given the significant impact of parameters D1-D3 on both models, their error is computed as the sum of errors from the two simulation models, as outlined in Equation (9).
⑥ Establishment of the Initial Optimal Solution Set: The number of solutions in the initial optimal set is defined as N, with the first N points generated by the chaotic variables serving as the initial optimal solutions. Let D1,i denote the values of D1 after the ith iteration. If the error for D1,i (
⑦ Iteration and Convergence Criteria: A parameter K was specified. If the optimal solution set for a given parameter remains unchanged for K consecutive iterations, the bounds of that set are adopted as the new optimization interval for the next cycle, and the procedure returns to Step 2.
⑧ Termination of Optimization: The optimization process concludes when the errors for all parameters simultaneously meet the predefined target errors, that is, when
By combining experimental testing, numerical simulations, and parameter optimization, the JC constitutive and failure parameters were efficiently fitted for all 134 G33 steel variants.
(3) Validation of numerical simulation parameter accuracy in penetration testing. To verify the accuracy of the service performance data derived from the simulation, one ultra-high-strength steel sample was randomly selected from each of the three groups: samples lying on the fitted surface and the outliers above and below it. The samples were subjected to scaled projectile penetration simulations. As shown in Table 5, all the simulation errors were below 10%, thereby satisfying the dataset accuracy requirement. Supplementary Figure 4 compares the recovered projectile morphology after the penetration test at 727 m/s with the corresponding simulation results for G33 sample #128. The projectile shapes were consistent, and the residual velocity error after target penetration was only 3.6%. These results support the use of high-throughput simulations to generate service performance data for subsequent machine learning analysis.
Comparison of target test results and numerical simulation results for the critical projectile fracture penetration speed of G33 ultra-high-strength steel
| ID | Heat treatment process | Target test results (m/s) | Numerical simulation results (m/s) | Error rate (%) |
| #40 | 1,100 °C/1 h + OQ + -73 °C/1 h + 560 °C/5 h + AC | 728 | 680 | 6.6 |
| #83 | 1,050 °C/1 h + OQ + -73 °C/1 h + 200 °C/4 h + AC | 830 | 915 | 9.3 |
| #128 | 1,000 °C/1 h + WQ + 250 °C/5 h + AC | 735 | 680 | 7.5 |
This study established an efficient method for determining the numerical simulation parameters required for penetration analysis. Through a combined experimental validation and high-fidelity simulation, a paired dataset containing 483 sets of mechanical and service performance data was constructed (95 experimental service performance samples and 388 additional high-fidelity simulation samples). The dataset includes five target metrics: scaled projectile penetration velocity, penetration occurrence, post-penetration projectile integrity, residual velocity after perforation, and critical velocity for projectile fragmentation. Our strategy substantially reduced the experimental cost while improving the data acquisition efficiency, thereby providing a solid basis for the predictive modeling of the relationship between the mechanical properties and service performance.
RESULTS AND DISCUSSION
Overview of the methodology
Based on the paired dataset generated in Section “Materials and Methods”, a two-stage machine-learning framework was constructed to map conventional mechanical properties to ballistic service responses. The overall workflow of this framework is illustrated in Figure 7. The framework was designed according to the physical sequence of the penetration process. In the first stage, a random forest classifier determined whether penetration occurred. For penetrated cases, the samples were passed to the second stage, in which a MLP regression was used to predict the residual velocity and critical fragmentation velocity, while a separate random forest classifier evaluated post-penetration projectile integrity. This staged design prevented the regression model from assigning physically unrealistic residual velocities to non-penetrated cases and improved the consistency between the model outputs and the actual penetration process.
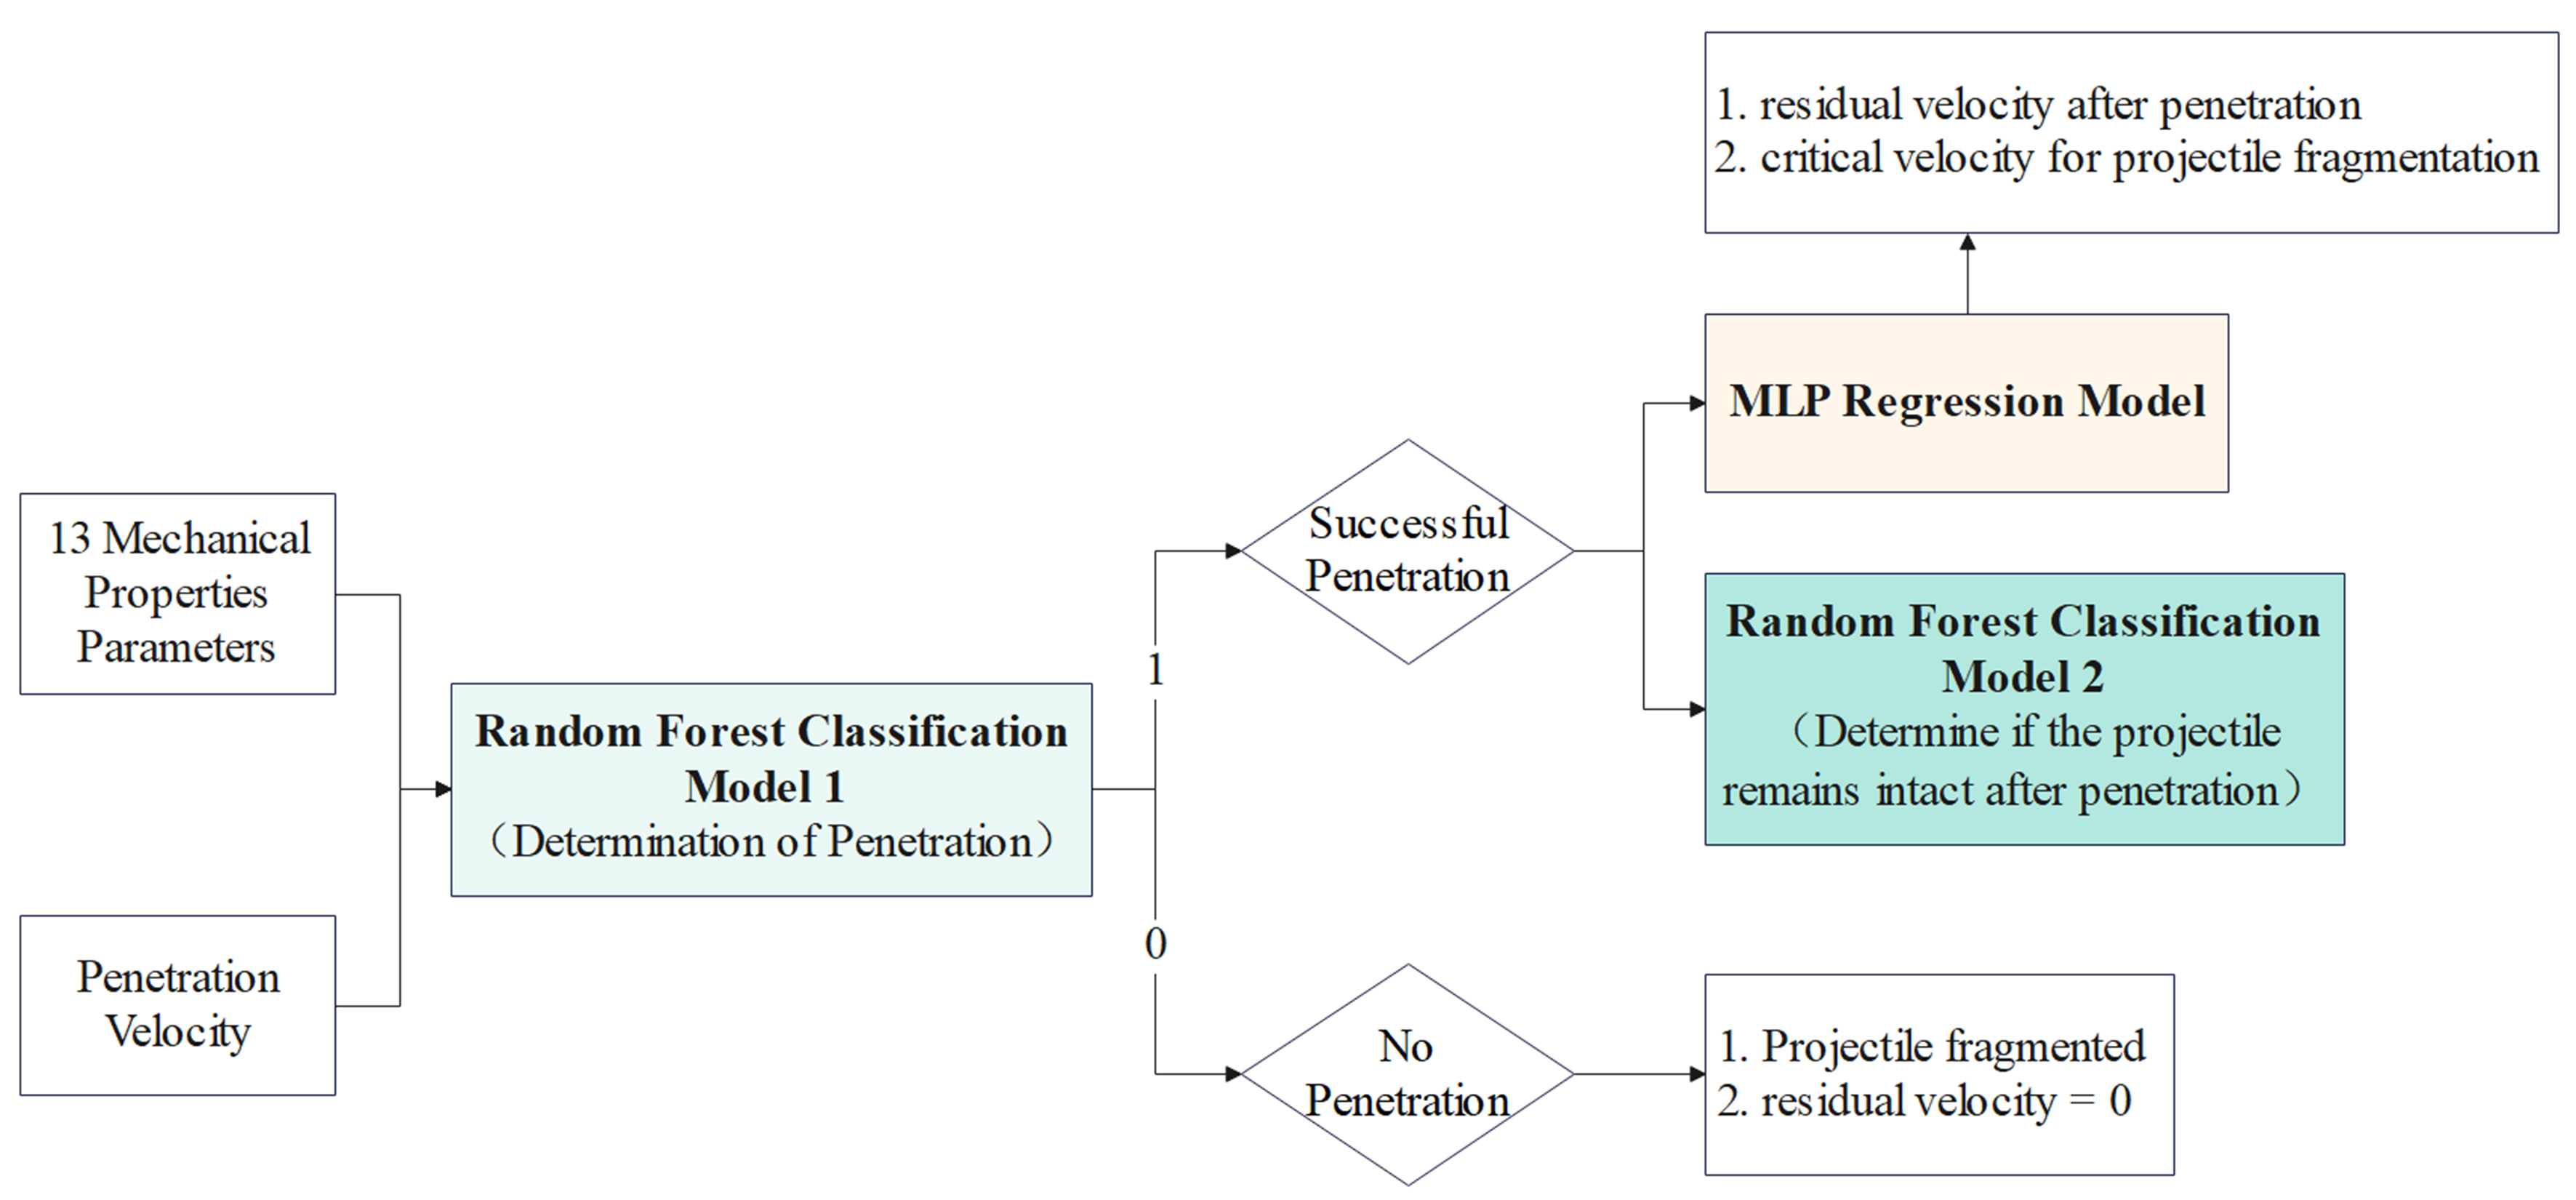
Figure 7. Flowchart of the two-stage model development for predicting operational performance parameters. MLP: Multilayer perceptron.
Operational performance classification model based on random forest
Random forest classification models were developed to predict two service outcomes: whether penetration occurred and whether the projectile remained intact after penetration. Random forest is an ensemble learning method based on decision trees and is well known for its robustness and predictive accuracy on tabular data. It also provides estimates regarding the importance of features that are valuable for physical interpretations in material engineering. A decision tree consists of root, internal, and leaf nodes. The root node contains all the training data, each internal node splits the data according to a selected feature, and the leaf nodes represent the final categories.
The hyperparameters of the random forest models were optimized using GridSearchCV, which exhaustively searches for a predefined parameter grid and evaluates each combination through cross-validation. The parameter grid used in this study (“param_grid”) included the major random forest hyperparameters and their candidate values.
The specific grid parameters of the developed random forest classification model are listed in Supplementary Table 4.
Operational performance regression model based on MLP
The MLP is a feedforward artificial neural network composed of an input layer, one or more hidden layers, and an output layer. As each layer is fully connected to the next layer, the MLP can learn nonlinear relationships and is suitable for complex regression tasks. In this study, a relatively shallow MLP was used to capture the nonlinear mapping between the mechanical properties and ballistic performance while limiting the risk of overfitting.
To predict the continuous service performance metrics, namely the post-penetration residual velocity and critical fragmentation velocity, we developed a three-layer MLP regression model. The input layer contained 128 neurons, the hidden layer contained 64 neurons, and the output layer contained a single neuron that produced a predicted value. The detailed model configurations are listed in Supplementary Table 5.
The model was trained with the Adam optimizer using an initial learning rate of 10-3 and a decay of 10-5. This setting enabled stable convergence during training. All calculations were performed using Python 3.
Comparison with baseline models and ablation analysis
The benefits of the proposed architecture were assessed by comparing its performance with that of a conventional single-stage baseline model (for example, unified MLP). As depicted in Supplementary Figures 5 and 6, the single-stage model proved inherently deficient in that it was unable to map the abrupt discontinuity at the ballistic limit, and often erroneously predicted positive residual velocities for unpenetrated targets. In contrast, the two-stage RF + MLP framework imposed a physically meaningful classification boundary before regression, eliminated these zero-boundary anomalies, and reduced the mean absolute error (MAE) from 33.7 to 30.4 m/s.
Ablation analysis further demonstrated that each module contributed to the final performance. Removing the feature selection step introduced redundant dimensionality and weakened generalization, whereas omitting the chaos-based optimization compromised the quality of the simulation-generated data because the parameter search became more prone to converging to local optima. These results indicate that an integrated framework is necessary for accurate and physically consistent ballistic prediction.
Impact of data augmentation and generalization analysis
A key limitation of data-driven terminal ballistics research is the scarcity of experimental service performance data. In this study, the reliance on only 95 physical firing tests creates a serious risk of overfitting, in which the model learns the training samples but fails to generalize them to new material states.
The role of chaos-optimized finite element data augmentation was therefore evaluated by constructing a learning curve [Supplementary Figure 7] to track the training and cross-validation performances as the dataset became larger. The addition of increasing numbers of high-fidelity simulation samples steadily increased the cross-validation accuracy. The curve indicated that the model generalization stabilized only after the dataset exceeded 125 samples.
The evaluation with the learning curve indicates that the high predictive accuracy of the proposed framework is not simply a consequence of fitting a small dataset. Rather, it arises from the combination of physics-informed high-throughput simulation augmentation, which expands the dataset to 483 reliable samples, and a two-stage learning architecture that simplifies the prediction task and improves generalization.
Error analysis, validation, and model uncertainty
Stratified 10-fold cross-validation enabled the generalization to be rigorously assessed. Stratification preserved the class imbalance between penetration and non-penetration cases across all folds, thus reducing the evaluation bias toward the majority class.
The predictive reliability was further examined using a classification confusion matrix [Supplementary Figure 8] and a regression residual plot [Supplementary Figure 9]. The confusion matrix showed that the Stage-1 random forest accurately identifies the ballistic limit boundary. The residual plot for the Stage-2 MLP revealed that the residual velocity errors were approximately symmetric about zero without any obvious systematic bias.
Despite the high overall accuracy, analysis of the worst predicted cases provided important insights into the model uncertainty. The highest prediction variances were clustered exactly at the threshold of the ballistic limit (V50). From a materials science perspective, the terminal ballistic response at this critical boundary is highly stochastic. The transition between partial embedment and complete perforation is highly sensitive to random microstructural inhomogeneities, such as the localized distribution of microvoids or inclusions. These microscopic defects introduced inherent aleatoric uncertainties into the dynamic fracturing process. Considering that the current model accepts deterministic macroscopic mechanical properties as its input, the prediction uncertainty increases near this transition point. Recognizing this stochastic boundary is important for the practical use of data-driven models in armor design.
Operational performance prediction based on the entire dataset
The input and output data were standardized, and a 10-fold cross-validation was used to divide the dataset into training and testing subsets. This was accomplished by randomly splitting the full dataset into ten subsets, with each iteration using one subset as the test set and the remaining nine subsets for training. This procedure yielded ten models, and the performance was evaluated based on the average accuracy across ten folds. The results reported in this section correspond to the full feature model before the feature selection.
The predictive accuracies of the various models on their test sets are detailed in Figure 8. The classification model for projectile penetration achieved a high accuracy of 98.8% with minimal variability (4.2%), thereby demonstrating robust generalization and stability across data partitions. In contrast, the classification model assessing the integrity of the projectile post-penetration achieved an accuracy of 72.9%, with a substantial variability of 18%, indicating potential dependency and sensitivity to specific datasets, which could constrain the predictive performance. The regressor for the residual velocity after penetration achieved an accuracy of 92.7%, with a variability of 5.6%, indicating good generalization and stability. Here, variability refers to the range of results obtained from 10-fold cross-validation.
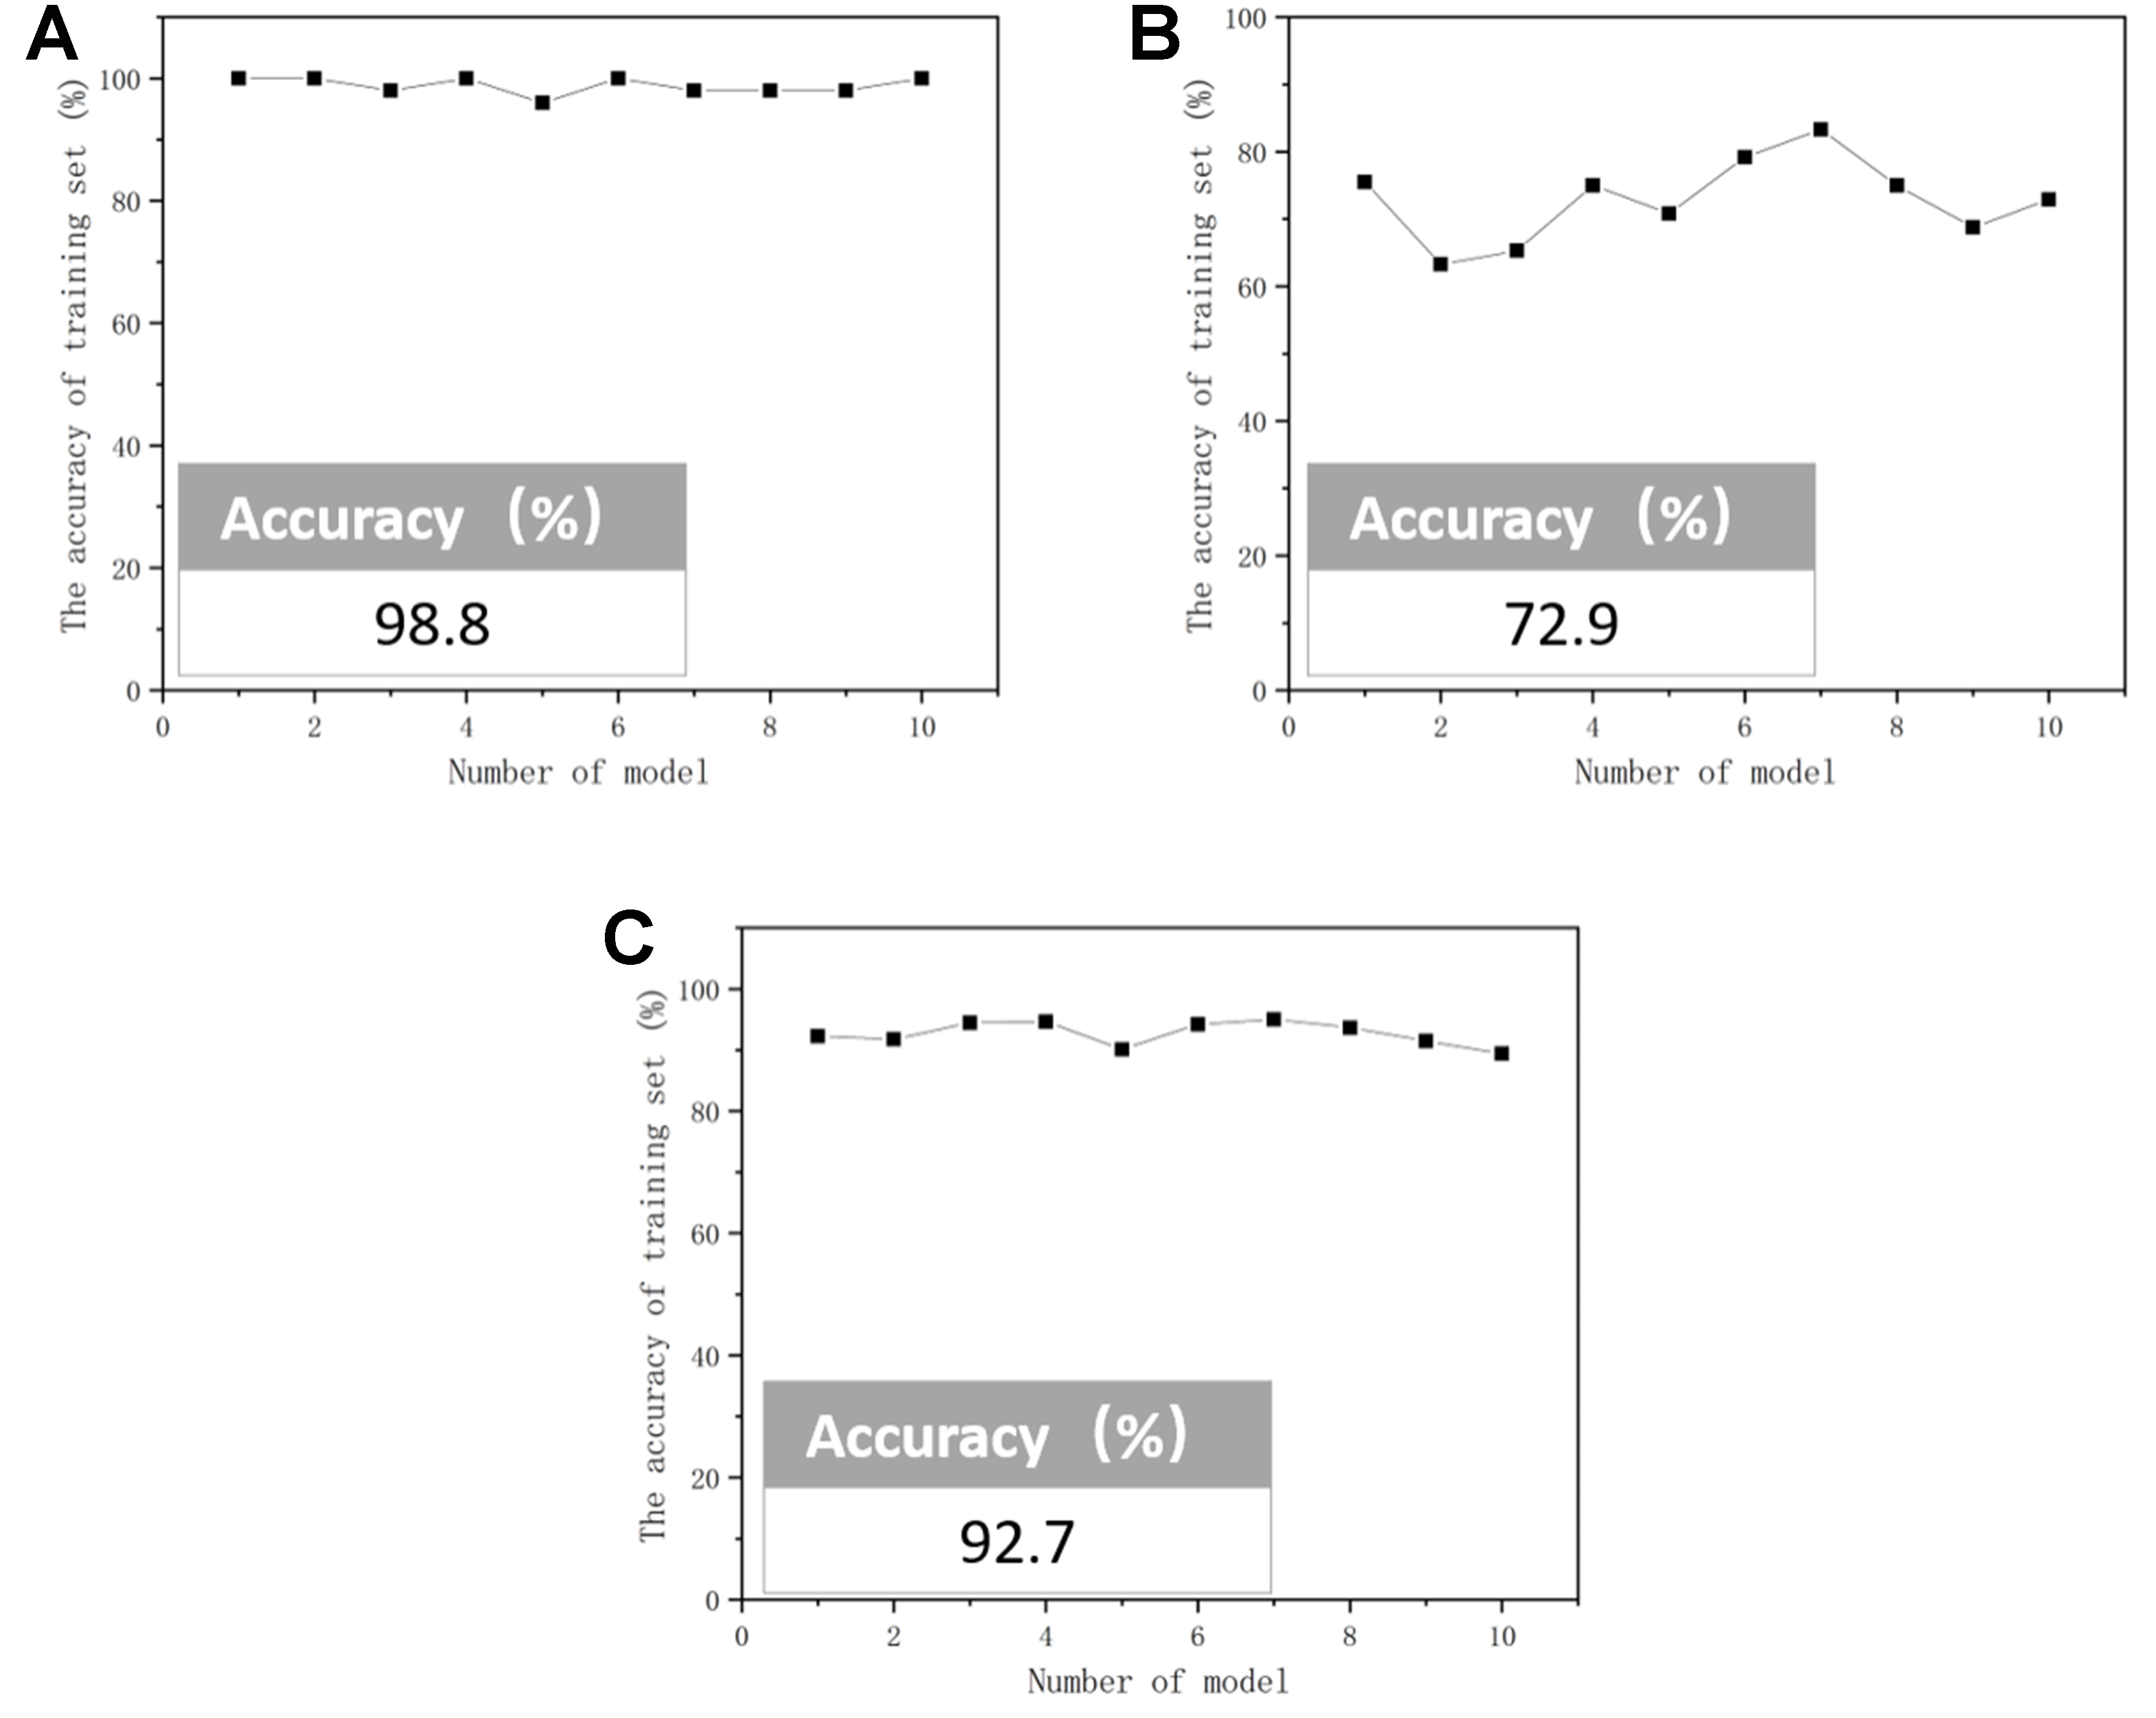
Figure 8. Accuracy of the test set for the mechanical and operational performance prediction model (full-feature model): (A) Classification model for projectile penetration; (B) Classification model for post-penetration projectile integrity; (C) Regression prediction model for residual velocity after projectile penetration.
For the regression tasks, the accuracy was defined as (1 - MAPE) × 100%, where mean absolute percentage error (MAPE) is given by:
Here, n represents the total number of samples, yi is the observed value of the ith sample, and
Operational performance prediction based on parameter selection
The preceding analysis utilized a dataset containing 1,742 values relating to the mechanical properties, and predicted the service performance metrics with high accuracy. However, collecting a large number of mechanical parameters is time-consuming, expensive, and sensitive to experimental variations. In addition, many parameters were correlated with each other. To reduce redundancy and streamline data collection, the Pearson correlation coefficients were calculated between all feature pairs and used for feature selection.
The equation for calculating the Pearson correlation coefficient is presented in Equation (11)[30]:
where xi and yi denote individual parameter values, whereas
Figure 9 presents the Pearson correlation coefficient matrix for the 13 sets of parameters. In this research, a threshold of 0.9 was established. Any pair of parameters with an absolute correlation coefficient exceeding this value was considered highly redundant, which necessitated the retention of only one parameter from each correlated pair. Based on the analysis depicted in the figure, five parameter sets were removed: the quasi-static tensile strength, quasi-static compressive yield strength, Vickers hardness, dynamic compressive strength at 3,000 s-1, and dynamic compressive strength at 5,000 s-1.
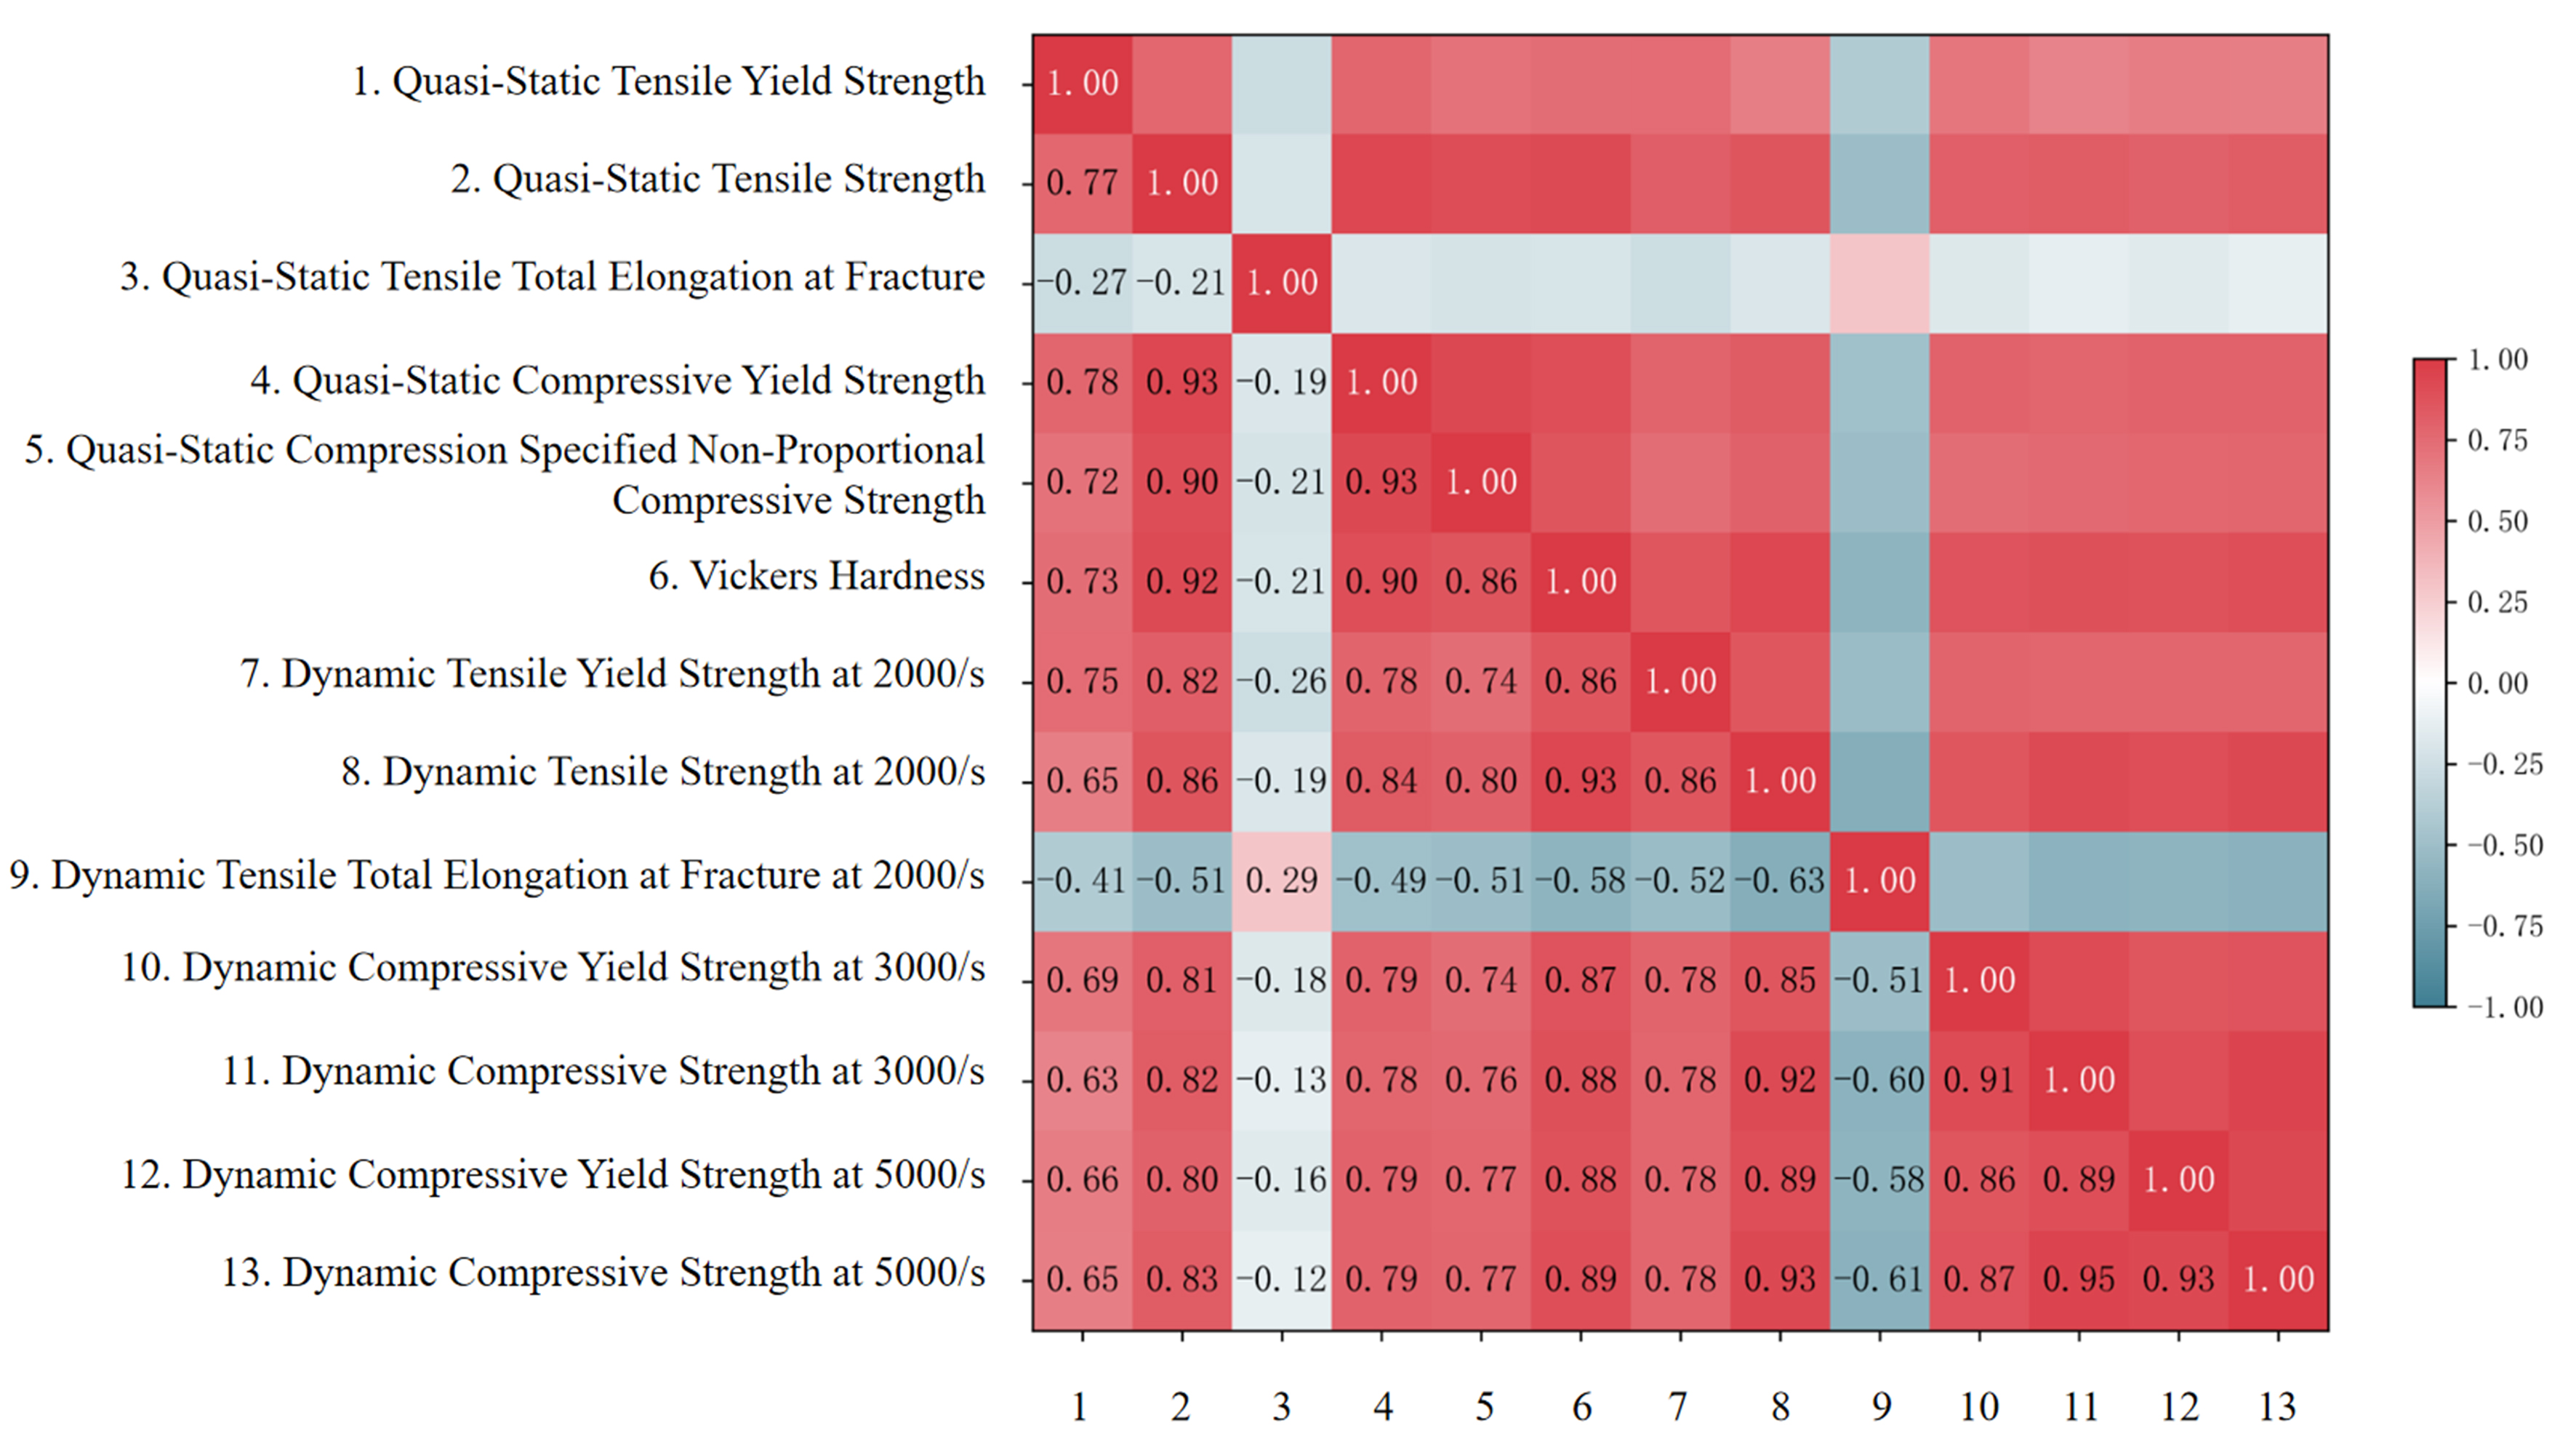
Figure 9. Pearson correlation coefficient matrix.
After feature selection, eight parameters relating to the mechanical properties together with the penetration velocity were used as inputs to the two-stage model, and the service performance predictions were recalculated using 10-fold cross-validation. The results of the final optimized feature selection model are shown in Figure 10. The classification model that determined projectile penetration maintained a high accuracy of 98.3% with a variability of 4.2%, demonstrating robust predictive precision. This indicates that the elimination of the five redundant parameters had a minimal impact on the predictive performance of the model, whereas the nine retained parameters sufficiently encapsulated the critical determinants of the model output. The classification model assessing the integrity of the projectile post-penetration improved the output accuracy of the model to 74.8% with a reduced variability of 18%, thereby significantly lowering its sensitivity to specific data subsets. Meanwhile, the regression model predicting the residual velocity of the projectile after penetration enhanced the accuracy of the model output to 92.9% while maintaining a variability of 5.6%. These improvements further bolstered the generalization capabilities of the model.
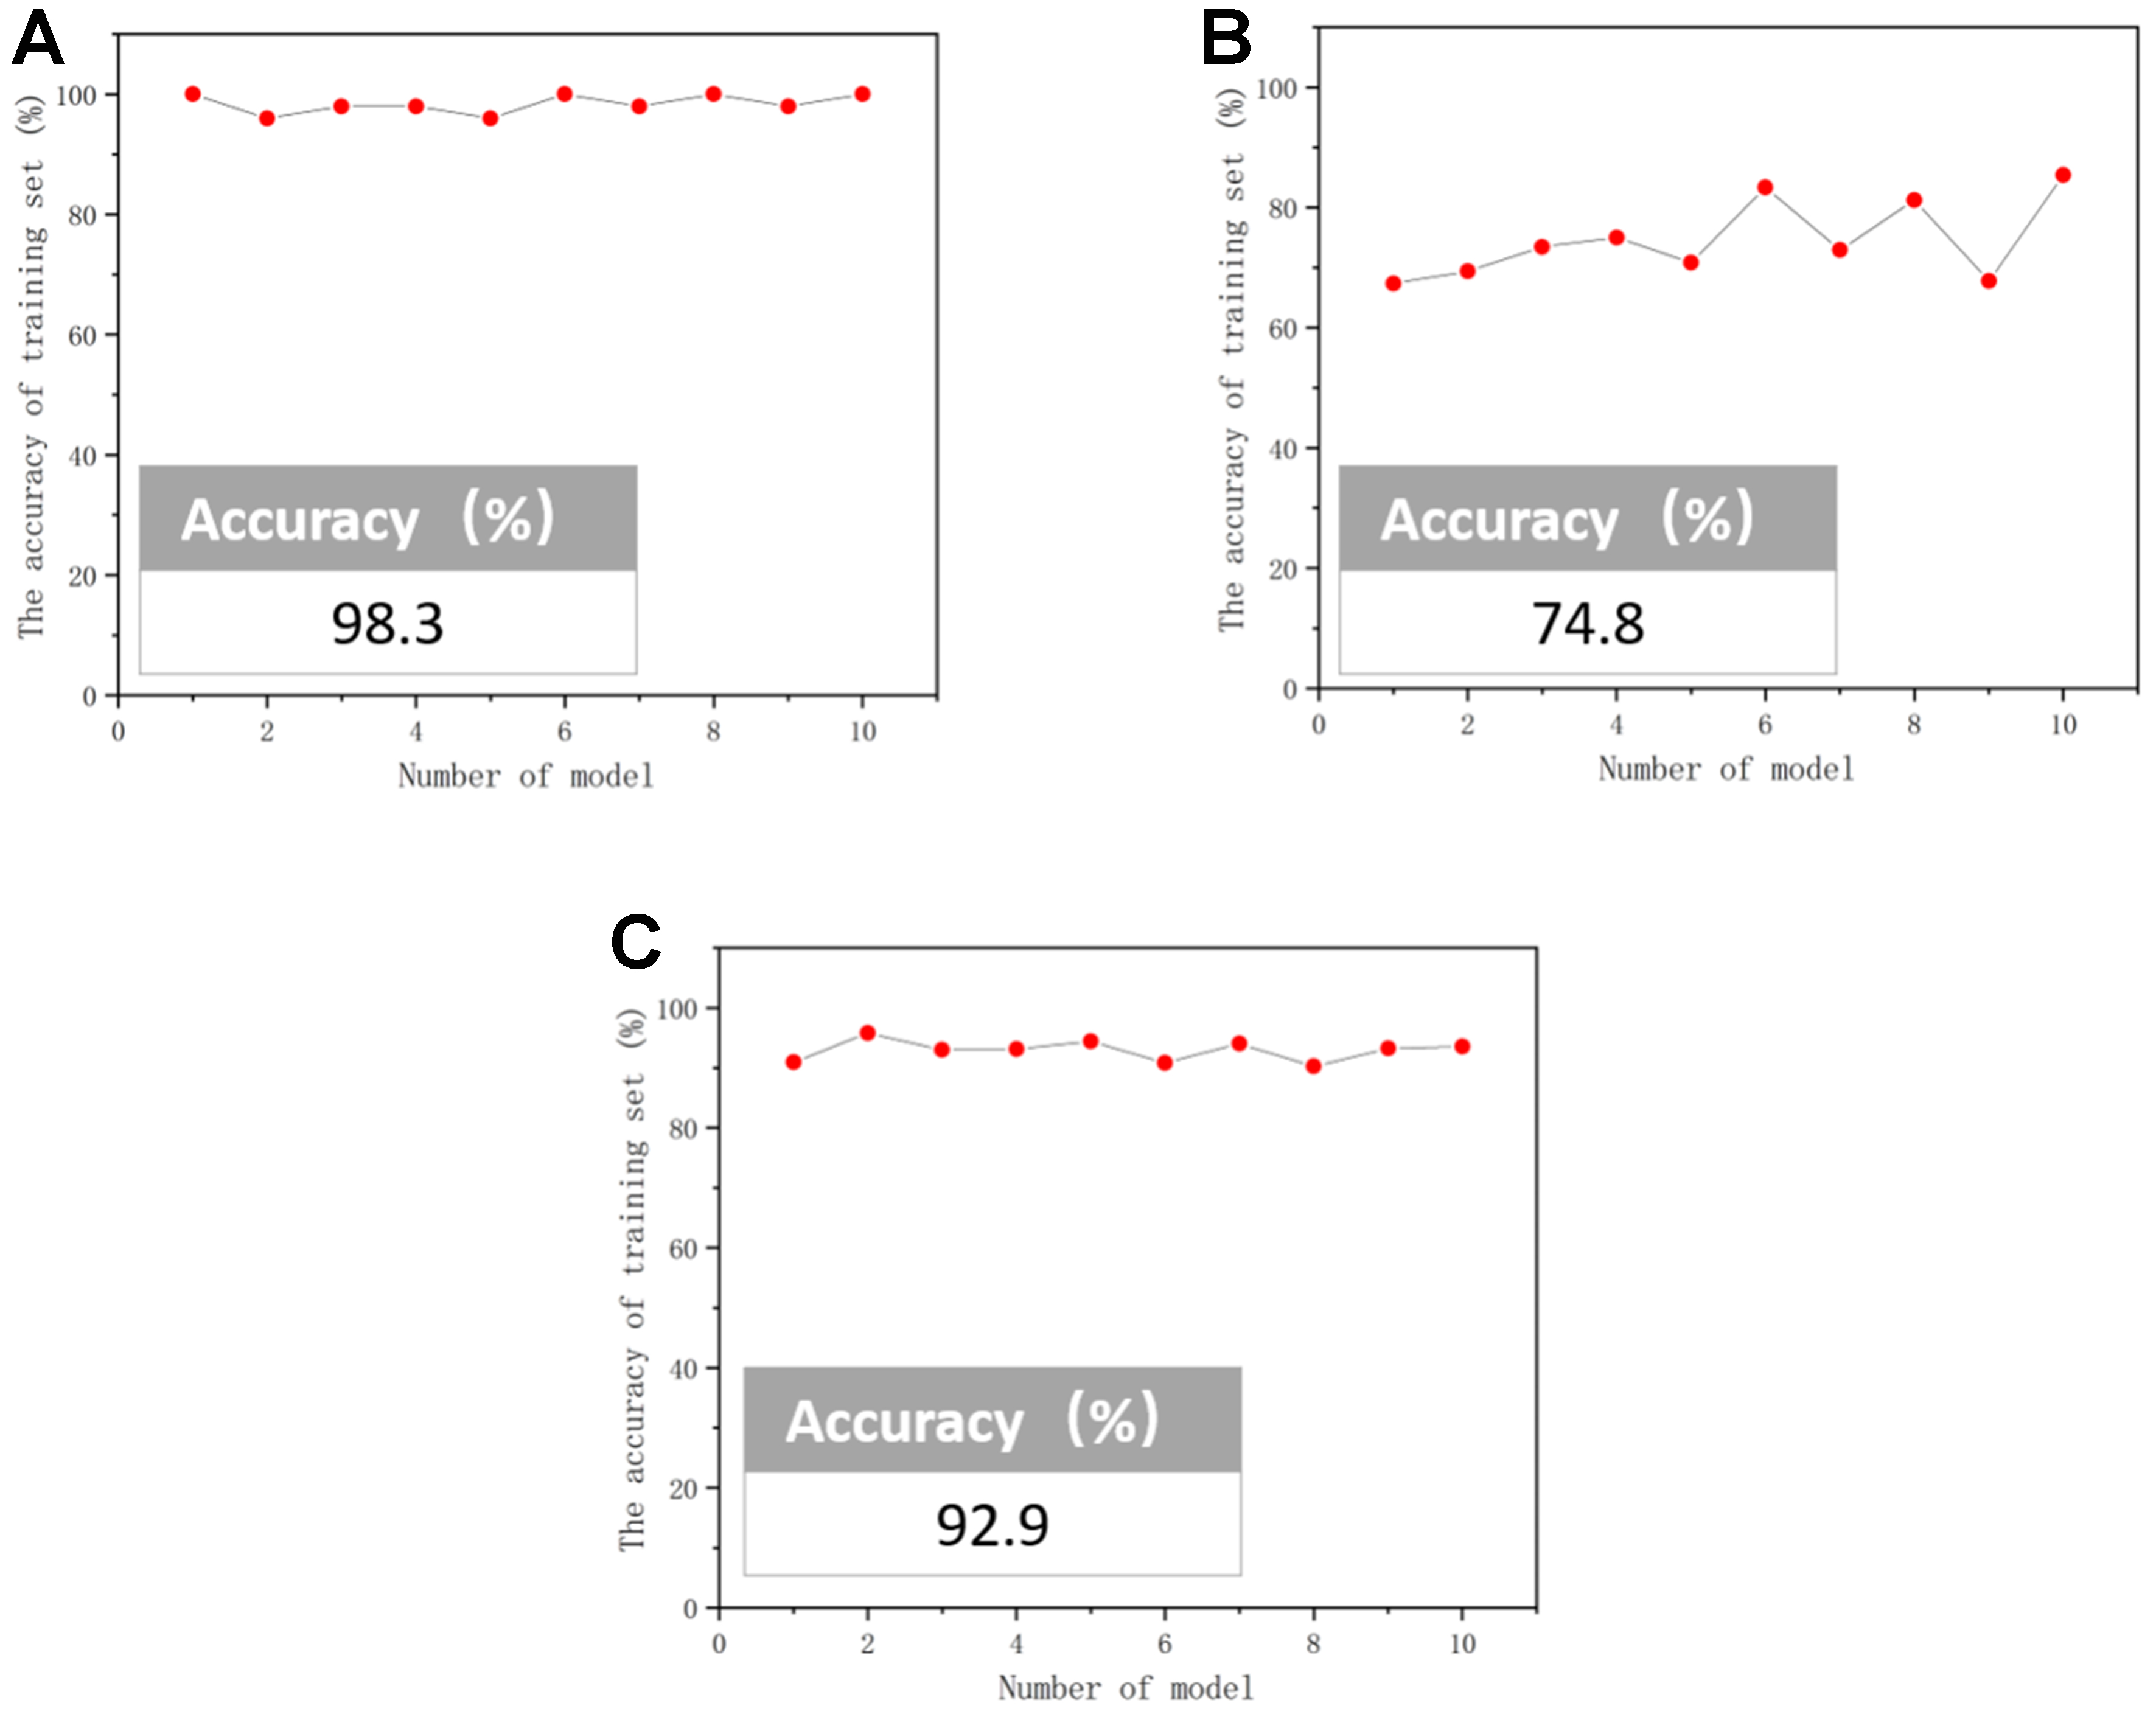
Figure 10. Predictive accuracy of the test set (final optimized feature-selected model) for the mechanical and operational performance prediction model after feature optimization: (A) Classification model for projectile penetration; (B) Classification model for post-penetration projectile integrity; (C) Regression prediction model for residual velocity after projectile penetration.
By removing redundant parameters, the input dimensionality was reduced, training became more efficient, and model generalization was improved. This refinement allowed the model to capture the key factors governing the output with fewer parameters, thereby reducing the data collection effort and shortening the prediction process.
However, even after feature reduction, the predicted service performance variables remained relatively scattered, which made a direct comparison among materials less straightforward. Additional statistical processing is still required to efficiently rank the materials. Therefore, we selected the critical projectile fracture penetration velocity, which is defined as the highest penetration velocity at which the projectile remains intact, as a single comparative indicator that directly links the mechanical properties to service performance.
Figure 11 illustrates the predictive accuracy distribution of the regression model for assessing the critical projectile fracture penetration speed of G33 ultra-high-strength steel. The model achieved an average predictive accuracy of 89.8% with a variability of only 8.9%, demonstrating both high precision and robust stability in predicting critical speeds. The selected experimental data and the corresponding model predictions are presented in Table 6. This model enables the direct estimation of the critical projectile fracture penetration velocity from mechanical property data and thus provides a practical basis for rapid service performance assessment and material optimization.
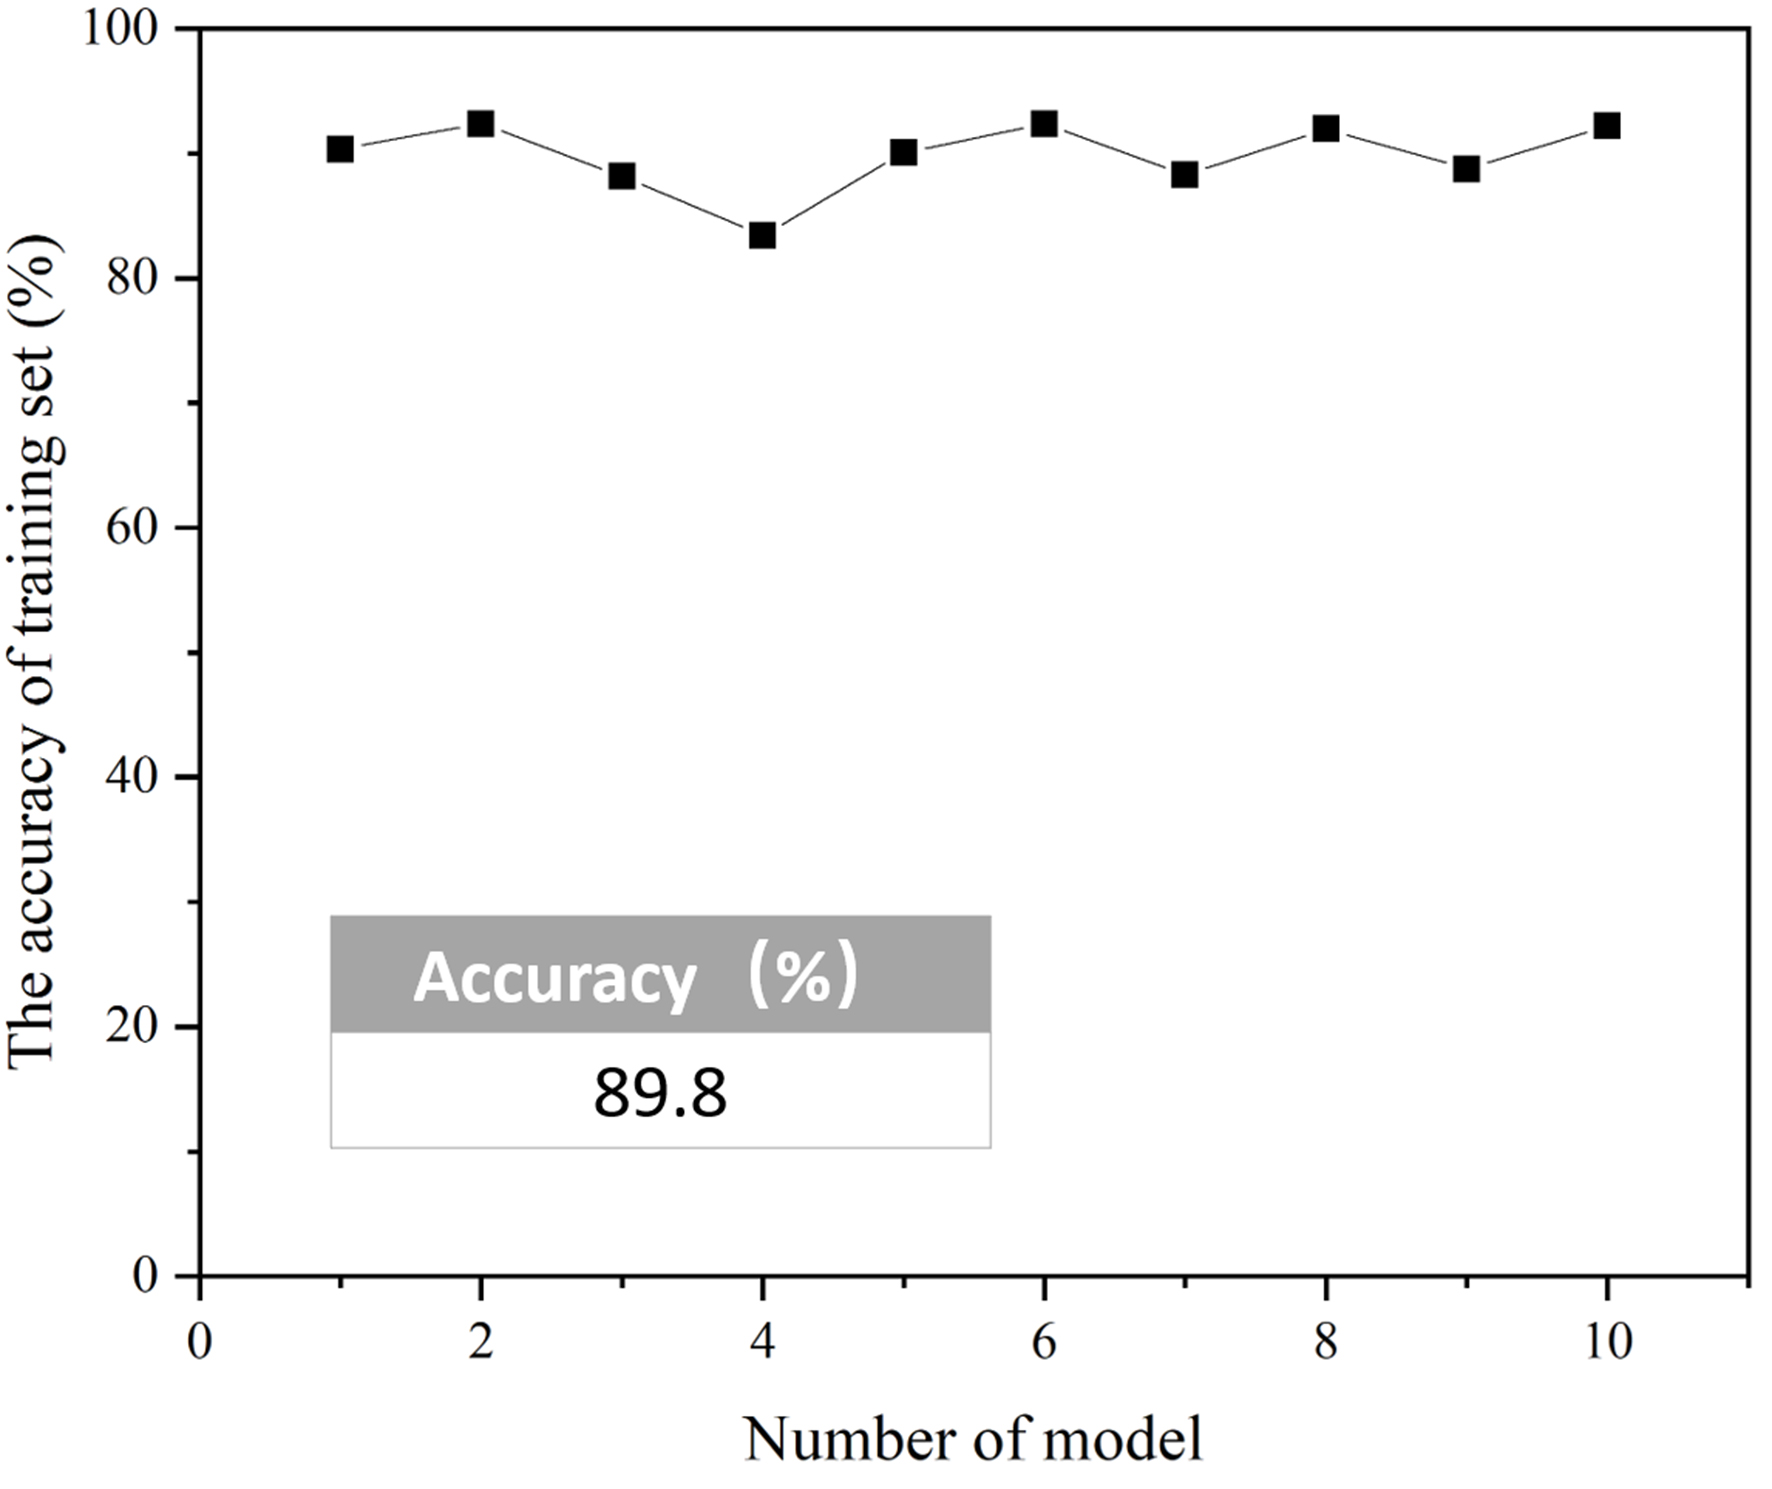
Figure 11. Distribution of predictive accuracy for the regression model test set of critical projectile fracture penetration velocity (final optimized model) for G33 ultra-high-strength steel.
Selected experimental and predicted results for the critical projectile fracture penetration velocity of G33 ultra-high-strength steel
| ID | Heat treatment process | Experimental results (m/s) | Predicted result (m/s) | Error rate (%) |
| #6 | 900 °C/1 h + OQ + 400 °C/2 h + AC | 713 | 617 | 13.46 |
| #50 | 900 °C/1 h + OQ + -73 °C/1 h + 560 °C/2 h + AC | 705 | 732 | 6.67 |
| #55 | 1,050 °C/15 h + FC | 720 | 708 | 1.67 |
| #58 | 900 °C/1 h + FC | 795 | 733 | 7.80 |
| #84 | 1,150 °C/1 h + OQ + -73 °C/2 h + 200 °C/4 h + AC | 795 | 723 | 9.06 |
Feature interpretability and physical mechanisms
In materials informatics, model interpretability is essential for guiding material design. Therefore, SHapley Additive exPlanations (SHAP) analysis was performed on the nine key input features retained after feature selection to examine whether the proposed two-stage framework captured meaningful structure–property relationships. As shown in Supplementary Figure 10, the SHAP results indicate that the penetration response is mainly controlled by high-strain-rate mechanical properties, while quasi-static properties and impact velocity play secondary roles. Among all features, Dynamic Tensile Elongation at 2,000 s-1 shows the highest importance, suggesting that dynamic ductility strongly affects plastic energy dissipation and resistance to back-face tearing or spalling under impact loading. Dynamic Compressive Yield Strengths at 5,000 s-1 and 3,000 s-1 are the next most influential features, reflecting their role in resisting localized plastic deformation and delaying adiabatic shear band formation during high-rate compression. In contrast, the lower importance of Impact Velocity and Quasi-Static Tensile Yield Strength further suggests that terminal ballistic performance is governed primarily by dynamic, rather than quasi-static, mechanical responses. These results confirm that the model predictions are physically consistent with established mechanisms of dynamic impact and fracture.
CONCLUSIONS
In summary, this study established a robust two-stage machine-learning framework to rapidly evaluate the performance of extreme service materials from their conventional mechanical properties. This approach effectively overcomes the data scarcity inherent in penetration testing by integrating chaos-based global optimization with high-throughput finite element simulations. The dual-stage architecture minimizes feature redundancy while successfully mapping standard mechanical inputs to complex terminal responses such as penetration occurrence and critical fracture velocity. Validated on G33 ultra-high-strength steel, the model demonstrated high predictive accuracy and consistency. This framework offers a highly transferable and practical strategy for accelerating the design, selection, and performance assessment of advanced materials for extreme-impact environments.
DECLARATIONS
Authors’ contributions
Writing - original draft preparation, formal analysis, investigation, data curation, visualization: Wei, Q.
Writing - original draft preparation, conceptualization, methodology, formal analysis, data curation, supervision: Zhao, P.
Writing - original draft preparation, data curation: Hao, Q.
Writing - original draft preparation, formal analysis, investigation, data curation, visualization: Chen, W.
Project administration, funding acquisition, supervision: Zhang, H.; Wang, Y.; Cheng, X.
All authors have read and agreed to the published version of the manuscript.
Availability of data and materials
The data supporting the findings of this study are available from the corresponding author upon reasonable request.
AI and AI-assisted tools statement
During the preparation of this manuscript, the AI tool Google Gemini (Version Gemini 3.1 Pro, incorporating the Nano Banana image generation model) was used solely for the initial conceptualization and foundational layout of the Graphical Abstract. The tool did not influence the study design, data collection, analysis, interpretation, or the scientific content of the work. The AI-generated output served only as a base template, which the authors subsequently modified by integrating authentic experimental scene photographs and specific research data. All authors have rigorously verified the final output and take full responsibility for the accuracy, integrity, ethical compliance, and final content of the resulting composite image, ensuring that it faithfully represents the core findings of this manuscript without any copyright infringement.
Financial support and sponsorship
The work was supported by the National Key Laboratory Foundation of Science and Technology on Materials under Shock and Impact (6142902240301), and the Fundamental Research Funds for the Central Universities.
Conflicts of interest
All authors declared that there are no conflicts of interest.
Ethical approval and consent to participate
Not applicable.
Consent for publication
Not applicable.
Copyright
© The Author(s) 2026.
Supplementary Materials
REFERENCES
1. Kim, Y.; Kim, K.; Song, Y.; Park, J. H.; Lee, K. 2.47 GPa grade ultra-strong 15Co-12Ni secondary hardening steel with superior ductility and fracture toughness. J. Mater. Sci. Technol. 2021, 66, 36-45.
2. Li, J.; Zhan, D.; Jiang, Z.; Zhang, H.; Yang, Y.; Zhang, Y. Progress on improving strength-toughness of ultra-high strength martensitic steels for aerospace applications: a review. J. Mater. Res. Technol. 2023, 23, 172-90.
3. Hammarberg, S.; Kajberg, J.; Larsson, S.; Jonsén, P. Ultra high strength steel sandwich for lightweight applications. SN. Appl. Sci. 2020, 2, 2773.
4. Zhao, J.; Jiang, Z. Thermomechanical processing of advanced high strength steels. Prog. Mater. Sci. 2018, 94, 174-242.
5. Hörhold, R.; Müller, M.; Merklein, M.; Meschut, G. Mechanical properties of an innovative shear-clinching technology for ultra-high-strength steel and aluminium in lightweight car body structures. Weld. World. 2016, 60, 613-20.
6. Hilditch, T. B.; de Souza, T.; Hodgson, P. D. 2 - Properties and automotive applications of advanced high-strength steels (AHSS). In Welding and joining of advanced high strength steels (AHSS). Elsevier; 2015. pp. 9-28.
7. Seede, R.; Shoukr, D.; Zhang, B.; et al. An ultra-high strength martensitic steel fabricated using selective laser melting additive manufacturing: densification, microstructure, and mechanical properties. Acta. Mater. 2020, 186, 199-214.
8. Gao, Y.; Liu, S.; Hu, X.; et al. A novel low cost 2000 MPa grade ultra-high strength steel with balanced strength and toughness. Mater. Sci. Eng. A. 2019, 759, 298-302.
9. Xue, J.; Zhang, Y.; Guo, W.; et al. Significantly improving mechanical properties of ultra-high strength steel joints via optimal in-situ post-weld heat treatment. J. Mater. Process. Technol. 2025, 337, 118741.
10. Chen, S.; Zhu, J.; Liu, T.; et al. Machine learning optimized by sparrow search for co-design of heat treatment process, microstructure, and properties in ultra-high-strength maraging steels. J. Mater. Res. Technol. 2025, 39, 8500-11.
11. Ramprasad, R.; Batra, R.; Pilania, G.; Mannodi-Kanakkithodi, A.; Kim, C. Machine learning in materials informatics: recent applications and prospects. npj. Comput. Mater. 2017, 3, 56.
12. Su, Y.; Fu, H.; Bai, Y.; Jiang, X.; Xie, J. Progress in materials genome engineering in China. Acta. Metall. Sin. 2020, 56, 1313-23.
13. Agrawal, A.; Choudhary, A. Perspective: Materials informatics and big data: realization of the “fourth paradigm” of science in materials science. APL. Mater. 2016, 4, 053208.
14. Yang, R. X.; McCandler, C. A.; Andriuc, O.; et al. Big data in a nano world: a review on computational, data-driven design of nanomaterials structures, properties, and synthesis. ACS. Nano. 2022, 16, 19873-91.
15. Merayo, D.; Rodriguez-Prieto, A.; Camacho, A. M. Prediction of physical and mechanical properties for metallic materials selection using big data and artificial neural networks. IEEE. Access. 2020, 8, 13444-56.
16. Guo, S.; Yu, J.; Liu, X.; Wang, C.; Jiang, Q. A predicting model for properties of steel using the industrial big data based on machine learning. Comput. Mater. Sci. 2019, 160, 95-104.
17. Yang, Y.; Zhao, L.; Han, C.; et al. Taking materials dynamics to new extremes using machine learning interatomic potentials. J. Mater. Inf. 2021, 1, 10.
18. He, L.; Chen, X.; Wang, Z. Study on the penetration performance of concept projectile for high-speed penetration (CPHP). Int. J. Impact. Eng. 2016, 94, 1-12.
19. Kılıç, N.; Bedir, S.; Erdik, A.; Ekici, B.; Taşdemirci, A.; Güden, M. Ballistic behavior of high hardness perforated armor plates against 7.62 mm armor piercing projectile. Mater. Design. 2014, 63, 427-38.
20. Børvik, T.; Dey, S.; Olovsson, L. Penetration of granular materials by small-arms bullets. Int. J. Impact. Eng. 2015, 75, 123-39.
21. Manes, A.; Serpellini, F.; Pagani, M.; Saponara, M.; Giglio, M. Perforation and penetration of aluminium target plates by armour piercing bullets. Int. J. Impact. Eng. 2014, 69, 39-54.
22. Zhu, F.; Chen, Y.; Zhu, G. Numerical simulation study on penetration performance of depleted Uranium (DU) alloy fragments. Def. Technol. 2021, 17, 50-5.
23. Mao, L.; Zhao, W.; Liu, C.; Pang, Z.; Du, Z. Fracture and damage evolution of metal molybdenum based on a modified Johnson–Cook model under high-temperature conditions. Int. J. Impact. Eng. 2026, 212, 105663.
24. Huang, Z.; Gao, L.; Wang, Y.; Wang, F. Determination of the Johnson-Cook constitutive model parameters of materials by cluster global optimization algorithm. J. Mater. Eng. Perform. 2016, 25, 4099-107.
26. Geisel, T.; Fairen, V. Statistical properties of chaos in Chebyshev maps. Phys. Lett. A. 1984, 105, 263-6.
27. He, D.; He, C.; Jiang, L. G.; Zhu, H. W.; Hu, G. R. Chaotic characteristics of a one-dimensional iterative map with infinite collapses. IEEE. Trans. Circuits. Syst. I. Fundam. Theory. Appl. 2001, 48, 900-6.
28. Yang, D.; Li, G.; Cheng, G. On the efficiency of chaos optimization algorithms for global optimization. Chaos. Solitons. Fractals. 2007, 34, 1366-75.
29. Shrot, A.; Bäker, M. Determination of Johnson-Cook parameters from machining simulations. Comput. Mater. Sci. 2012, 52, 298-304.
Cite This Article
How to Cite
Download Citation
Export Citation File:
Type of Import
Tips on Downloading Citation
Citation Manager File Format
Type of Import
Direct Import: When the Direct Import option is selected (the default state), a dialogue box will give you the option to Save or Open the downloaded citation data. Choosing Open will either launch your citation manager or give you a choice of applications with which to use the metadata. The Save option saves the file locally for later use.
Indirect Import: When the Indirect Import option is selected, the metadata is displayed and may be copied and pasted as needed.
About This Article
Special Topic
Copyright

Data & Comments
Data
0


Comments
Comments must be written in English. Spam, offensive content, impersonation, and private information will not be permitted. If any comment is reported and identified as inappropriate content by OAE staff, the comment will be removed without notice. If you have any queries or need any help, please contact us at [email protected].