

Exploring the Pareto front of strength-conductivity trade-off: interpretable machine learning for property prediction and composition design in high-strength high-conductivity Cu alloys
 0
0 
Abstract
High ultimate tensile strength (UTS) and high electrical conductivity (EC) copper alloy is a key material in upgrading traditional manufacturing industries. Since a trade-off exists between UTS and EC, the design of new alloys balancing the two properties is a significant challenge. In this paper, to expedite the design of copper alloys with target properties, we integrated feature engineering, machine learning (ML), and swarm intelligence algorithms to construct a paradigm that includes model construction, property prediction, and composition inverse design. By introducing and selecting relevant physical features, a high-quality ML model relating composition, physical features, and properties in copper alloys was constructed, with an error of less than 9%. Based on the well-constructed model, the physical features and elements that significantly affect the UTS and EC of copper alloys are identified by the Shapley additive explanations model. In addition, we investigated the alloying effects on the UTS and EC within the Cu-Cr-Zr-Mg system. Finally, using the multi-objective grey wolf optimizer algorithm, we designed several new alloys showing high UTS and high EC copper alloys and explored the Pareto frontier between UTS and EC, which provides a guide for developing new high-performance copper alloys.
Keywords
INTRODUCTION
High-strength and high-conductivity (HSHC) copper (Cu) alloy presents excellent mechanical properties and electrical conductivity (EC). It is a key material for many high-tech industries and has been widely used in various situations, such as new energy vehicles, aerospace, high-speed railroads, and electronic information manufacturing industry[1]. For instance, in the lead frame of integrated circuits (ICs), Cu alloys account for more than 80% and play a critical role in supporting the chip, connecting circuits, and dissipating heat. Hence, the requirement for the comprehensive properties of Cu alloys is gradually improved. In IC technology, the Cu alloys must satisfy the following criteria: EC ≥ 80 international annealed copper standard (%IACS), ultimate tensile strength (UTS) ≥ 600 MPa, and good heat dissipation capabilities[2]. However, there exists a trade-off between UTS and EC in Cu alloys. Shan et al. investigated the mechanical properties of Cu-Cr alloys and found that adding Cr increases the strength of the alloys due to the existence of Cr-containing precipitation[3]. However, it also increases the lattice distortion and hence decreases the EC. Mishnev et al. discovered that the yield strength of Cu-0.87Cr-0.06Zr (wt.%) alloys increased from 215 to 535 MPa after eight equal channel angular pressing at 473 K[4]. However, the formation of ultrafine grains with high dislocation density decreased EC from 80 to 70 %IACS. Therefore, knowing how to minimize conductivity loss while improving the strength of Cu alloys is vital. However, the traditional try-error method of designing high-performance alloys is time-consuming, expensive, and full of coincidence; hence, it cannot meet the desire to design new high-performance Cu alloys.
In recent years, a new paradigm of data-driven materials design has emerged and has been widely applied across various fields, including photovoltaic materials[5], lithium-ion batteries[6], porous structural ceramics[7], superalloys[8], and high-entropy alloys[9]. For example, using machine learning (ML) approaches, Jin et al. designed several novel high-performance two-dimensional (2D) photovoltaic materials that exhibited significantly higher conversion efficiencies compared with existing materials[10]. OJih et al. efficiently identified potential materials with high thermal capacity by training multiple ML models using high-quality data derived from density functional theory calculations[11]. In addition to materials discovery, ML models can also be used to optimize processing parameters. Ghorbani et al. employed ML to accelerate the design of magnesium alloys[12], while Zhang et al. established a relationship between the EC of a Cu-0.23Cr-0.20Zr-0.10V (wt.%) alloy and four processing parameters[13].
ML for Cu alloy design is rapidly advancing. Wang et al. used a back-propagation neural network (BPNN) to establish two prediction models, composition → property and property → composition using about 300 data points[14]. With the help of the two models, eight new Cu alloys with UTS of 600-950 MPa and EC of 50.0 %IACS were designed, and the error between the predicted and target properties was < 6%. Ozerdem et al. successfully predicted the yield strength, tensile strength, and elongation of Cu-Sn-Pb-Zn-Ni alloys by ML based on 21 data points[15]. By introducing physical features, Zhao et al. proposed a ML model to identify the relationship between composition and properties (EC and hardness) based on about 100 data points and designed five new alloys showing both high hardness and EC[16]. One of the challenges in ML is the lack of data; generally, a limited dataset results in lower accuracy for the ML model.
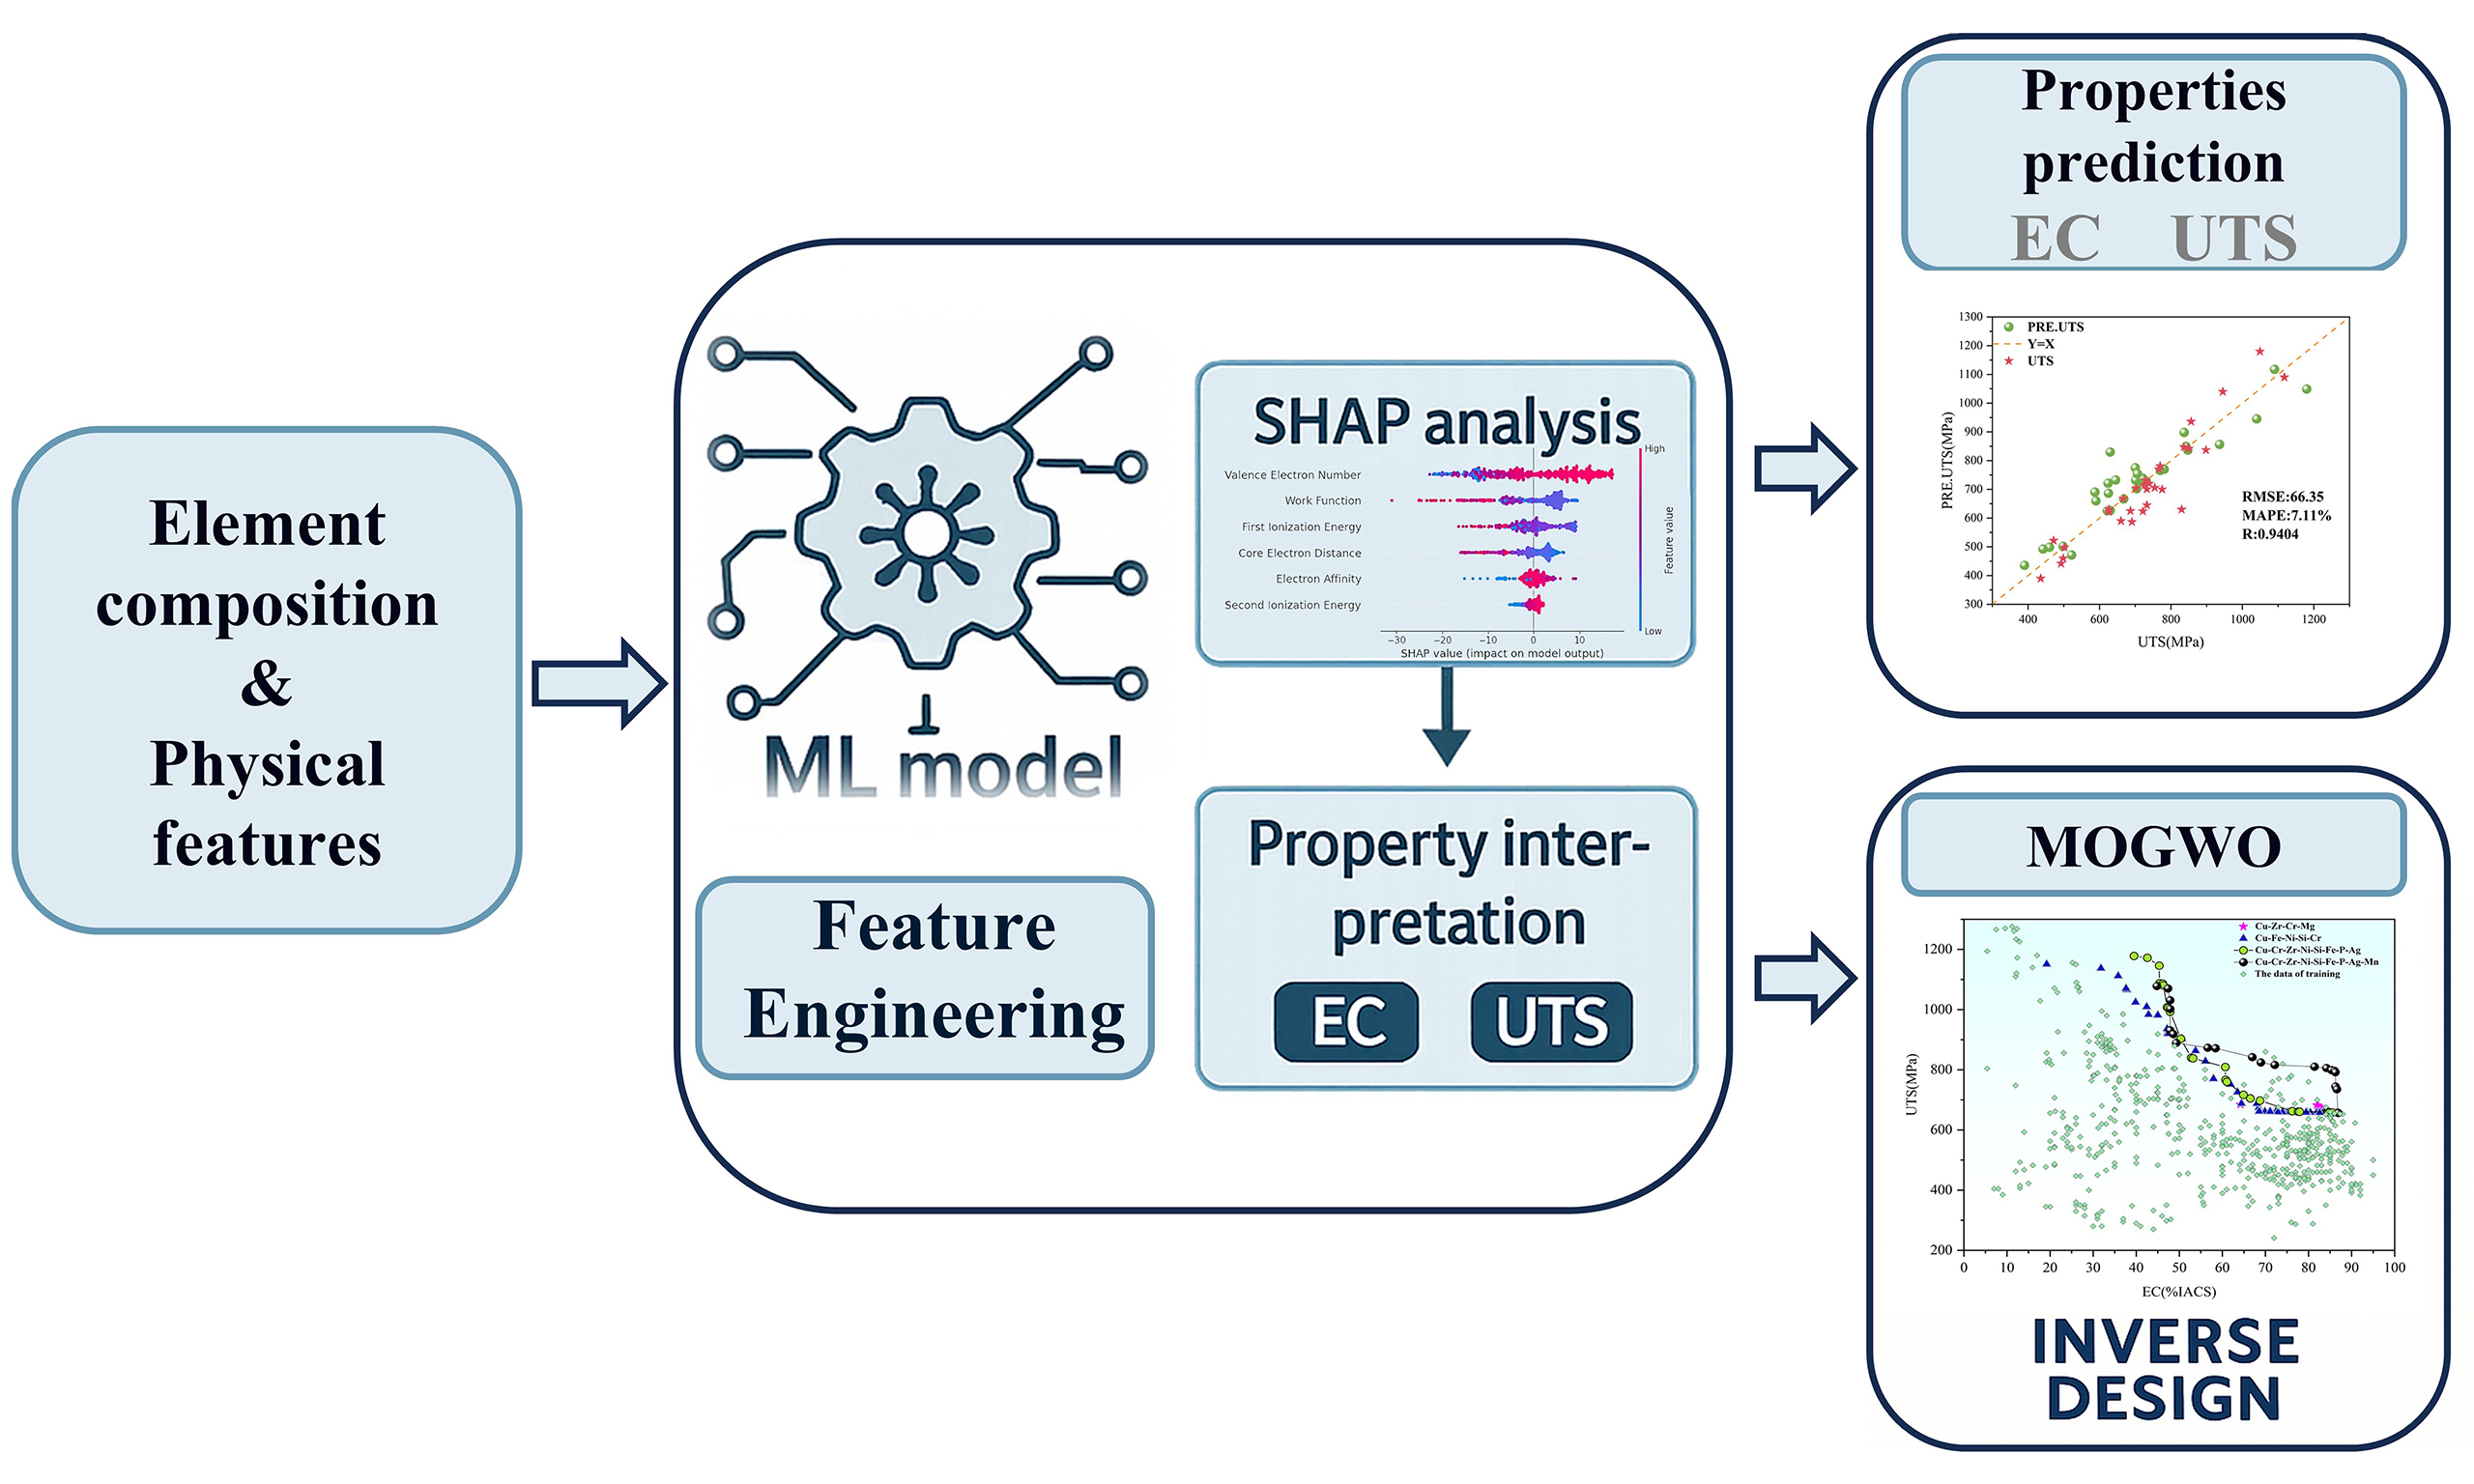
In this work, we propose a multi-objective inverse design framework by integrating an experimentally trained Gaussian process regression (EXP-GPR) model with a multi-objective grey wolf optimizer (MOGWO), enabling simultaneous optimization of HSHC Cu alloys. To further improve the accuracy and generalization ability of the model, we collected and curated a large dataset consisting of approximately 600 experimentally validated data points, and introduced the element Composition and physical features into the model. Unlike traditional screening-based approaches, our framework follows a performance-driven inverse design strategy: EC and UTS are predefined as optimization objectives, and the model searches the compositional space for alloys that satisfy these targets under user-defined constraints. As shown in Figure 1, a high-quality ML model was constructed and applied to both property interpretation and composition design. Specifically, Shapley additive explanations (SHAP) analysis was employed to determine the significance of input variables on the model’s output performance and unveil alloying effects in the Cu–Cr–Zr–Mg system, while a MOGWO algorithm was coupled with the EXP-GPR model to enable flexible inverse design under compositional constraints. Compared with traditional strategies, MOGWO handles multiple objectives and constraints more effectively. Additionally, SHAP improves the model’s interpretability, helping guide practical alloy design.
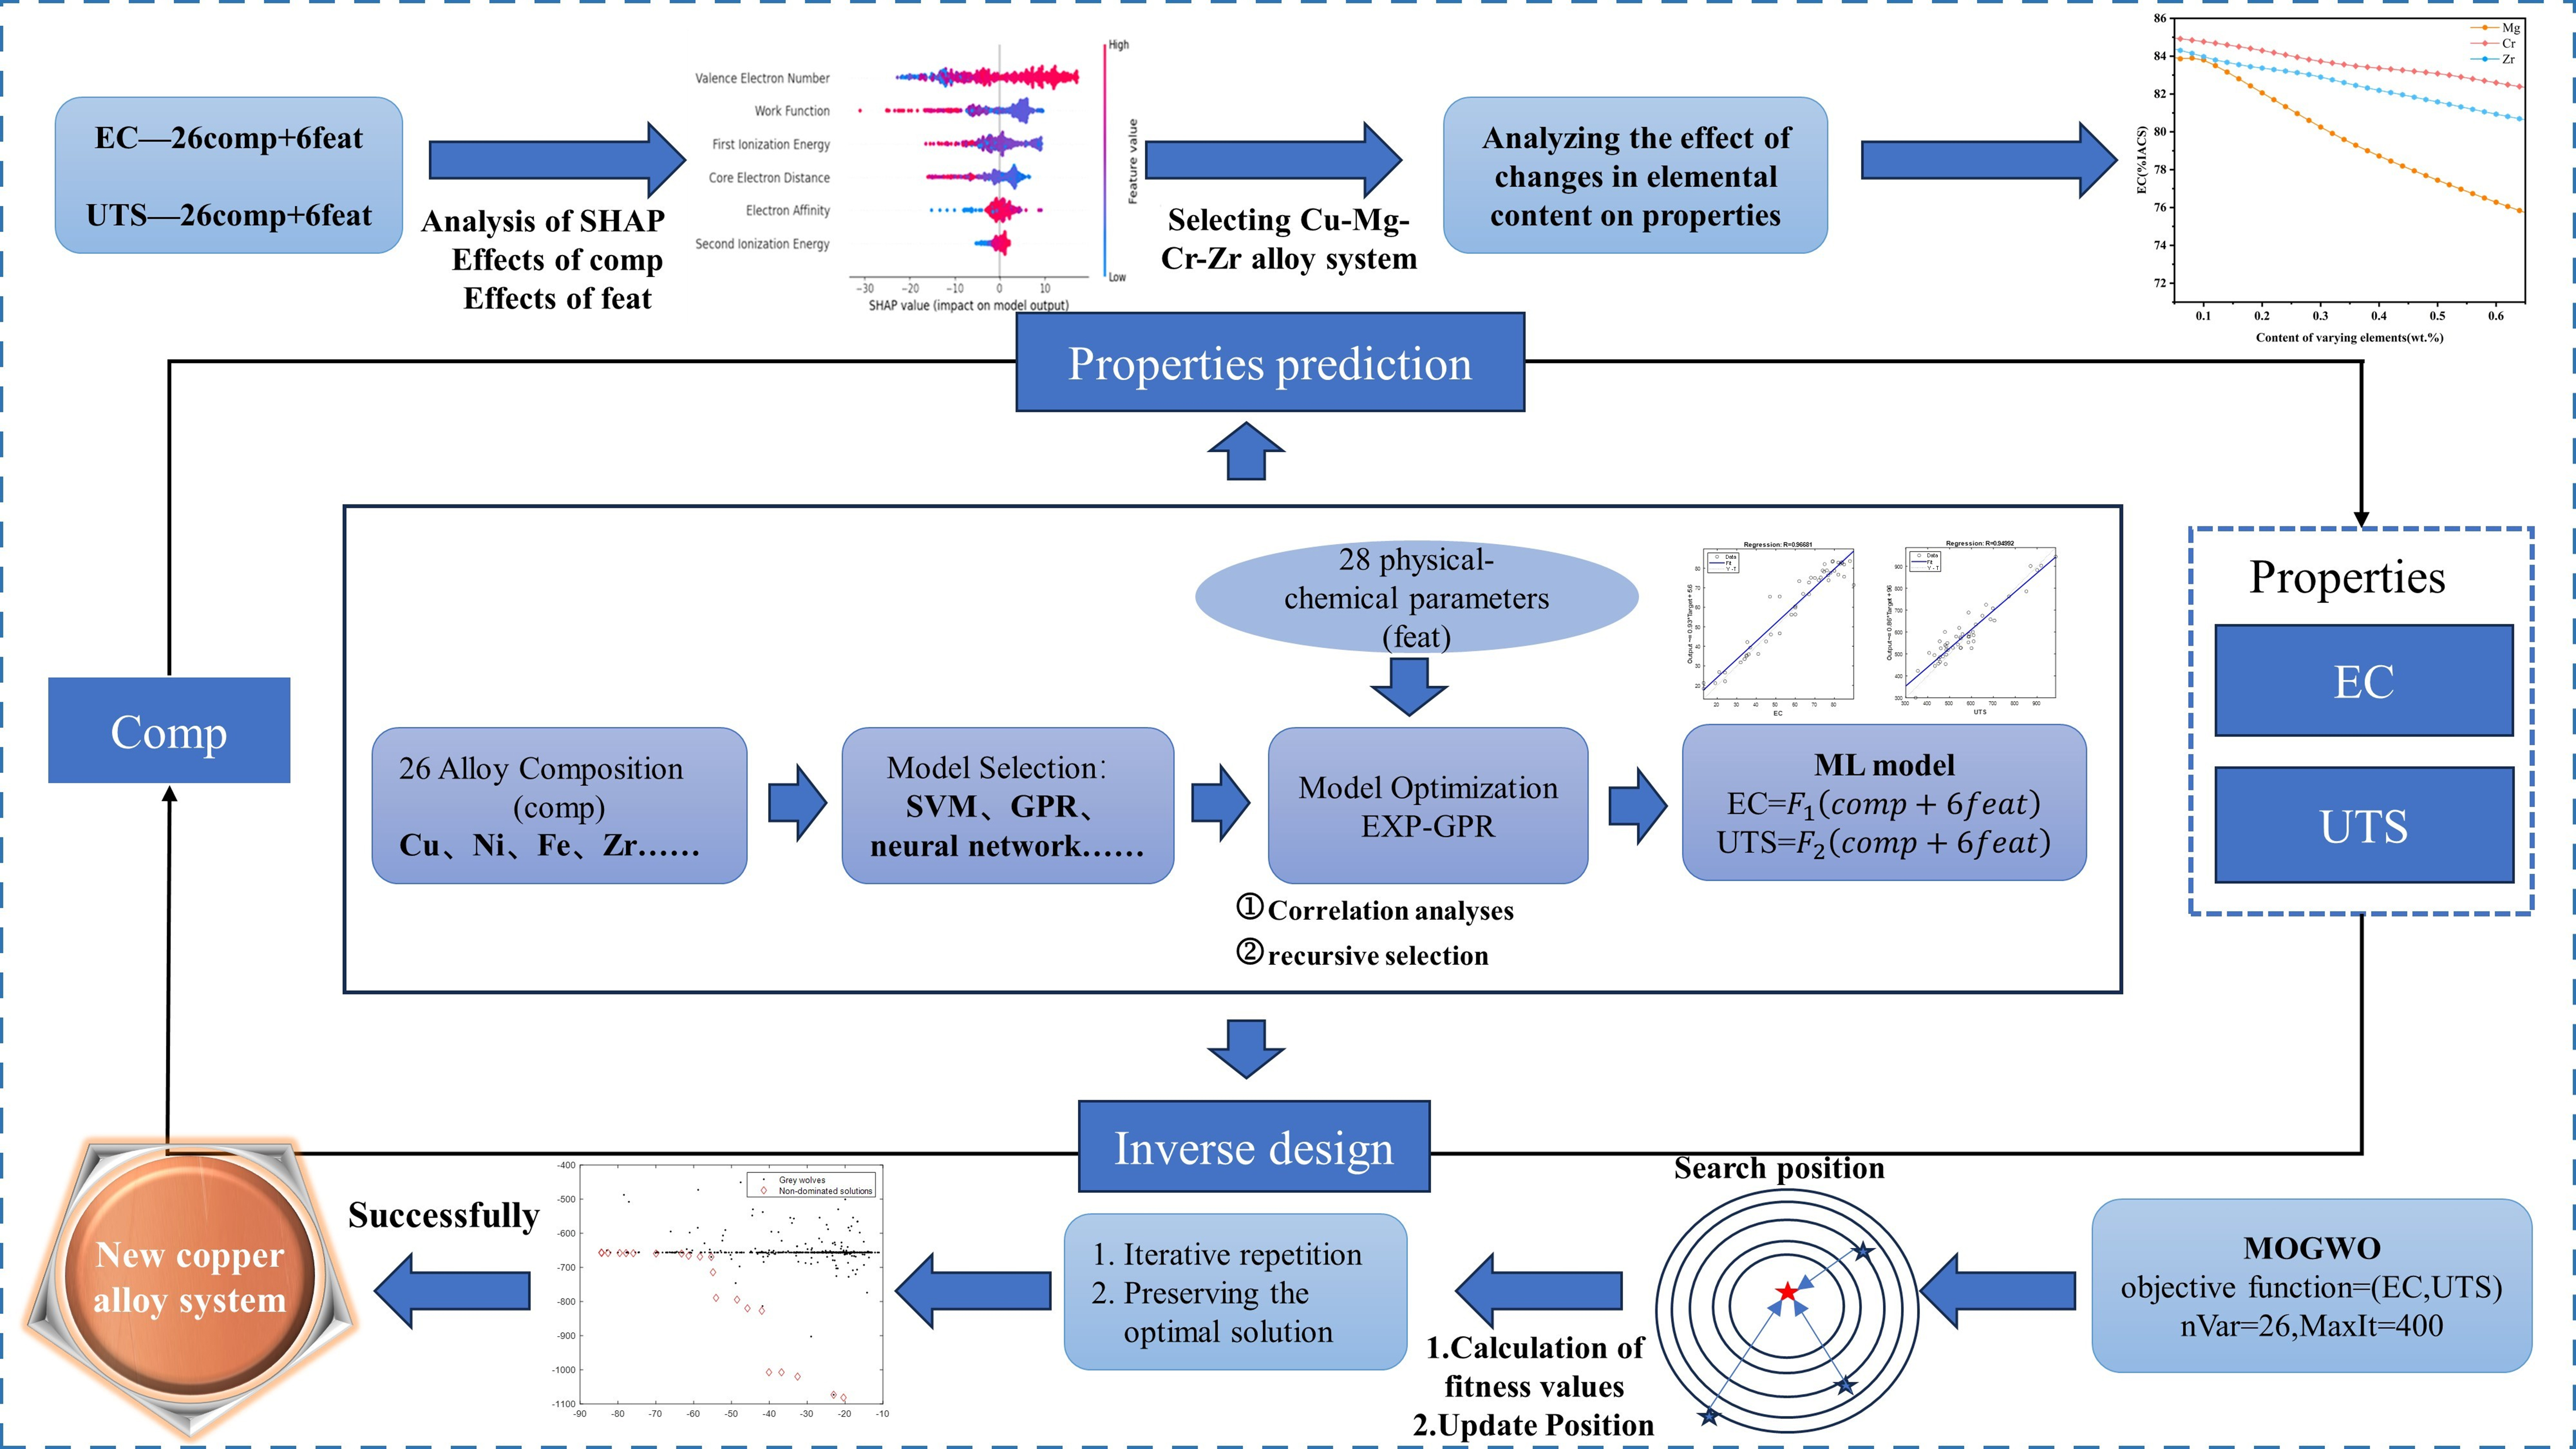
Figure 1. Workflow of ML-assisted copper alloy design. ML: Machine learning; EC: electrical conductivity; UTS: ultimate tensile strength; SHAP: Shapley additive explanations; SVM: support vector machine; GPR: Gaussian process regression; EXP-GPR: experimentally trained Gaussian process regression; MOGWO: multi-objective grey wolf optimizer.
MATERIALS AND METHODS
Data preparation
Due to the lack of standardized and complete reporting of processing parameters in the literature and patents, process-related information (e.g., solution treatment, aging time, cold working) was not included in our model. Moreover, many of the reported property data are based on optimized processes but lack consistent documentation. Therefore, this work focuses on capturing the composition–property relationship as a practical and effective entry point for guiding alloy design.
We collected 600 datasets from numerous papers and patents in this work. The dataset includes 26 elements (compositions), 27 physicochemical parameters for each element[17], and two target properties: UTS and EC. Figure 2A shows the distribution of elemental contents (wt.%) across the dataset. Figure 2A shows that the content of Ni, Zn, and Sn varies in an extensive range, while the content of the other elements is mostly within 3 wt.%. In terms of data density, elements such as Fe, Ni, Si, Mg, and Cr are the most frequently occurring elements in the dataset. In contrast, elements such as Ag, Al, Zr, and Mn appear in only a limited number of samples, typically at low concentrations below 1.5 wt.%, indicating their roles as secondary strengthening elements.
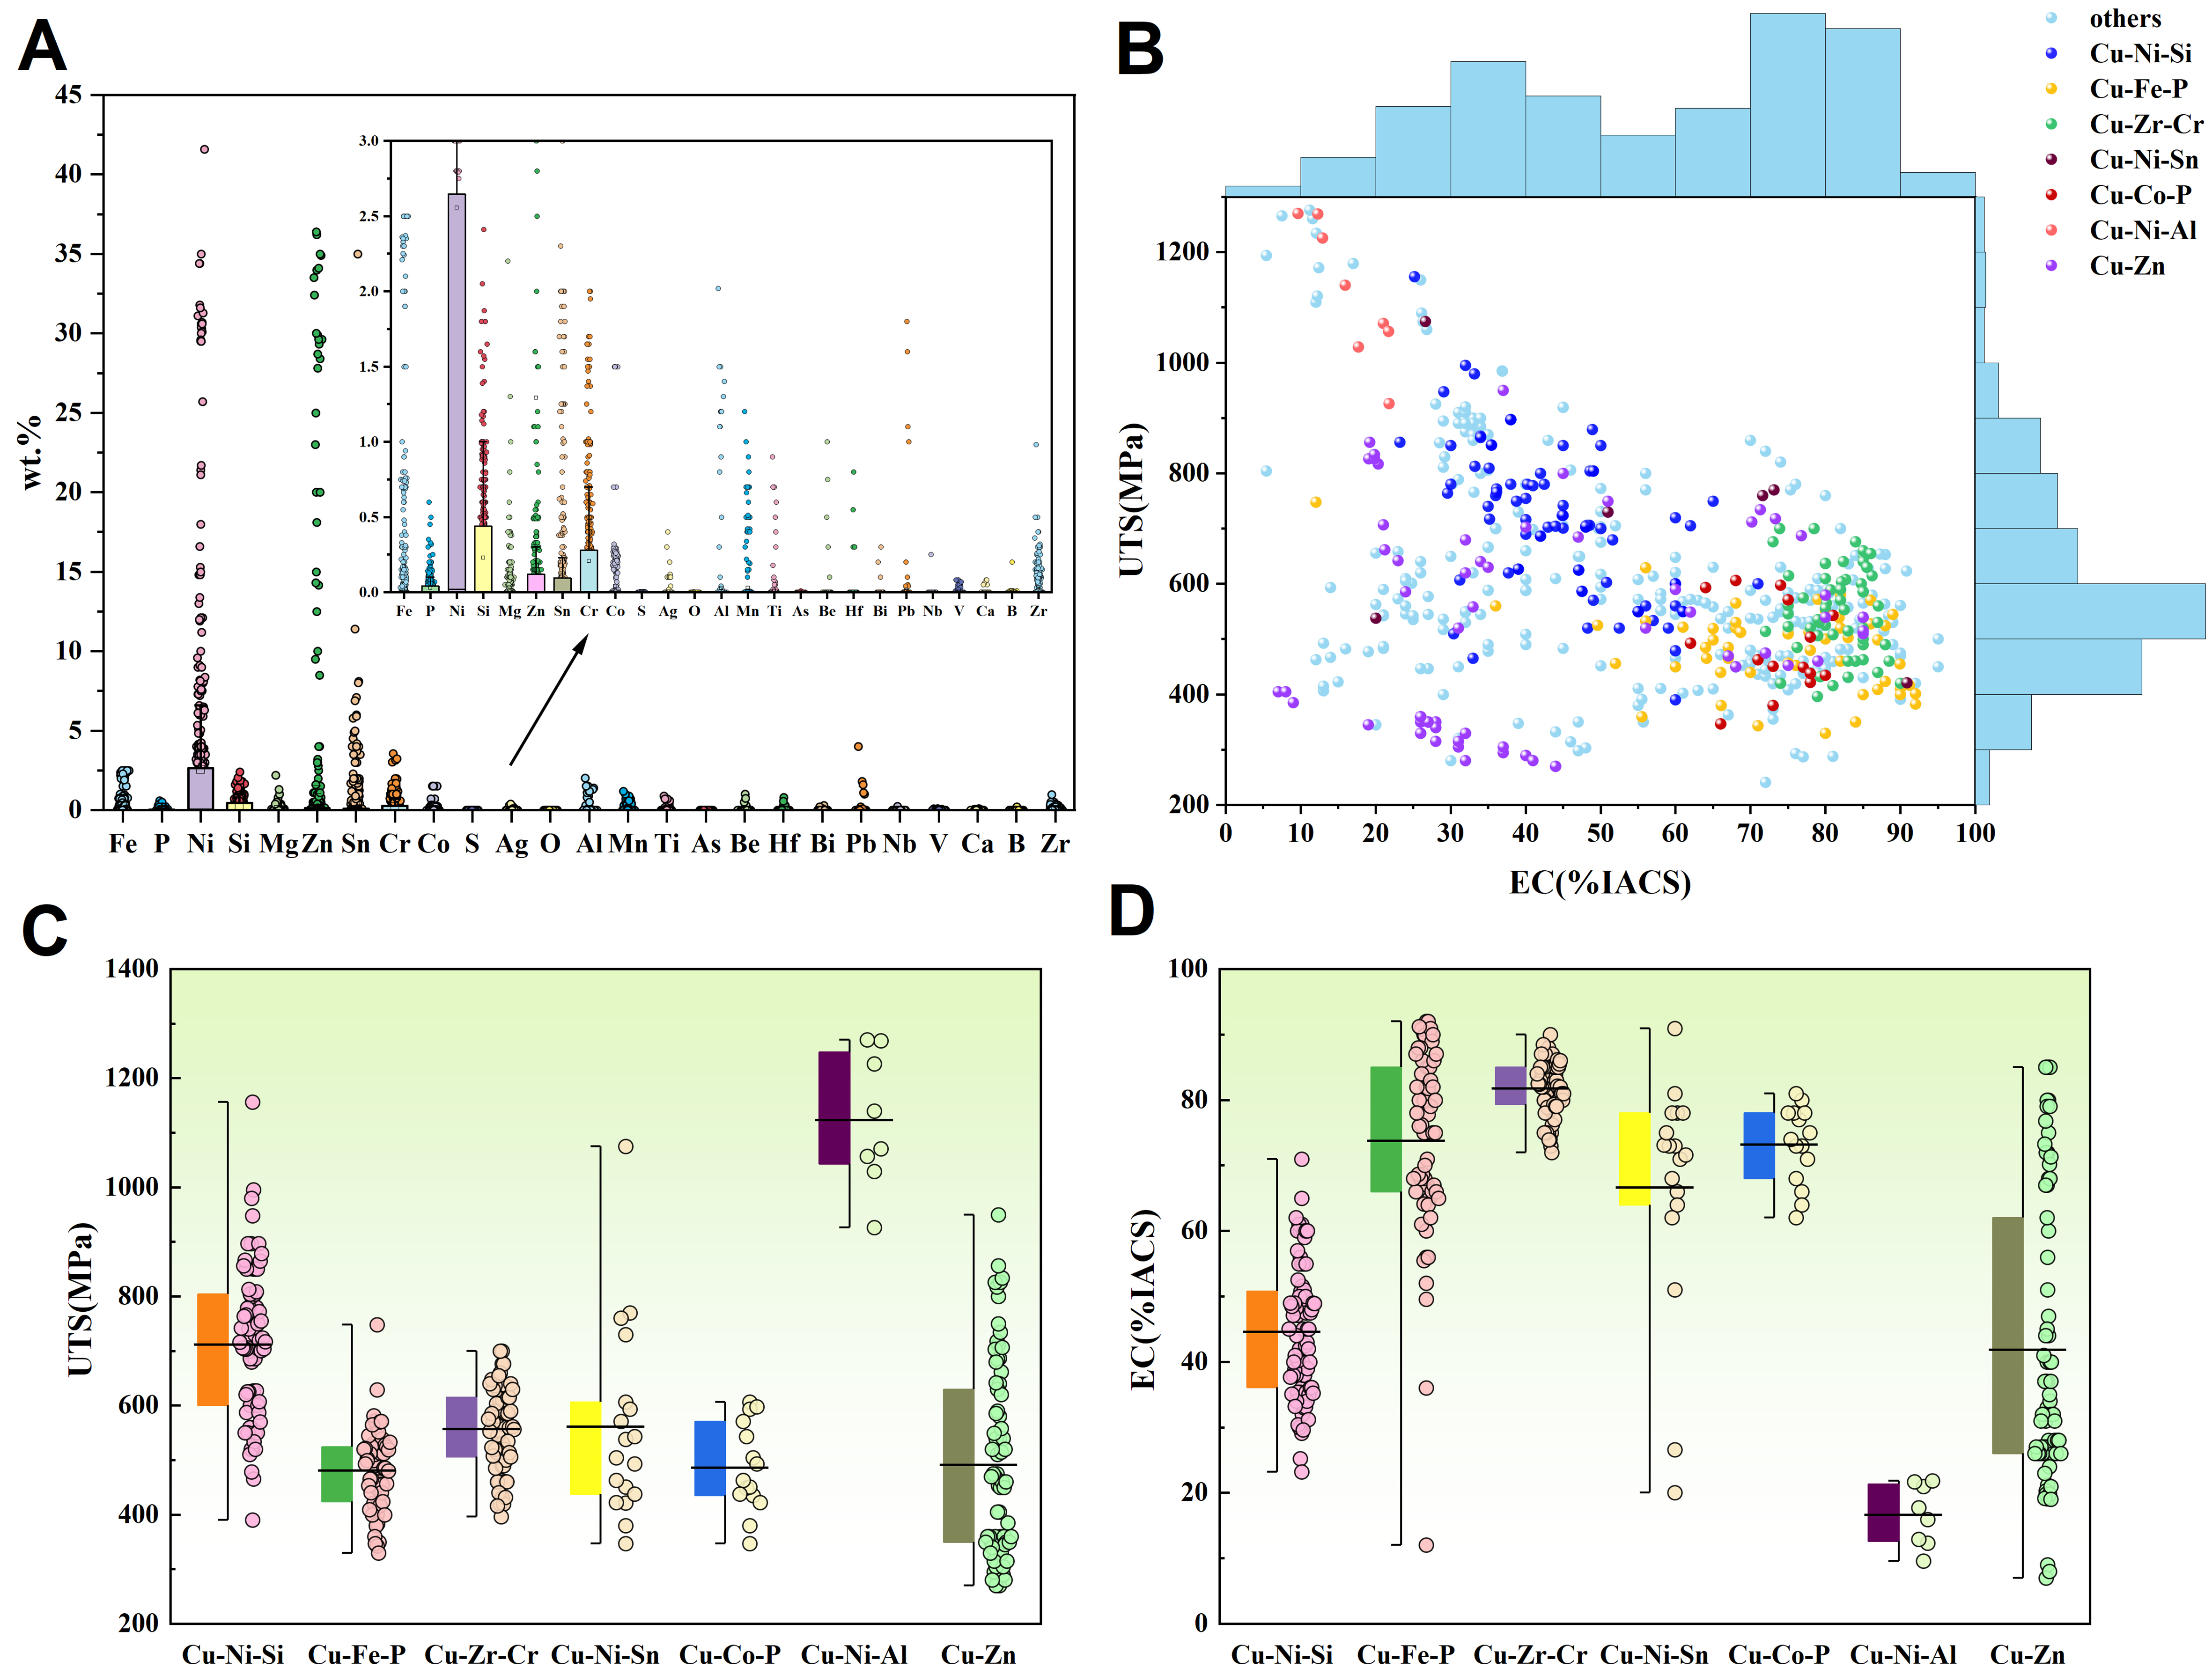
Figure 2. Alloy element content and corresponding property data. (A) Elemental content; (B) Distribution of property data; (C) EC and (D) UTS of seven classical systems. EC: Electrical conductivity; UTS: ultimate tensile strength; %IACS: international annealed copper standard.
In addition, we analyzed the distribution of the UTS and EC, and the results are visualized in Figure 2B. It can be seen that the tensile strength is mainly concentrated in the range of 400-600 MPa, while the EC is mostly lower than 80 %IACS. If we use the UTS of 600 MPa and the EC of 80 %IACS as the baseline for performance evaluation, only a few alloys can meet this high standard of property requirements. Hence, designing new alloys to meet the requirements using the trial-and-error method is challenging.
In HSHC Cu alloys, there are three main systems: Cu-Cr-Zr, Cu-Ni-Si, and Cu-Fe-P[18]. In addition, Cu-Fe-Sn, Cu-Co-P, Cu-Ni-Al, and Cu-Zn show considerable UTS or EC. Hence, we analyzed the properties distribution of the systems mentioned above, as illustrated in Figure 2C and D. As shown, Cu-Fe-P, Cu-Cr-Zr, Cu-Ni-Sn, and Cu-Co-P exhibit high EC, while the strength is moderate. Cu-Ni-Si and Cu-Zn present moderate EC, while the average strength is considerable. Cu-Ni-Al exhibits high UTS, but it presents very low EC. In addition, the range of EC and UTS for Cu-Zn and Cu-Ni-Si is quite broad.
In addition, the physical features of alloys are evaluated using the arithmetic mean of elements[17]. In this work, there are 27 physicochemical parameters, including relative atomic mass, atomic radius, density, melting point, Pauling electronegativity, valence electron number, electron affinity, first ionization energy, second ionization energy, third ionization energy, molar volume, atomic number, boiling point, enthalpy of melting, enthalpy of vaporization, cohesive energy, work function, lattice constant a, lattice constant b, lattice constant c, core electron distance, Poisson’s ratio, Young’s modulus, rigidity modulus, nuclear charge rms, atomic concentration, are taken into consideration.
Data preparation and selection of ML algorithms
The algorithms evaluated in this work are divided into seven categories: linear regression (Linear), decision tree model (Tree), support vector machine regression (SVM), ensemble learning (Ensemble), Gaussian process regression (GPR), neural network (NN), and kernel regression (Kernel). Within each category, there are several subcategories, and 25 algorithms in total are taken into consideration. Firstly, 600 data points (composition and property) are randomly divided into two parts, of which 90% are training sets and the remaining 10% are test sets, and the construction and training of the above 25 ML models are carried out with 5-fold cross-validation. The algorithms here are all run with default parameter settings.
The root mean square error (RMSE) of the 25 ML models obtained after training is shown in Figure 3. This metric reflects the degree of deviation between the measured data and the true values, with a smaller RMSE indicating higher measurement accuracy. As shown in the figure, GPR with an exponential kernel function (EXP-GPR) performs best for both the UTS and EC of the alloys. The RMSE is defined as:
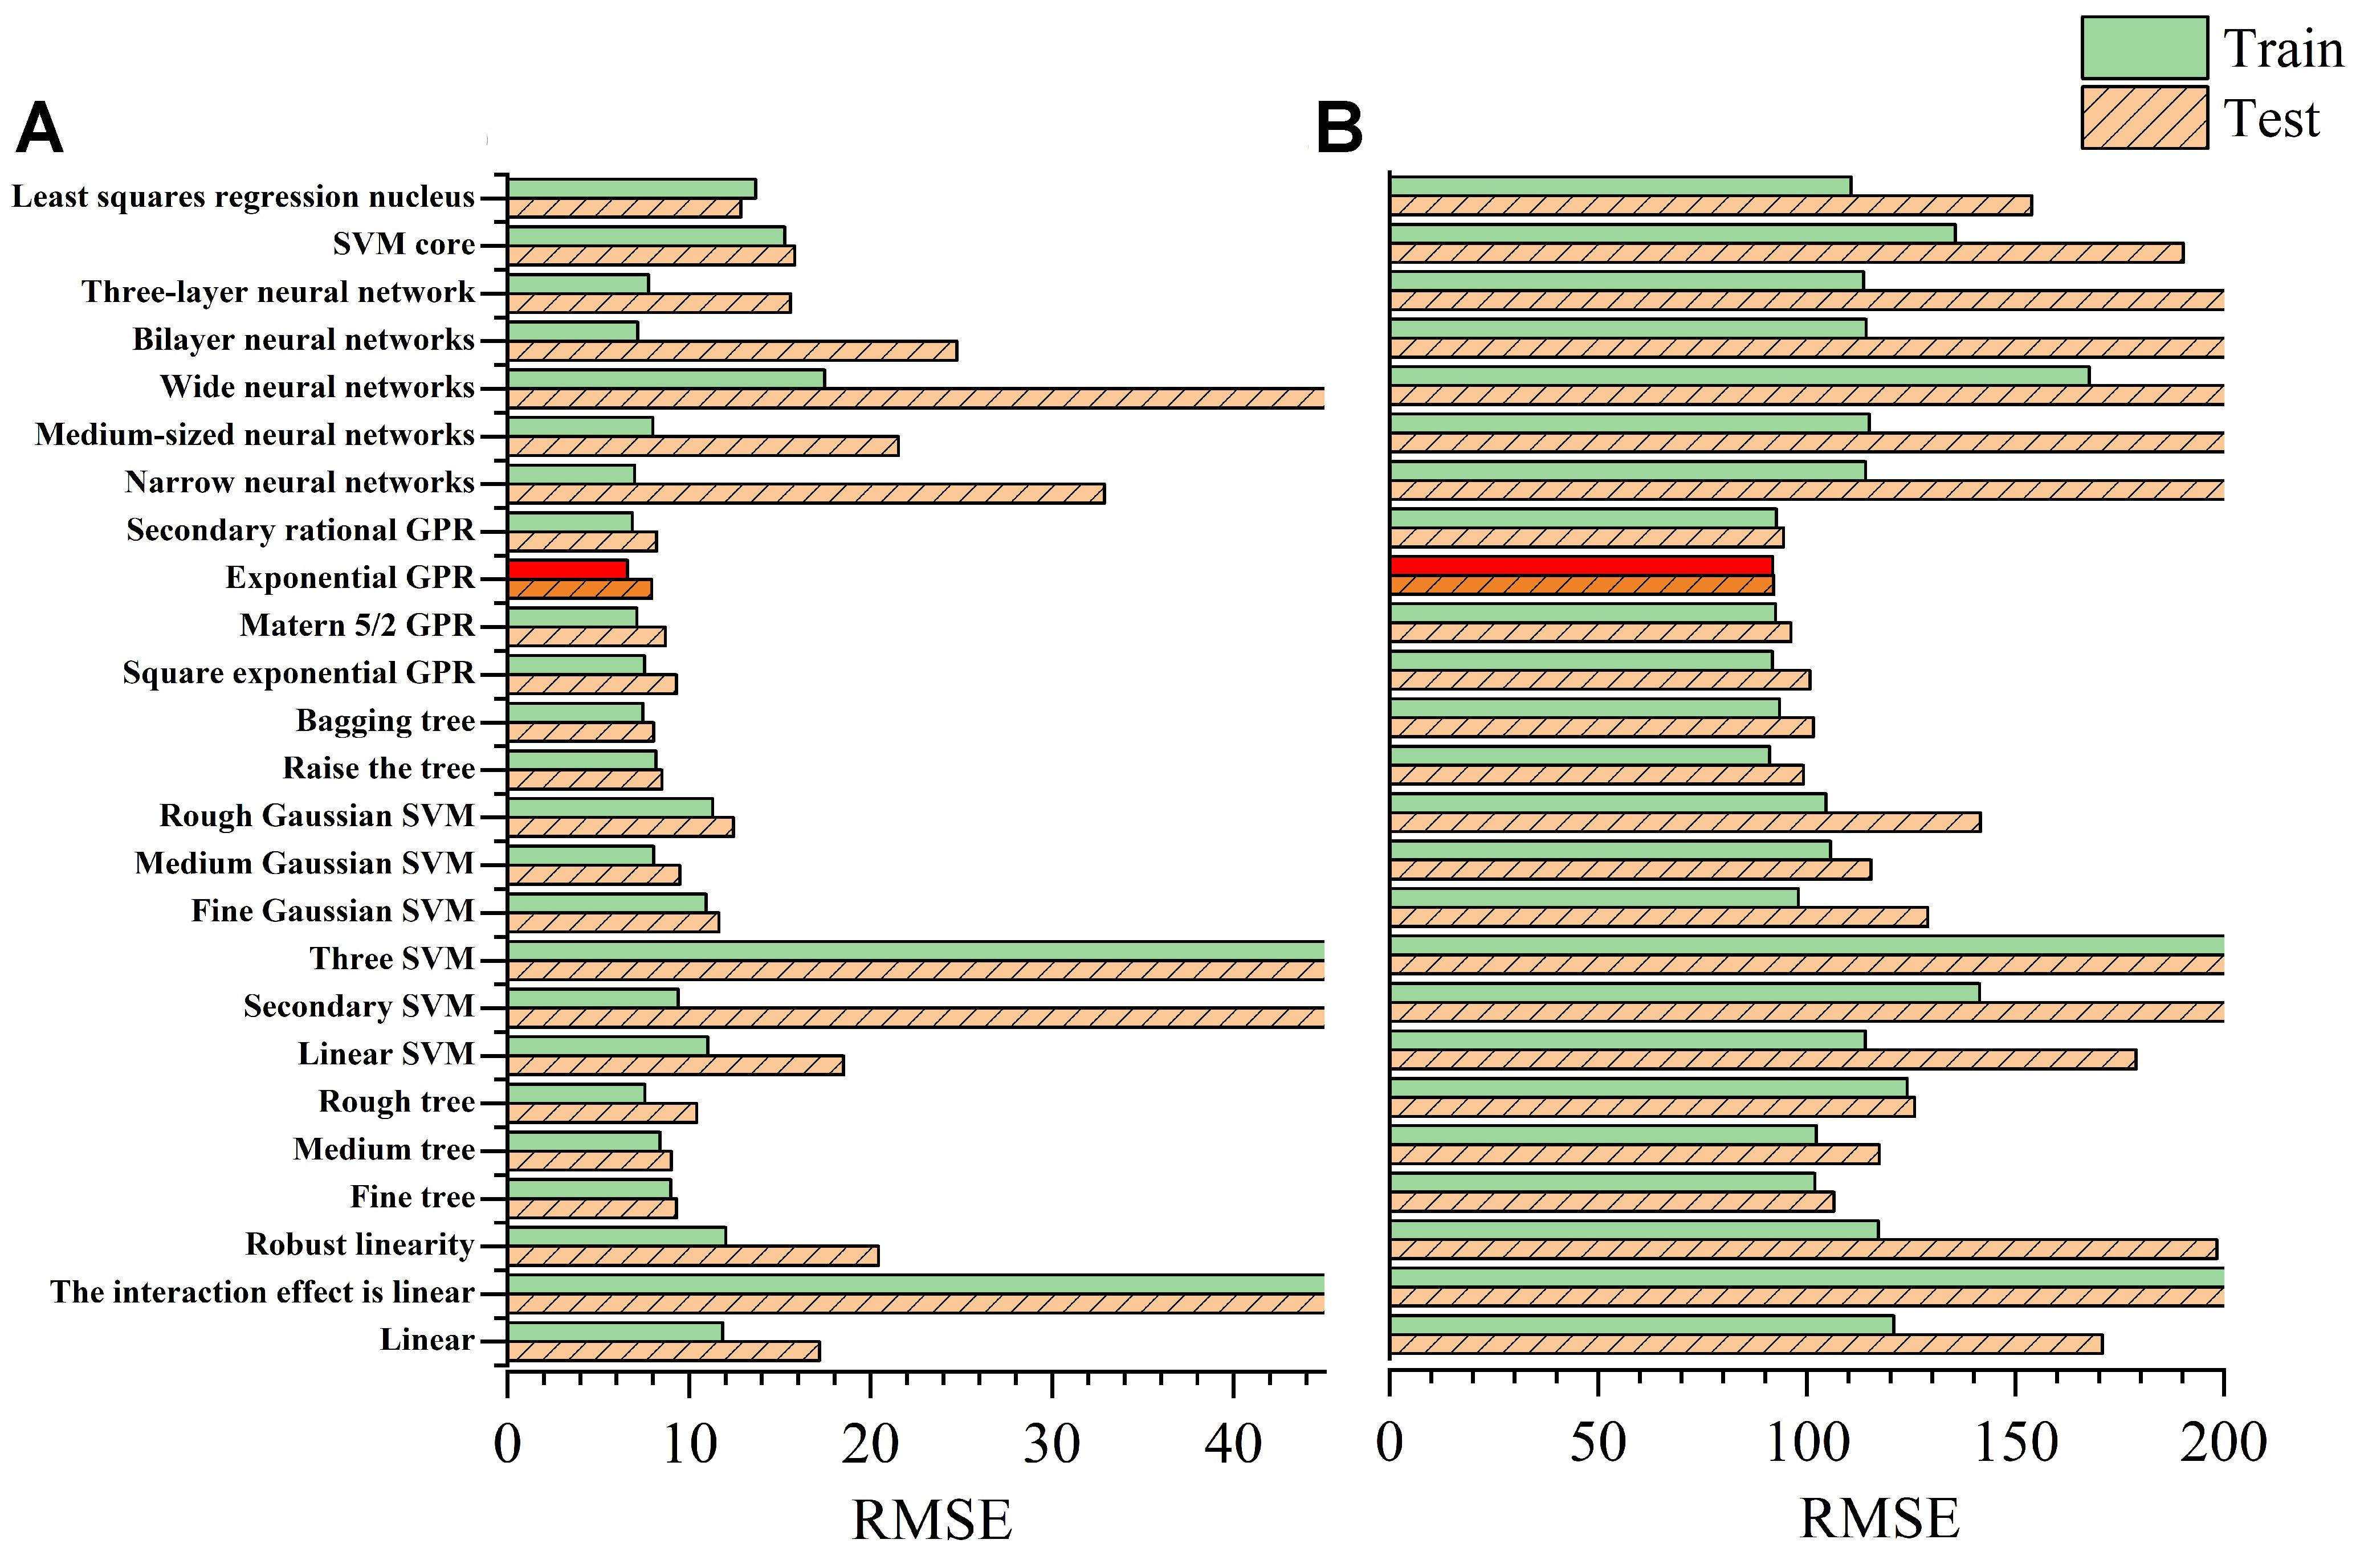
Figure 3. Performance of 25 different ML models for composition as input. (A) EC; (B) UTS. ML: Machine learning; EC: electrical conductivity; UTS: ultimate tensile strength; SVM: support vector machine; GPR: Gaussian process regression; RMSE: root mean square error.
where yi means the true values of UTS and EC,
The coefficients of determination (R2) of the best EXP-GPR models for EC and UTS on the training set (test set) were 0.886 (0.916) and 0.769 (0.592), respectively. R2 is defined as:
where
The difference in R2 between the training and test sets for EC was insignificant. Although a gap exists in R2 between the training and test sets in the UTS model, the EXP-GPR algorithm is the best among all the models. Therefore, based on these two metrics, GPR is considered the most suitable ML model to construct.
Filtering of physical features
To enhance the regression model’s accuracy, we incorporated the physicochemical characterization of the elements as complementary input. Specifically, we extracted 27 intrinsic physicochemical characteristics, such as relative atomic mass, electron affinity, melting point, atomic number, and lattice constant, for each alloy using the feature factor method[19]. The elementary characteristic quantities Fij (where i represents each characteristic quantity of an element, and j represents the element in each alloy) and the elementary content wj were then used to calculate the characteristic factors Fmi for the 27 characteristic quantities of each alloy, as defined in
A correlation analysis was performed to reveal the correlation of the 27 features using the Pearson correlation coefficient (PCC):
Here, ρxy represents the correlation coefficient between feature x and feature y, with xi and yi being the observed values, and
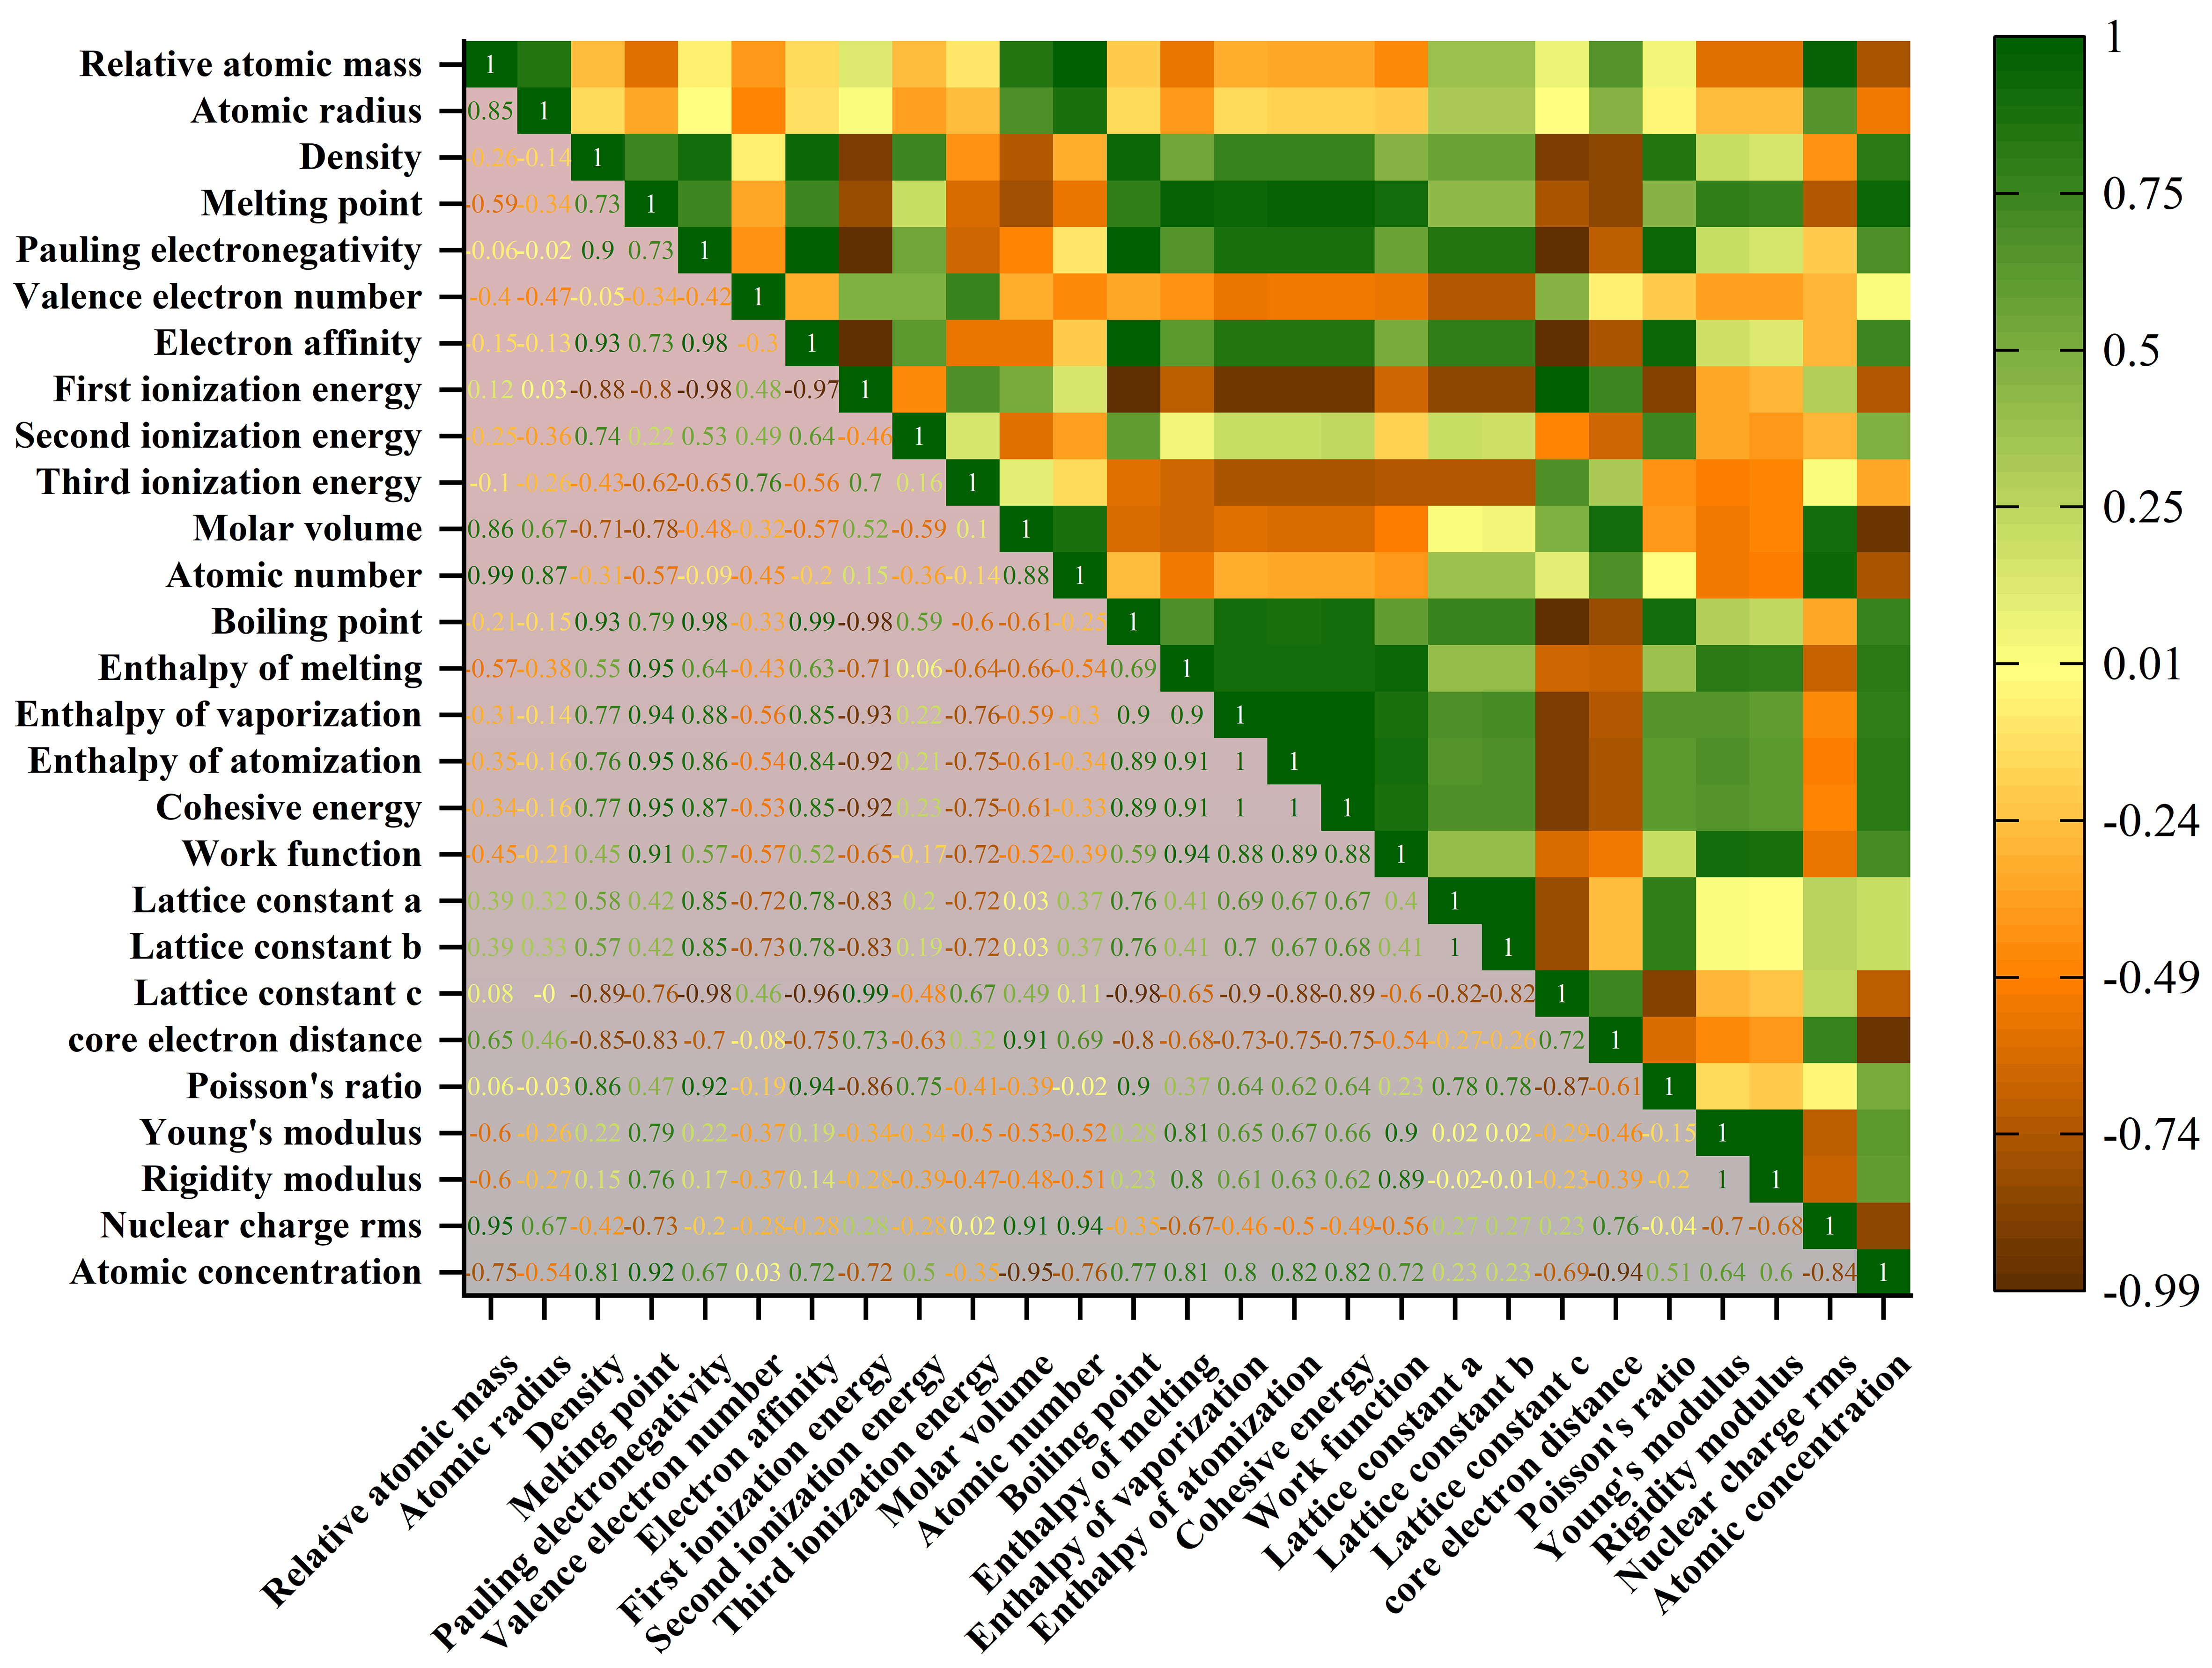
Figure 4. Correlation analysis of 27 features.
Then, the remaining 18 features are recursively filtered by the drop-one strategy, as presented in Figure 5. One feature is dropped out in each training, and the remaining n-1 features are entered into the ML model. The combination of features with the lowest RMSE is selected to enter the next loop. The above recursive process is repeated until the best combination of features is found. It can be seen that the RMSE at the 12th iteration (six features retained) reached the minimum for both the EC and UTS, and the best combination of features is listed in Table 1. Interestingly, there are three shared features for both EC and UTS models: electron affinity, first ionization energy, and work function.
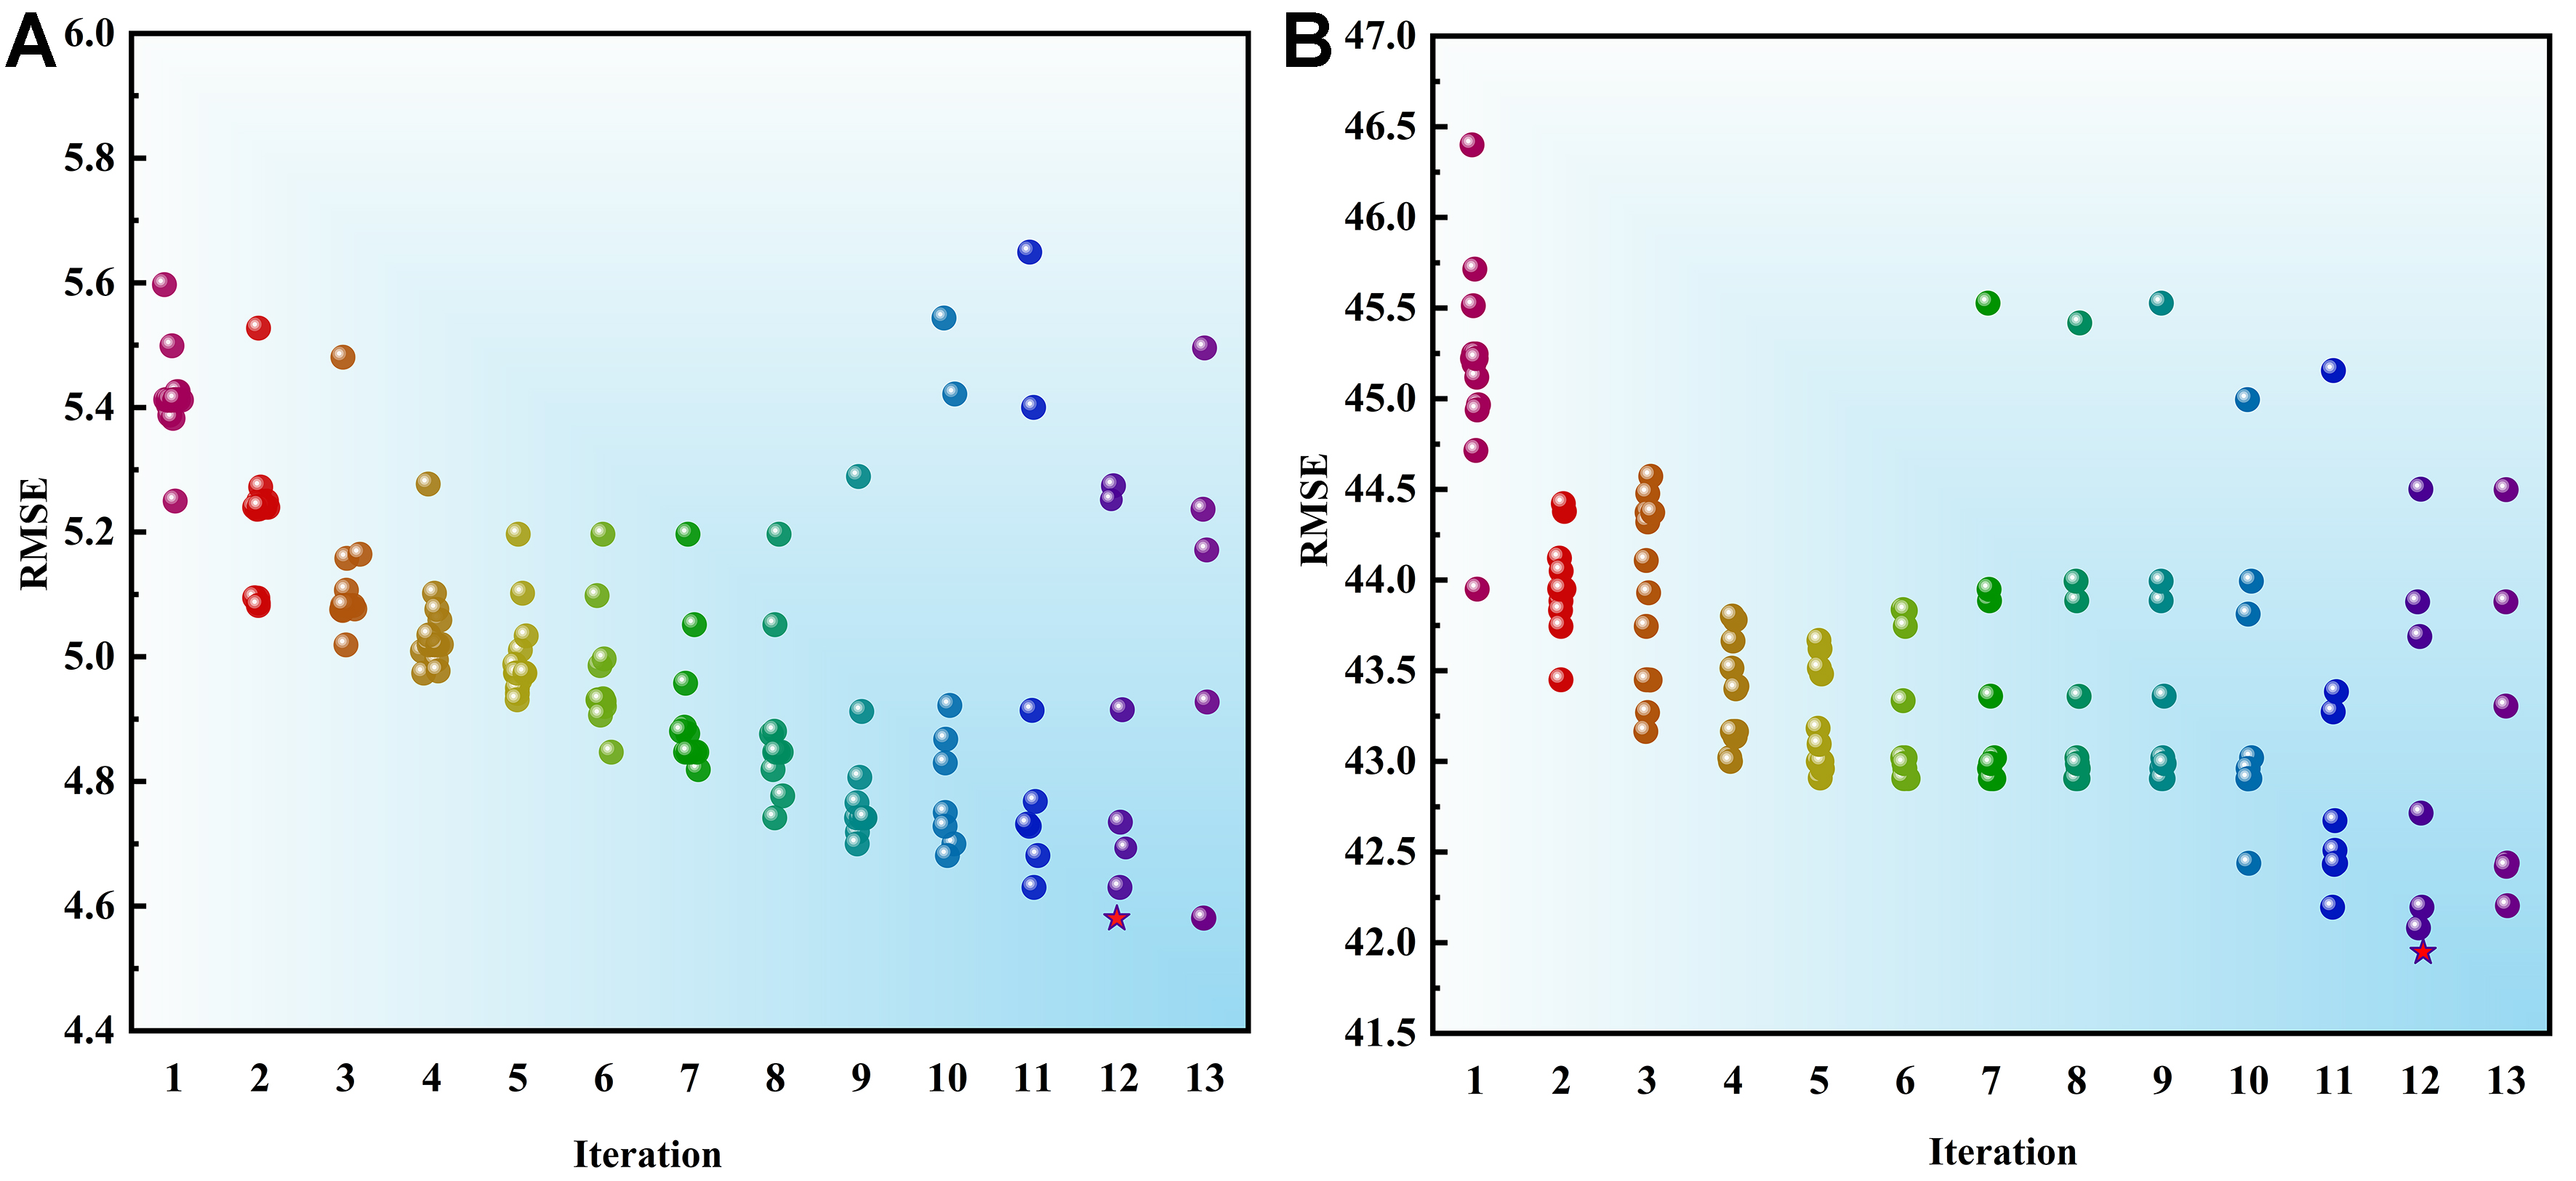
Figure 5. The recursive selection process for 18 features. (A) EC; (B) UTS. EC: Electrical conductivity; UTS: ultimate tensile strength; RMSE: root mean square error.
Best combination of features
| No. | EC | No. | UTS |
| 6 | Valence electron number | 7 | Electron affinity |
| 7 | Electron affinity | 8 | First ionization energy |
| 8 | First ionization energy | 10 | Third ionization energy |
| 9 | Second ionization energy | 14 | Enthalpy of melting |
| 18 | Work function | 18 | Work function |
| 22 | Core electron distance | 25 | Modulus of rigidity |
Model determination
When using alloy composition as the input, the EXP-GPR algorithm demonstrated outstanding performance. However, considering that incorporating the physical–chemical properties of alloying elements might alter the optimal matching algorithm, we evaluated 600 sets of physical features as inputs, as well as the combination of composition and physical features, across 25 algorithms to identify the most suitable one. As shown in Figures 6 and 7, EXP-GPR consistently outperformed all other algorithms in both scenarios. And we found that the combination of both inputs yielded the worst results. Therefore, this study adopts EXP-GPR as the base algorithm for model construction and optimization.
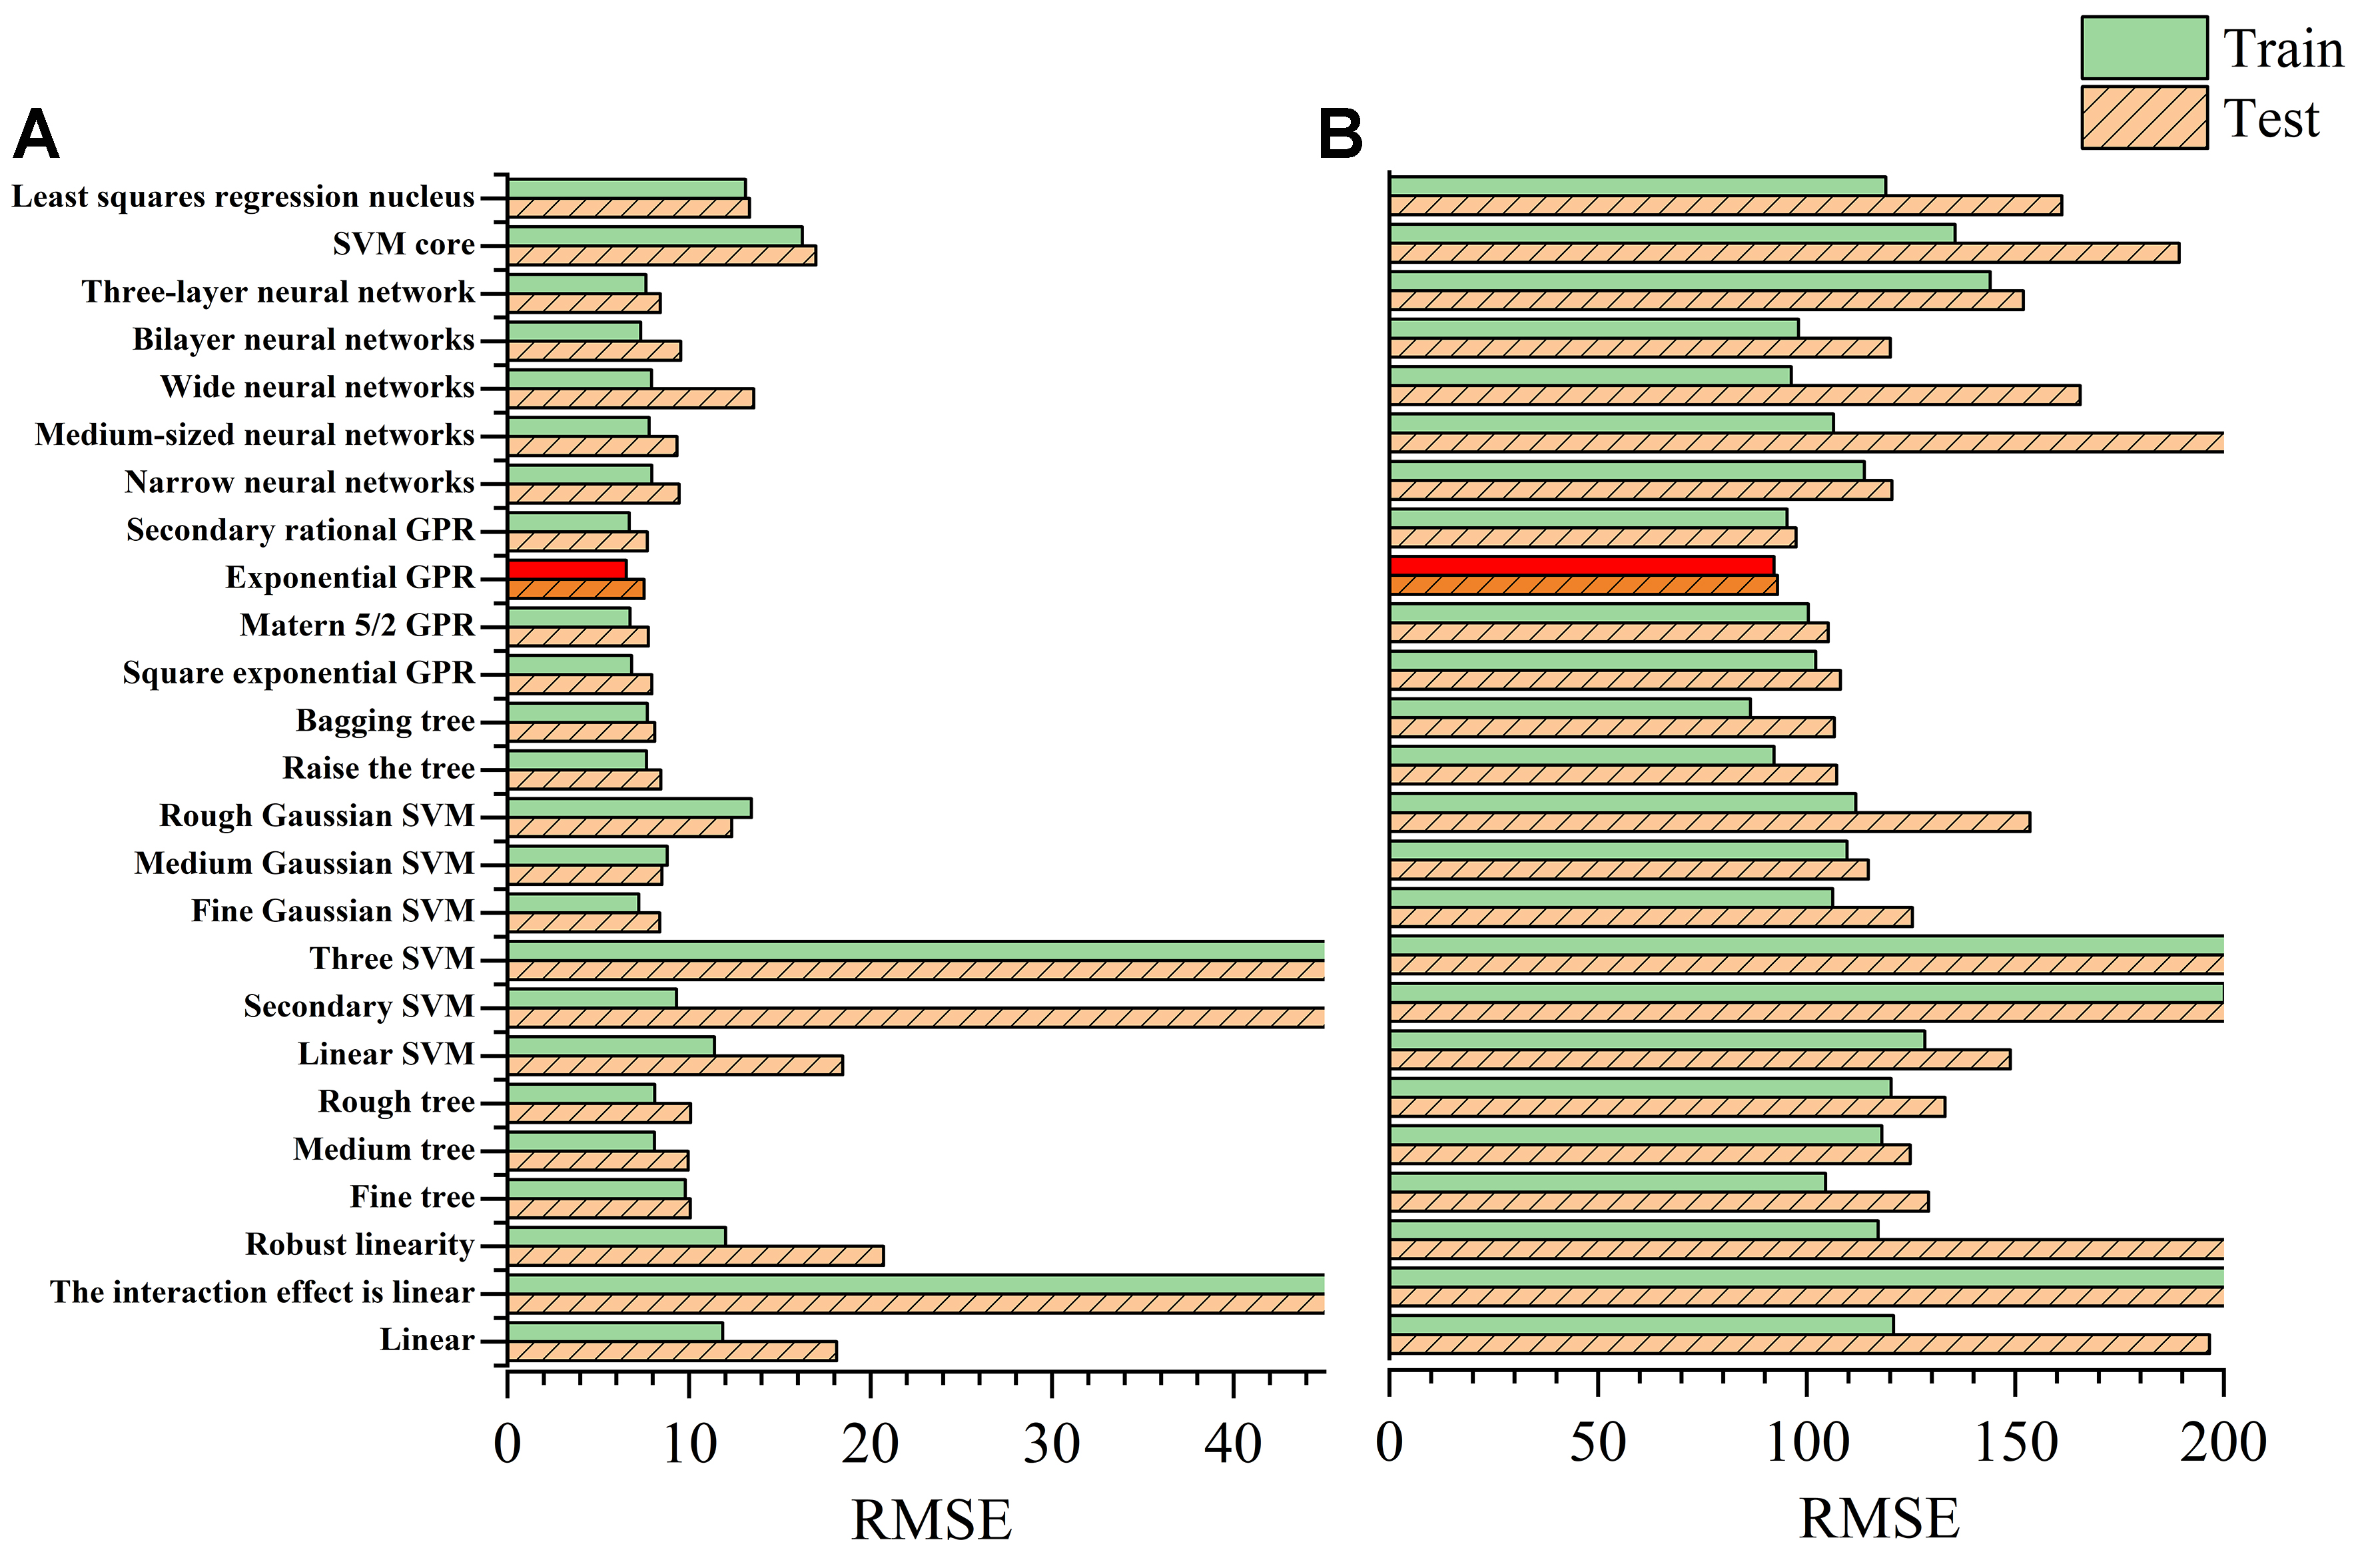
Figure 6. Performance of 25 different ML models for physical features as input. (A) EC; (B) UTS. ML: Machine learning; EC: electrical conductivity; UTS: ultimate tensile strength; SVM: support vector machine; GPR: Gaussian process regression; RMSE: root mean square error.
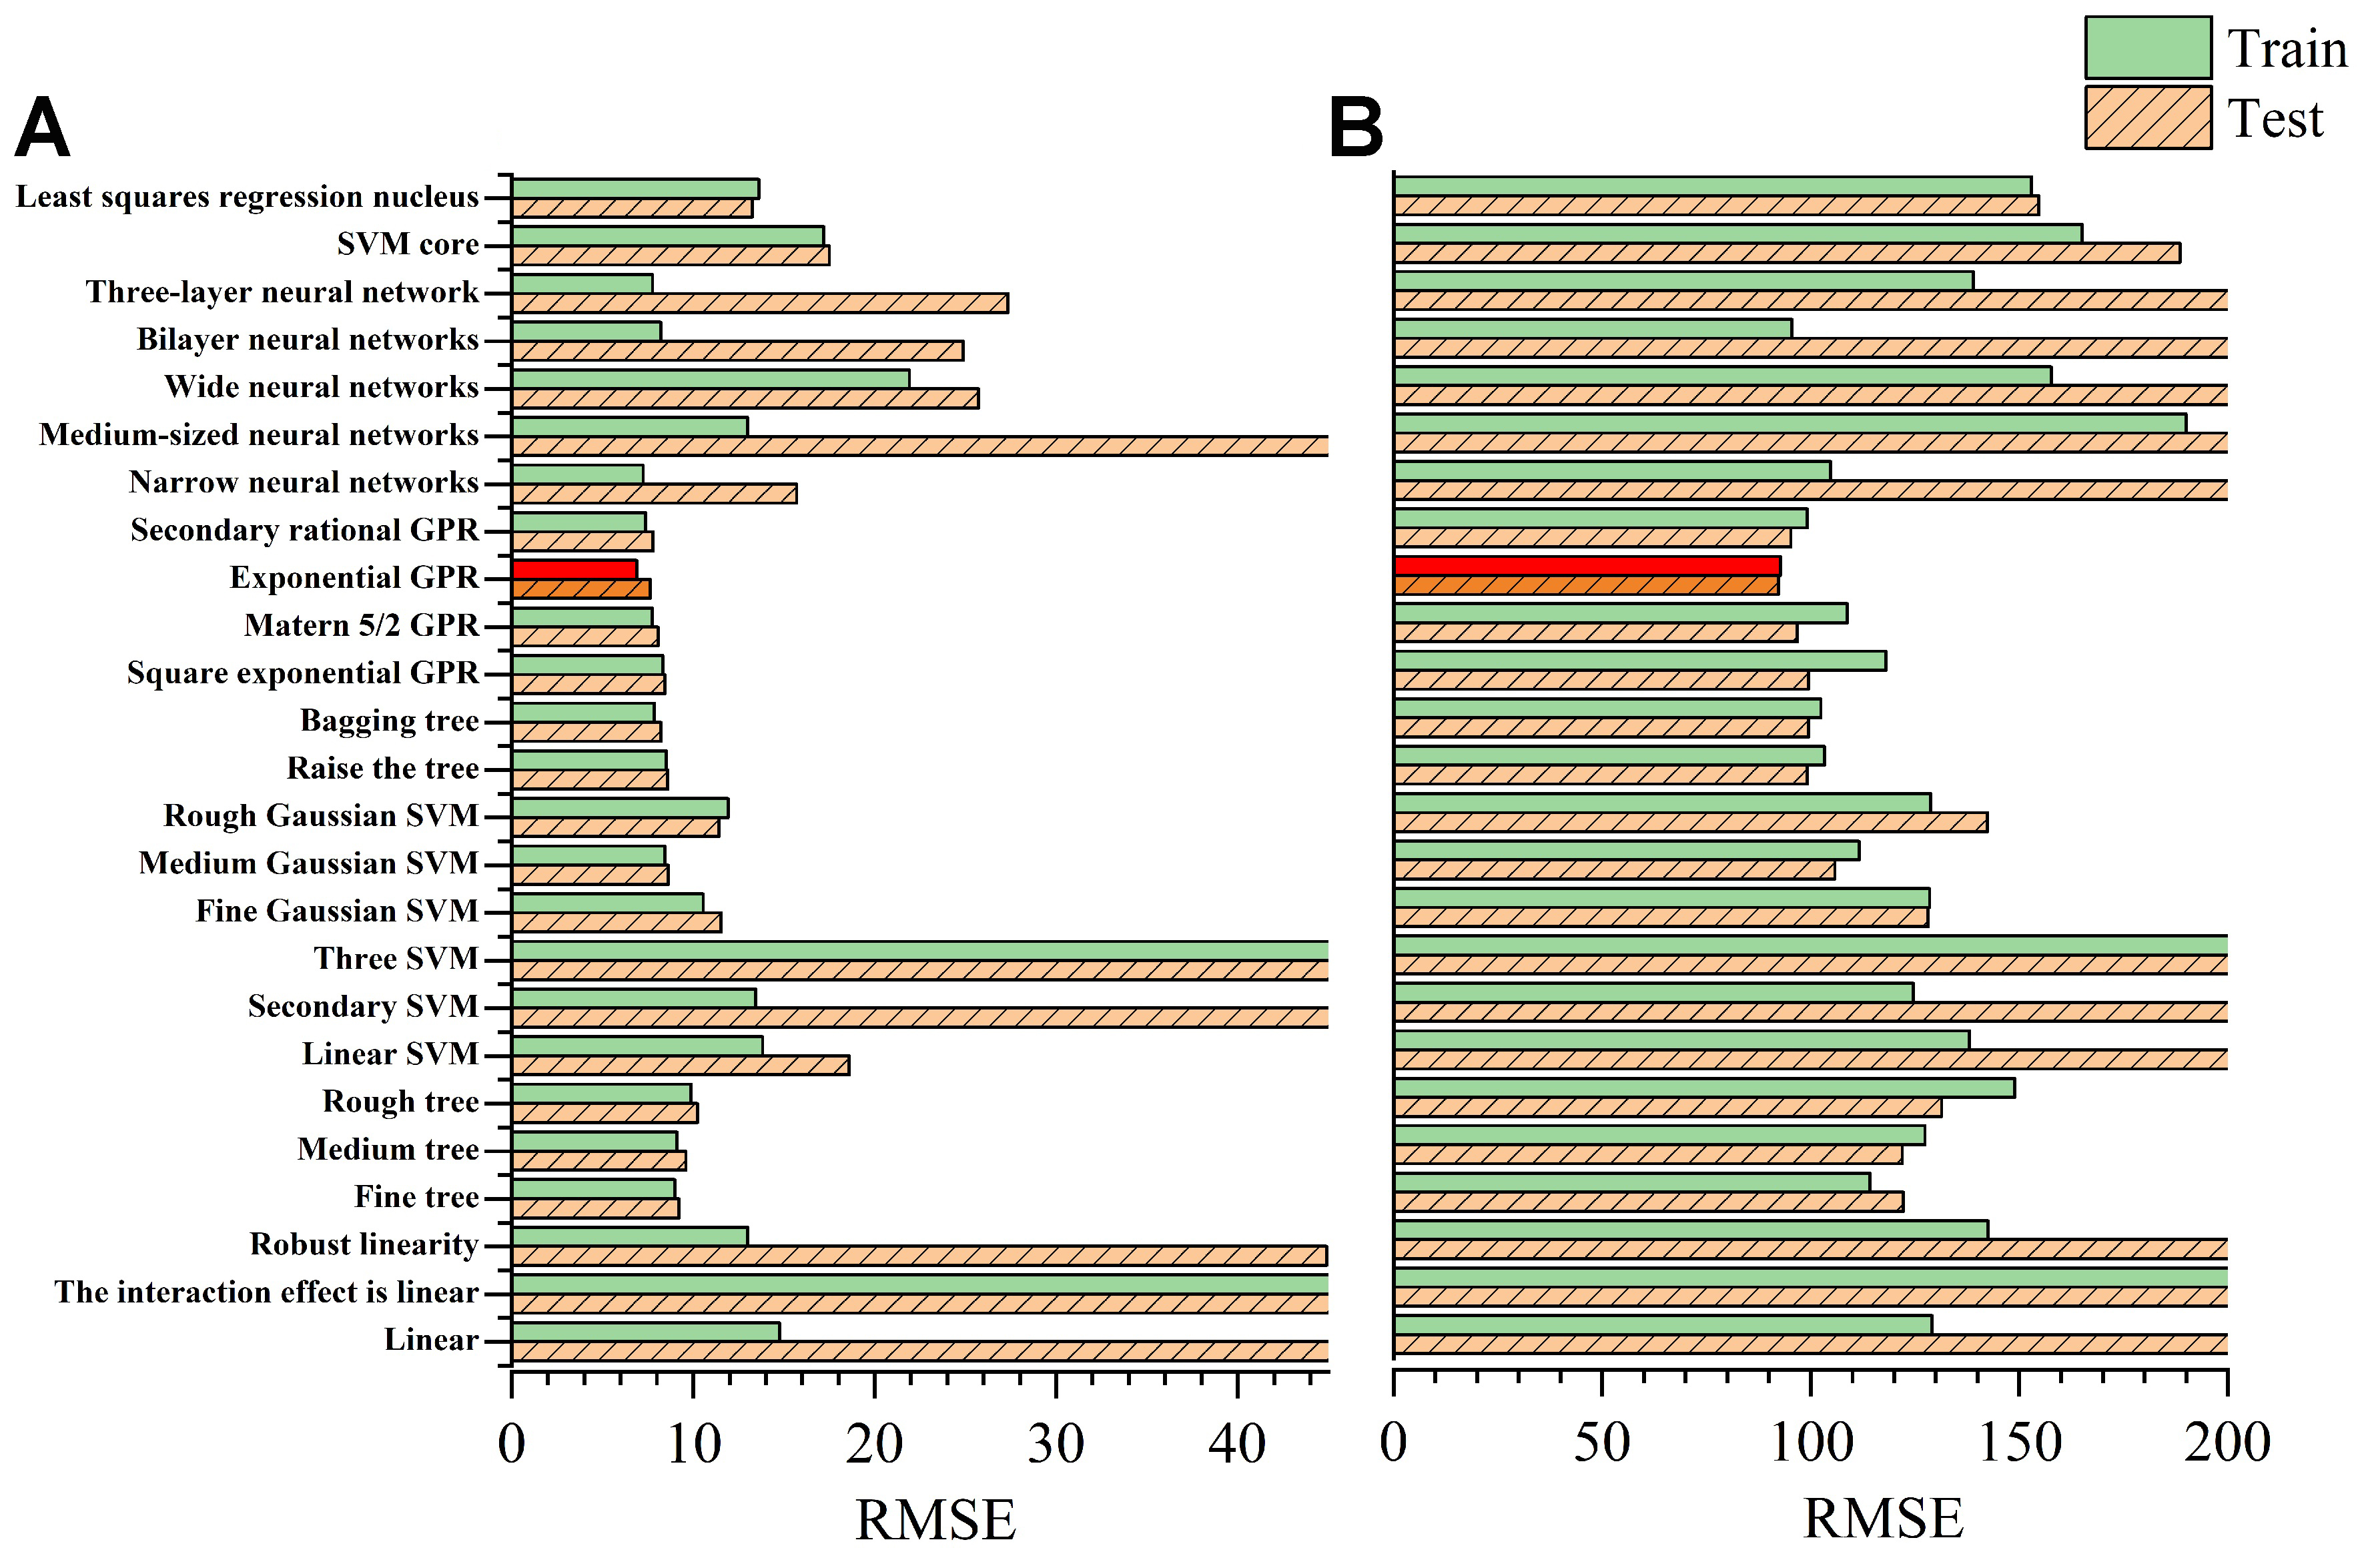
Figure 7. Performance of 25 different ML models for composition + physical features as input. (A) EC; (B) UTS. ML: Machine learning; EC: electrical conductivity; UTS: ultimate tensile strength; SVM: support vector machine; GPR: Gaussian process regression; RMSE: root mean square error.
Using different input features, three EXP-GPR models are constructed: composition-property (comp.), physical features-property (feat.), and composition + physical features-property (comp. + 6feat.). Then, parameter optimization and adjustment were performed on these three models to achieve better results. The model performance is evaluated using RMSE [as given in Equation (1)] and the mean absolute percentage error (MAPE), which is determined using
The performance of different models is shown in Figure 8. The comp. model presents poor performance for both UTS and EC, particularly in the test set. The RMSE and MAPE of feat. model for EC show a significant decrease compared to comp. model. The training set MAPE decreases from 7.46% to 5.92%, and the test set MAPE decreases from 13.94% to 10.6%. For UTS, the RMSE and MAPE of feat. model slightly increase for the training set when compared with comp. model, while decreasing significantly for the test set. When the component and physical parameter are used together as inputs (comp. + 6feat.), the RMSE and MAPE on the test sets are increasingly closer to those of the train set. Notably, the MAPE of the test sets of comp. + 6feat. decreases to 8.55%. For the UTS models, the MAPE of the training sets decreased to 5.89%. Hence, the comp. + 6feat. model exhibits superior prediction accuracy for both EC and UTS.
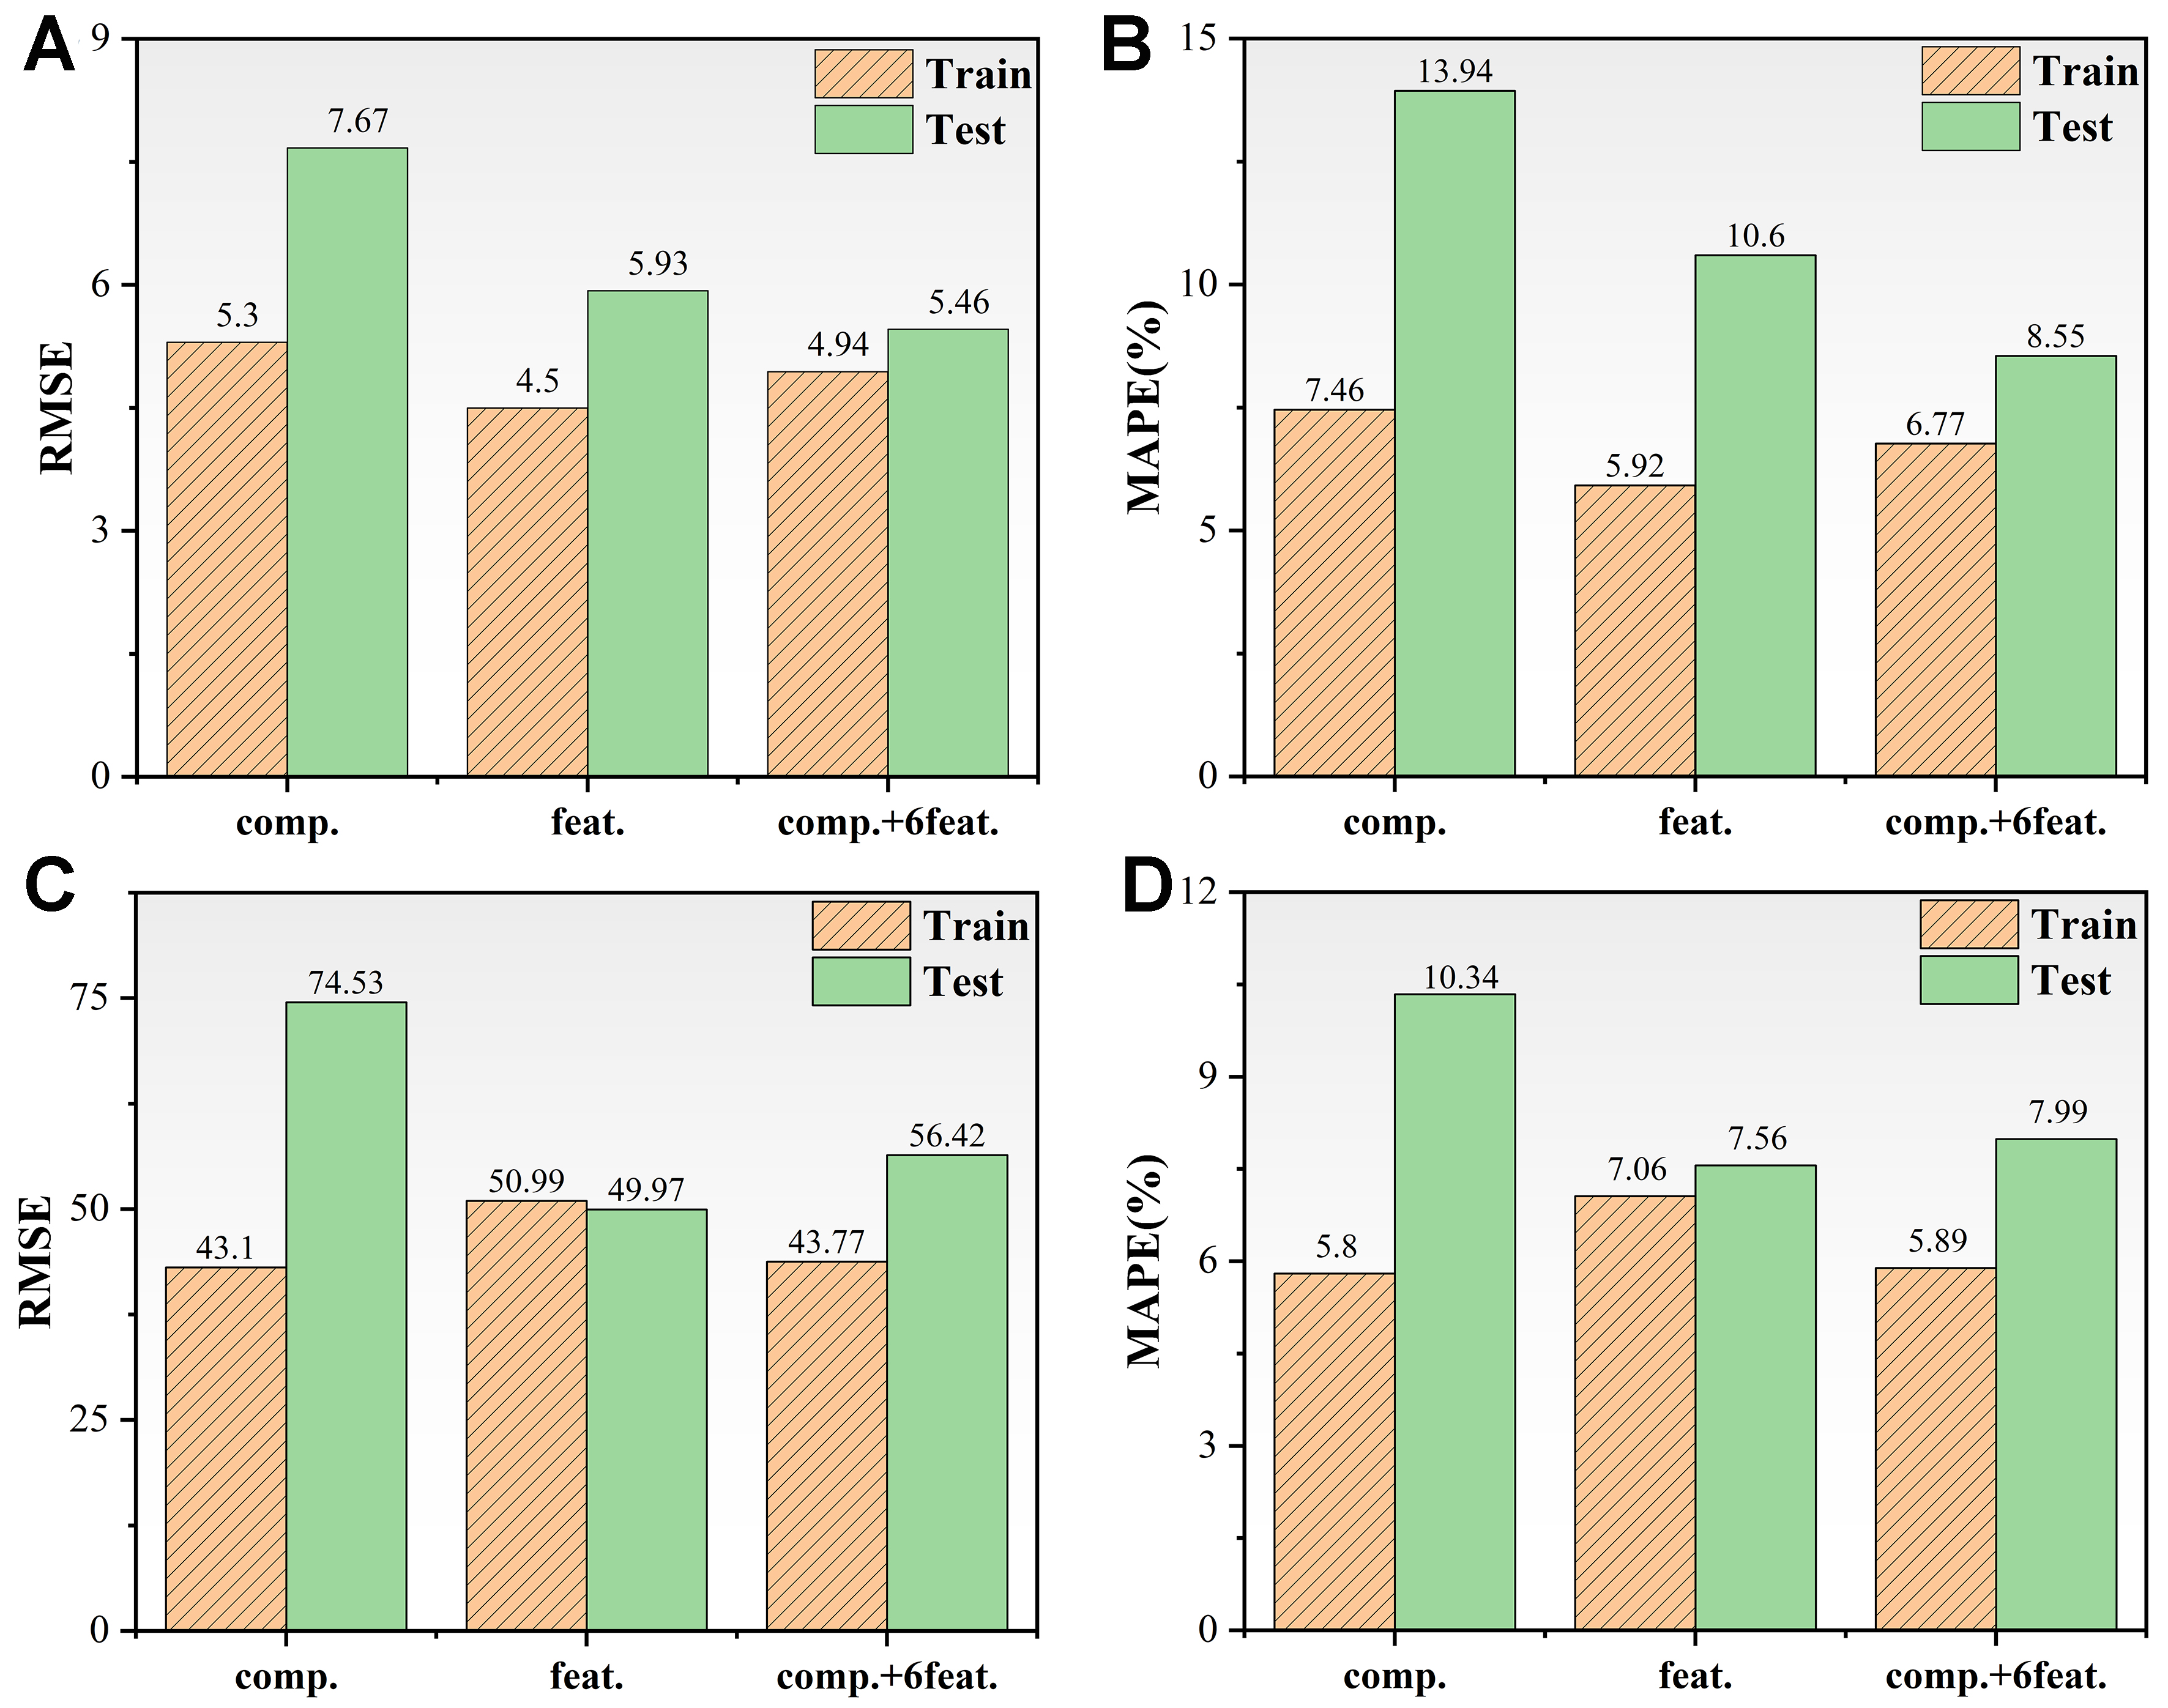
Figure 8. Performance of the three selected ML models on training and test sets. (A and B) EC; (C and D) UTS. ML: Machine learning; EC: electrical conductivity; UTS: ultimate tensile strength; RMSE: root mean square error; MAPE: mean absolute percentage error; comp.: composition-property; feat.: physical features-property.
To validate the accuracy of the comp. + 6feat. model, we collected an additional 30 sets of data[20] for generalization. This dataset is primarily composed of Cu-Ni-Si and its derivative systems, along with representative high-performance alloys such as Cu-Zr-B and Cu-Fe-Cr. To enhance the interpretability of the results, the samples were grouped and ordered based on alloy systems, and different color labels were used to distinguish them. Key alloy types were annotated in Figure 9.
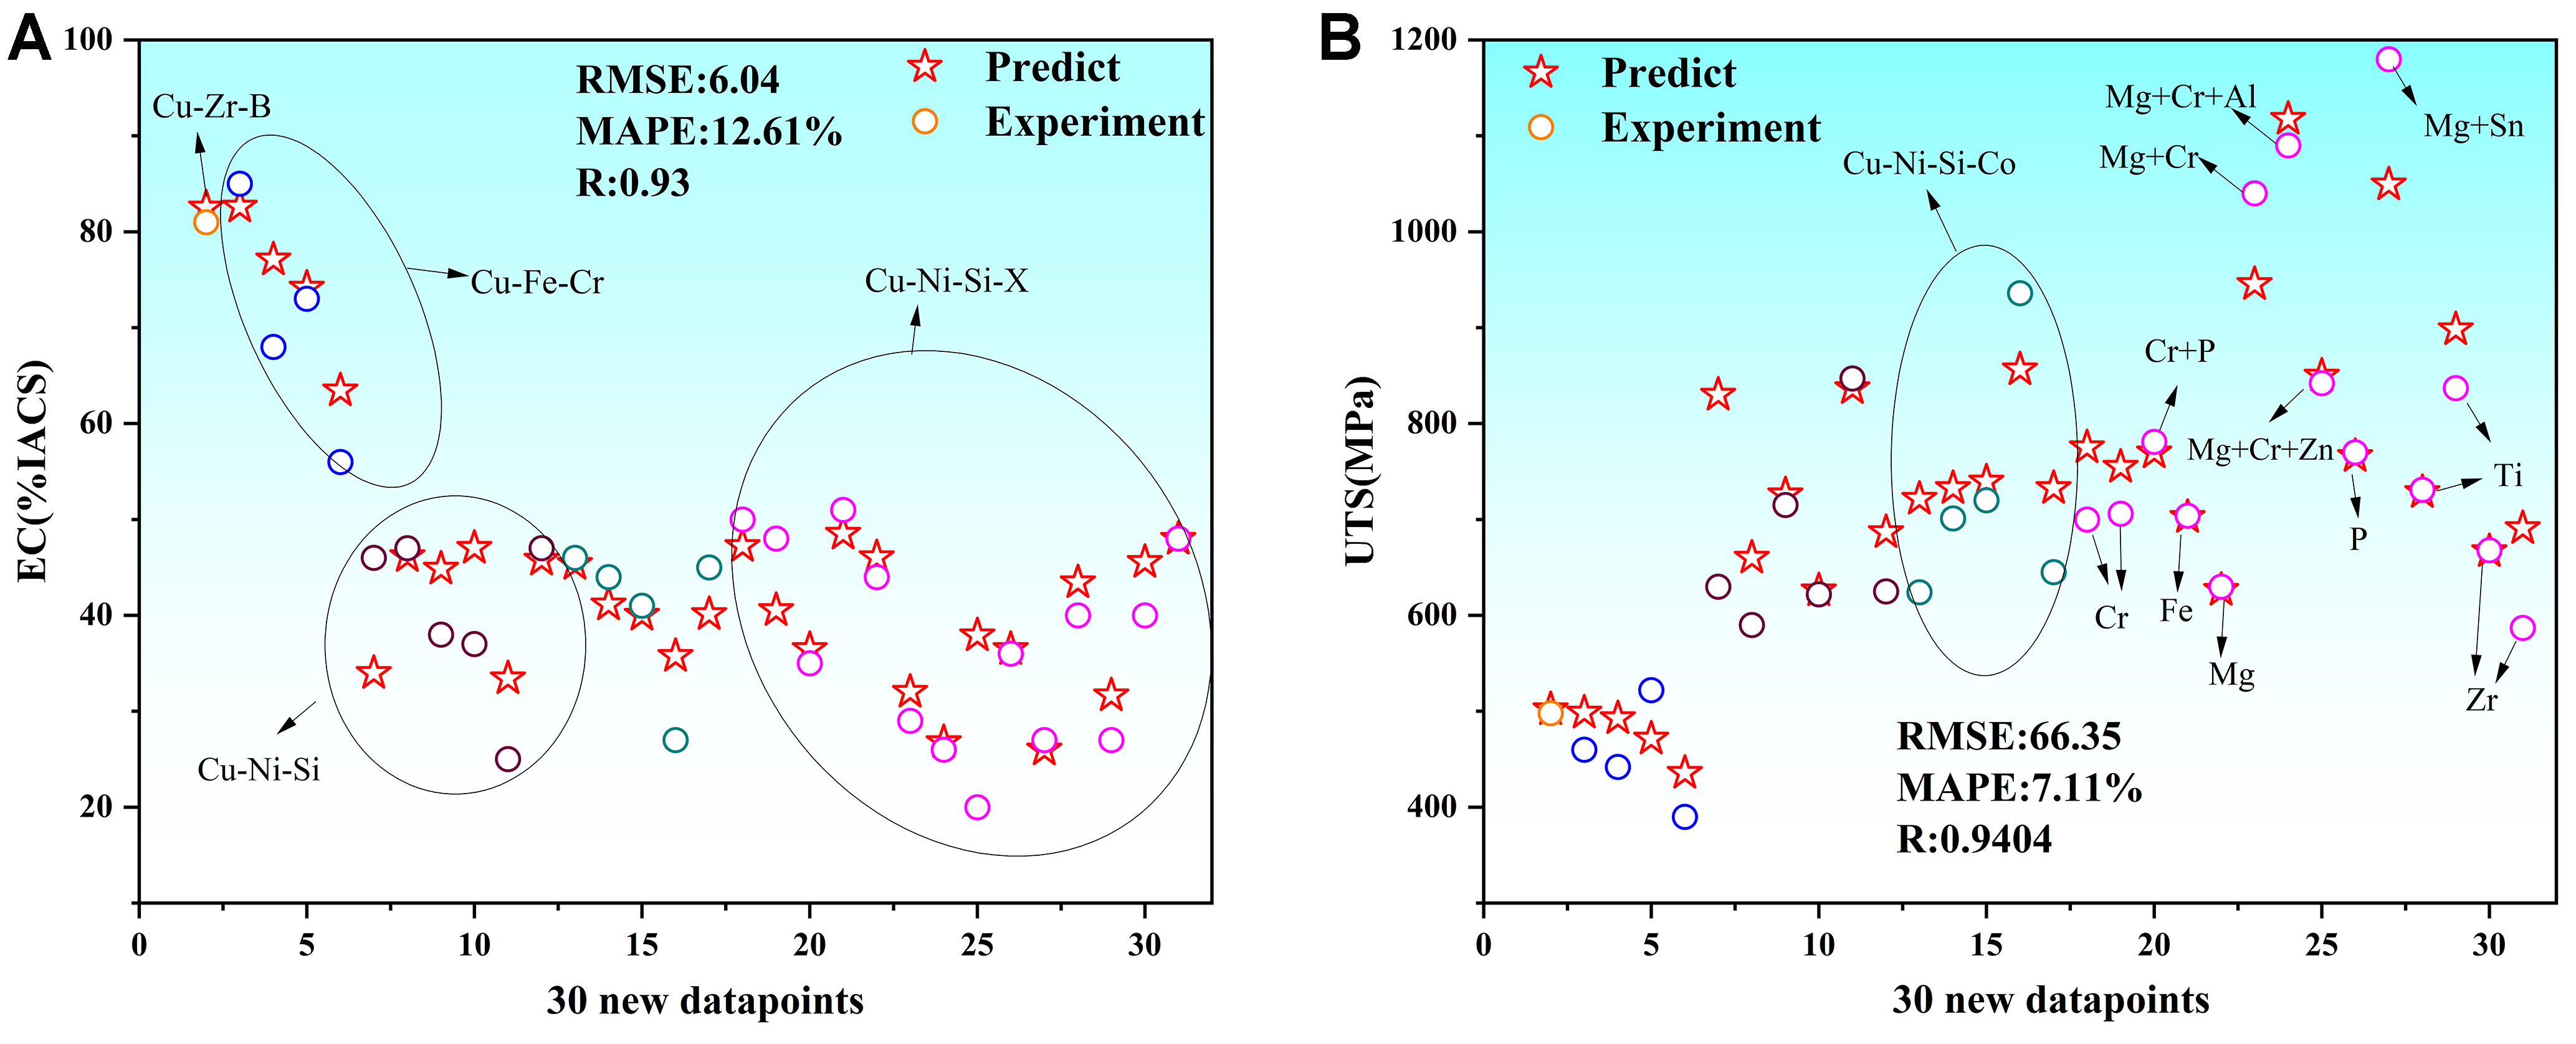
Figure 9. Comp. + 6feat. model performance on 30 new data points. (A) EC; (B) UTS. Comp.: Composition-property; feat.: physical features-property; EC: electrical conductivity; UTS: ultimate tensile strength; %IACS: international annealed copper standard; RMSE: root mean square error; MAPE: mean absolute percentage error.
As shown in Figure 9A, for high-conductivity systems such as Cu-Zr-B and Cu-Fe-Cr, the predicted EC values are highly consistent with the experimental data, indicating excellent fitting performance. In Figure 9B, the UTS predictions for complex multi-element systems such as Cu-Ni-Si-Co and Cu-Ni-Si-X(Mg+Cr+Al) also show strong agreement with the measured values. Within the Cu-Ni-Si system, despite variations in composition - such as the incorporation of Co, Mg, Cr, and Al - the model successfully captures the characteristic high strength of the system. Furthermore, EC predictions remain close to experimental values and follow the expected physical trends.
Overall, the model demonstrates outstanding predictive performance on the 30 extrapolated samples: the UTS prediction yields a MAPE of 7.11%, even lower than that observed on the original testing set; for EC, the RMSE is 6.04 and MAPE is 12.61%, slightly higher than the initial testing results but still within a reasonable range. These results confirm that the model possesses excellent generalization ability across various Cu alloy systems, effectively accommodating diverse compositional variations without sacrificing accuracy.
RESULTS AND DISCUSSION
Interpretation of the effect of physical parameters
Based on the comp. + 6feat. model, we analyze the effect of physical parameters on the property using the SHAP model[21]. It is important to emphasize that the present interpretation is based on data-driven correlations rather than direct mechanistic causation. As shown in Figure 10, the valence electron concentration, work function, first ionization energy, core electron distance, electron affinity, and second ionization energy have a decreasing influence on the EC. Specifically, the valence electron has a positive impact on the EC. The increase of valence electrons will increase the number of free electrons in the metal and then increase the EC. Figure 10 shows that the work function, first ionization energy, and core electron distance harm the EC. The work function describes the ability of a material to release electrons from its surface[22]. Metals with smaller work functions require less energy for electrons to escape and are more likely to release free electrons, thus boosting conductivity. For those elements with different work functions, the electrons are prone to accumulate at the interface and form a built-in electric field within the material, which changes the local electron concentration, and reduces the EC. Materials with lower first ionization energies are generally more prone to losing electrons, making it easier for electrons to become free, thereby increasing the EC. Electron affinity and second ionization energy have a minimal influence on EC, as their SHAP values predominantly center around 0.
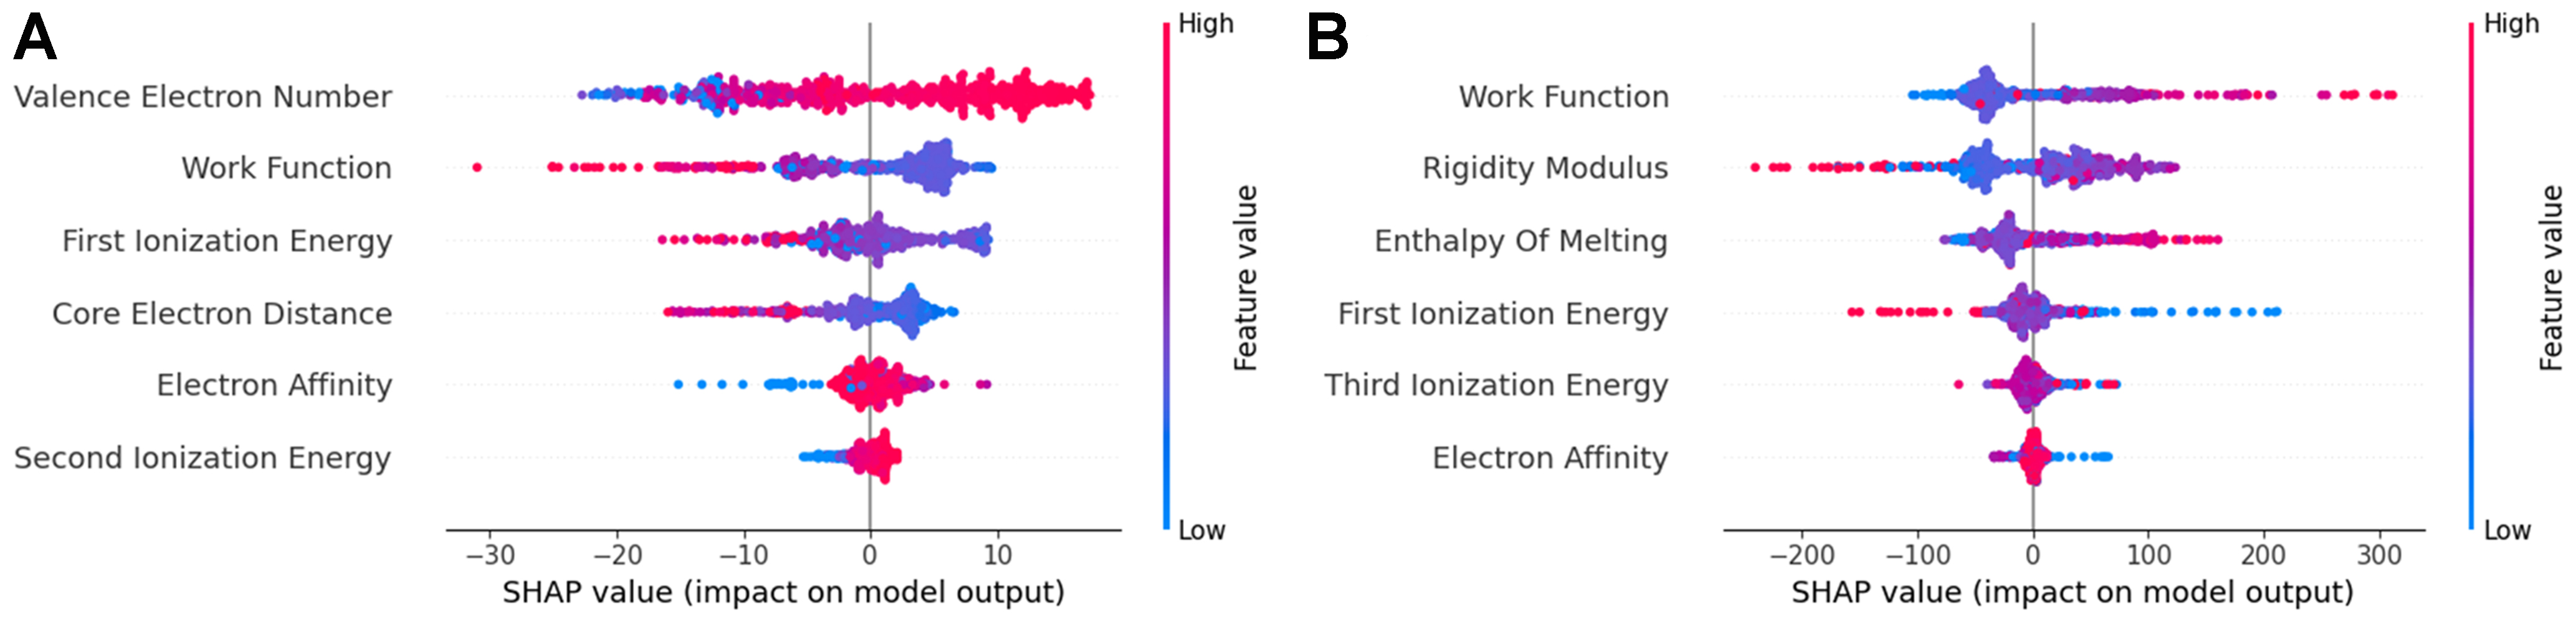
Figure 10. SHAP values of six features for 2 ML models. (A) EC model; (B) UTS model. SHAP: Shapley additive explanations; ML: machine learning; EC: electrical conductivity; UTS: ultimate tensile strength.
For the UTS model, among the six physical features, the degree of influence on the UTS is the following sequence: work function, rigidity modulus, melting enthalpy, first ionization energy, third ionization energy, and electron affinity. The work function, rigidity modulus, and enthalpy of melting have a positive effect on UTS. The differences in the work function of different elements change the electronic structure around the grain boundaries, which alters the grain boundaries’ strength and thus affects the material’s tensile strength. Lu et al. suggested that a higher work function corresponds to a more stable electronic state, which provides greater resistance to changes in the electronic configuration and other related states[23]. They observed a positive correlation between the electronic work function, rigidity modulus, and hardness of Cu-Ni alloys. However, studies examining the effect of work function on UTS are limited and require further investigation. Rigidity modulus and enthalpy of melting reflect the bonding strength of alloys, and thus have a positive relationship with strength. In contrast, the effects of electron affinity and third ionization energy on UTS are relatively small compared to other features.
Interpretation of the alloying effect
The SHAP model is used to analyze the effect of individual elements on EC and UTS, with the results presented in Figure 11. The top five elements contributing most to EC are Ni, Si, Sn, Zn, and Fe, whereas for UTS, they are Ni, Si, Cr, P, and Sn. The above elements are all included in the common HSHC Cu alloy systems, such as Cu-Ni-Si, Cu-Cr-Zr, and Cu-Fe-P. Among those elements, Ni and Si exert the most significant influence on both EC and UTS models. The SHAP analysis reveals that high Ni and Si contents have a significant negative impact on EC. Moreover, increased Si content enhances strength, whereas high Ni content can sometimes increase it. Hence, the Ni content must be carefully determined in the Cu-Si-Ni system. Li et al. improved the properties in the Cu-Ni-Si system by controlling the Ni/Si mass ratio and observing the changes in the microstructure[24]. In addition, elements such as Fe, P, Cr, Mg, etc., are often used to improve the mechanical properties of Cu alloy and bring a tolerable loss of EC[25]. Generally speaking, adding alloying elements decreases the EC and increases the UTS. Interestingly, Mn and Co demonstrate a notably positive influence on both EC and UTS when present in substantial quantities.
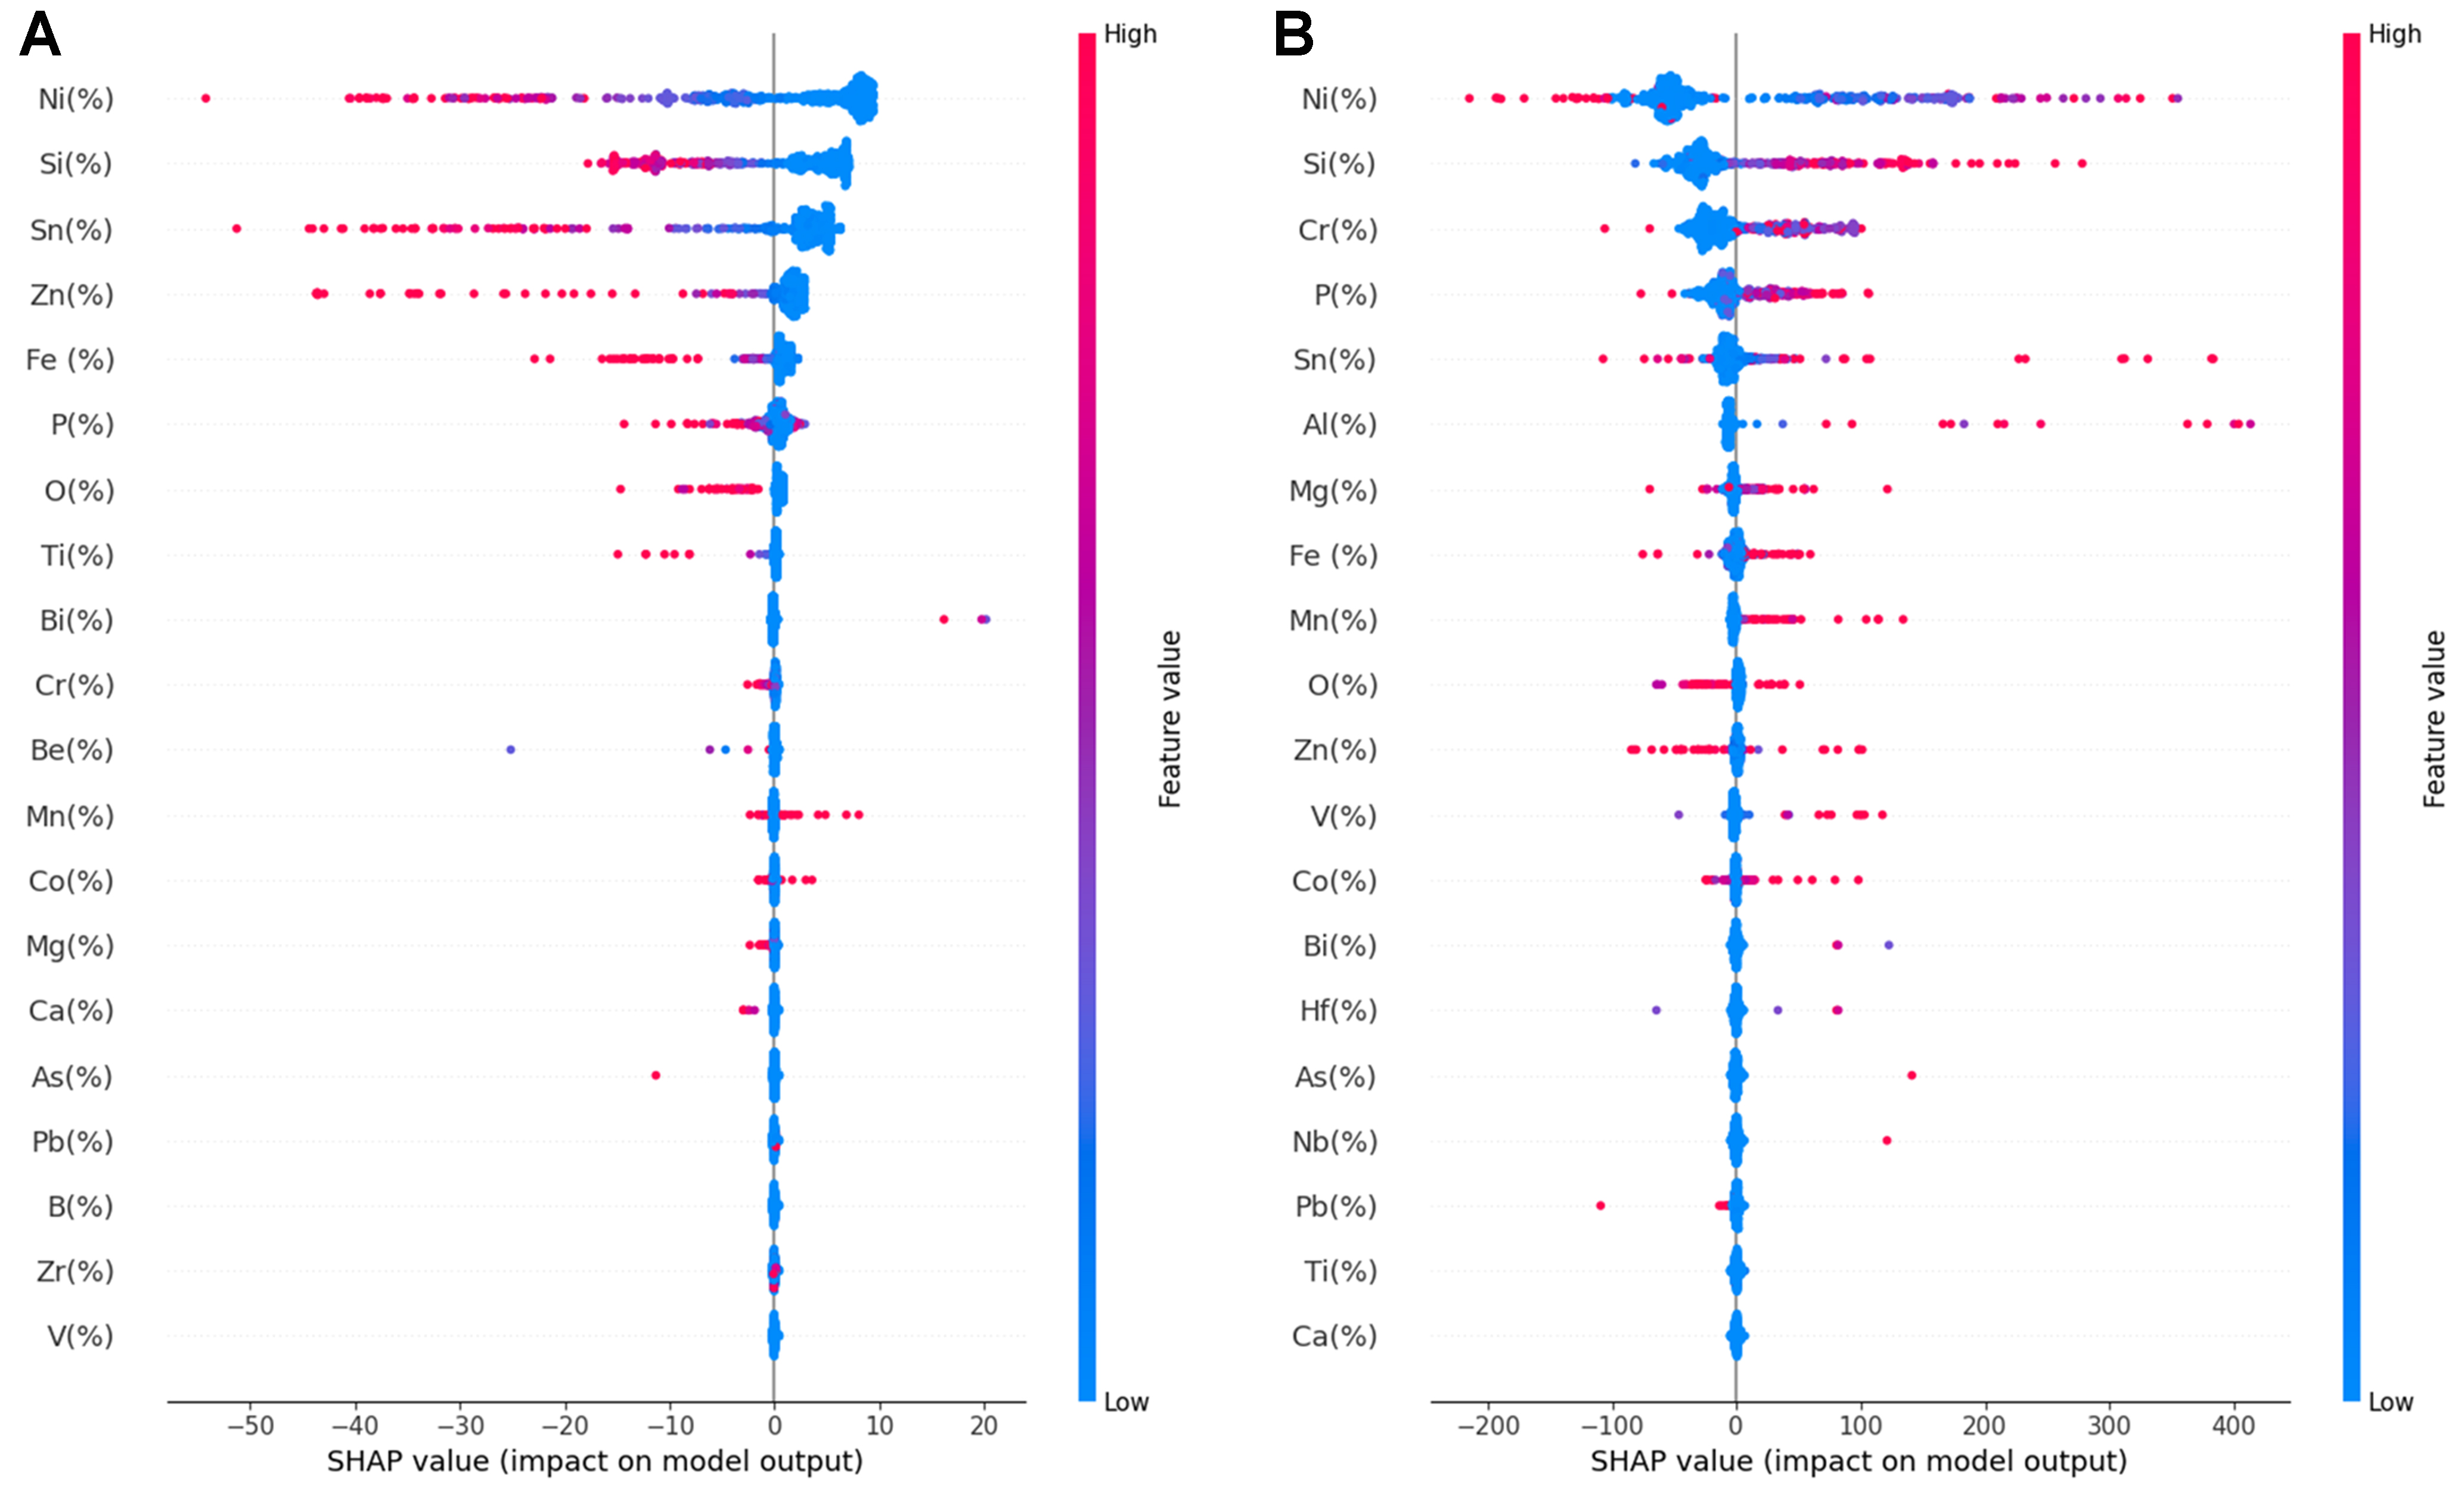
Figure 11. SHAP value for 25 elemental components of 2 ML models. (A) EC model; (B) UTS model. SHAP: Shapley additive explanations; ML: machine learning; EC: electrical conductivity; UTS: ultimate tensile strength.
These results not only enhance the interpretability of the prediction model but also provide important guidance for alloy composition design. For example, as shown in Figure 11, both Ni and Si exhibit significant positive effects on UTS while simultaneously reducing EC, indicating that their doping ratio should be carefully balanced in multi-objective optimization. In contrast, Mg can enhance UTS at low concentrations with only a minimal negative impact on EC, highlighting its potential as an efficient strengthening element. Such findings translate the SHAP analysis into actionable design strategies for optimizing new alloys under multiple performance constraints.
In addition to assessing the contribution of individual elements to performance, a well-trained model can also be directly applied to predict the overall properties of alloys. In the aforementioned extrapolation validation, Ni and Si were identified as key factors influencing both UTS and EC, and the external dataset predominantly consisted of Cu-Ni-Si and its derivative systems, confirming the model’s predictive accuracy for alloys with effects of Ni and Si. To extend the design exploration beyond a single system, we focused on Mg and Cr, which the SHAP analysis indicated as a potential strengthening element with minimal EC degradation at low concentrations. Based on this insight, we combined Mg with the well-established Cu-Cr-Zr system, which is a potential material for next-generation IC[26] and renowned for its excellent strength–conductivity balance - to demonstrate the model’s capability in novel alloy systems with SHAP. Taking the Cu-0.05Mg-0.27Cr-0.11Zr (wt.%) (tensile strength is 515 MPa, and conductivity is 83 %IACS[27]) as an example, Figure 12 illustrates the effect of different elements on EC and UTS based on the current model.
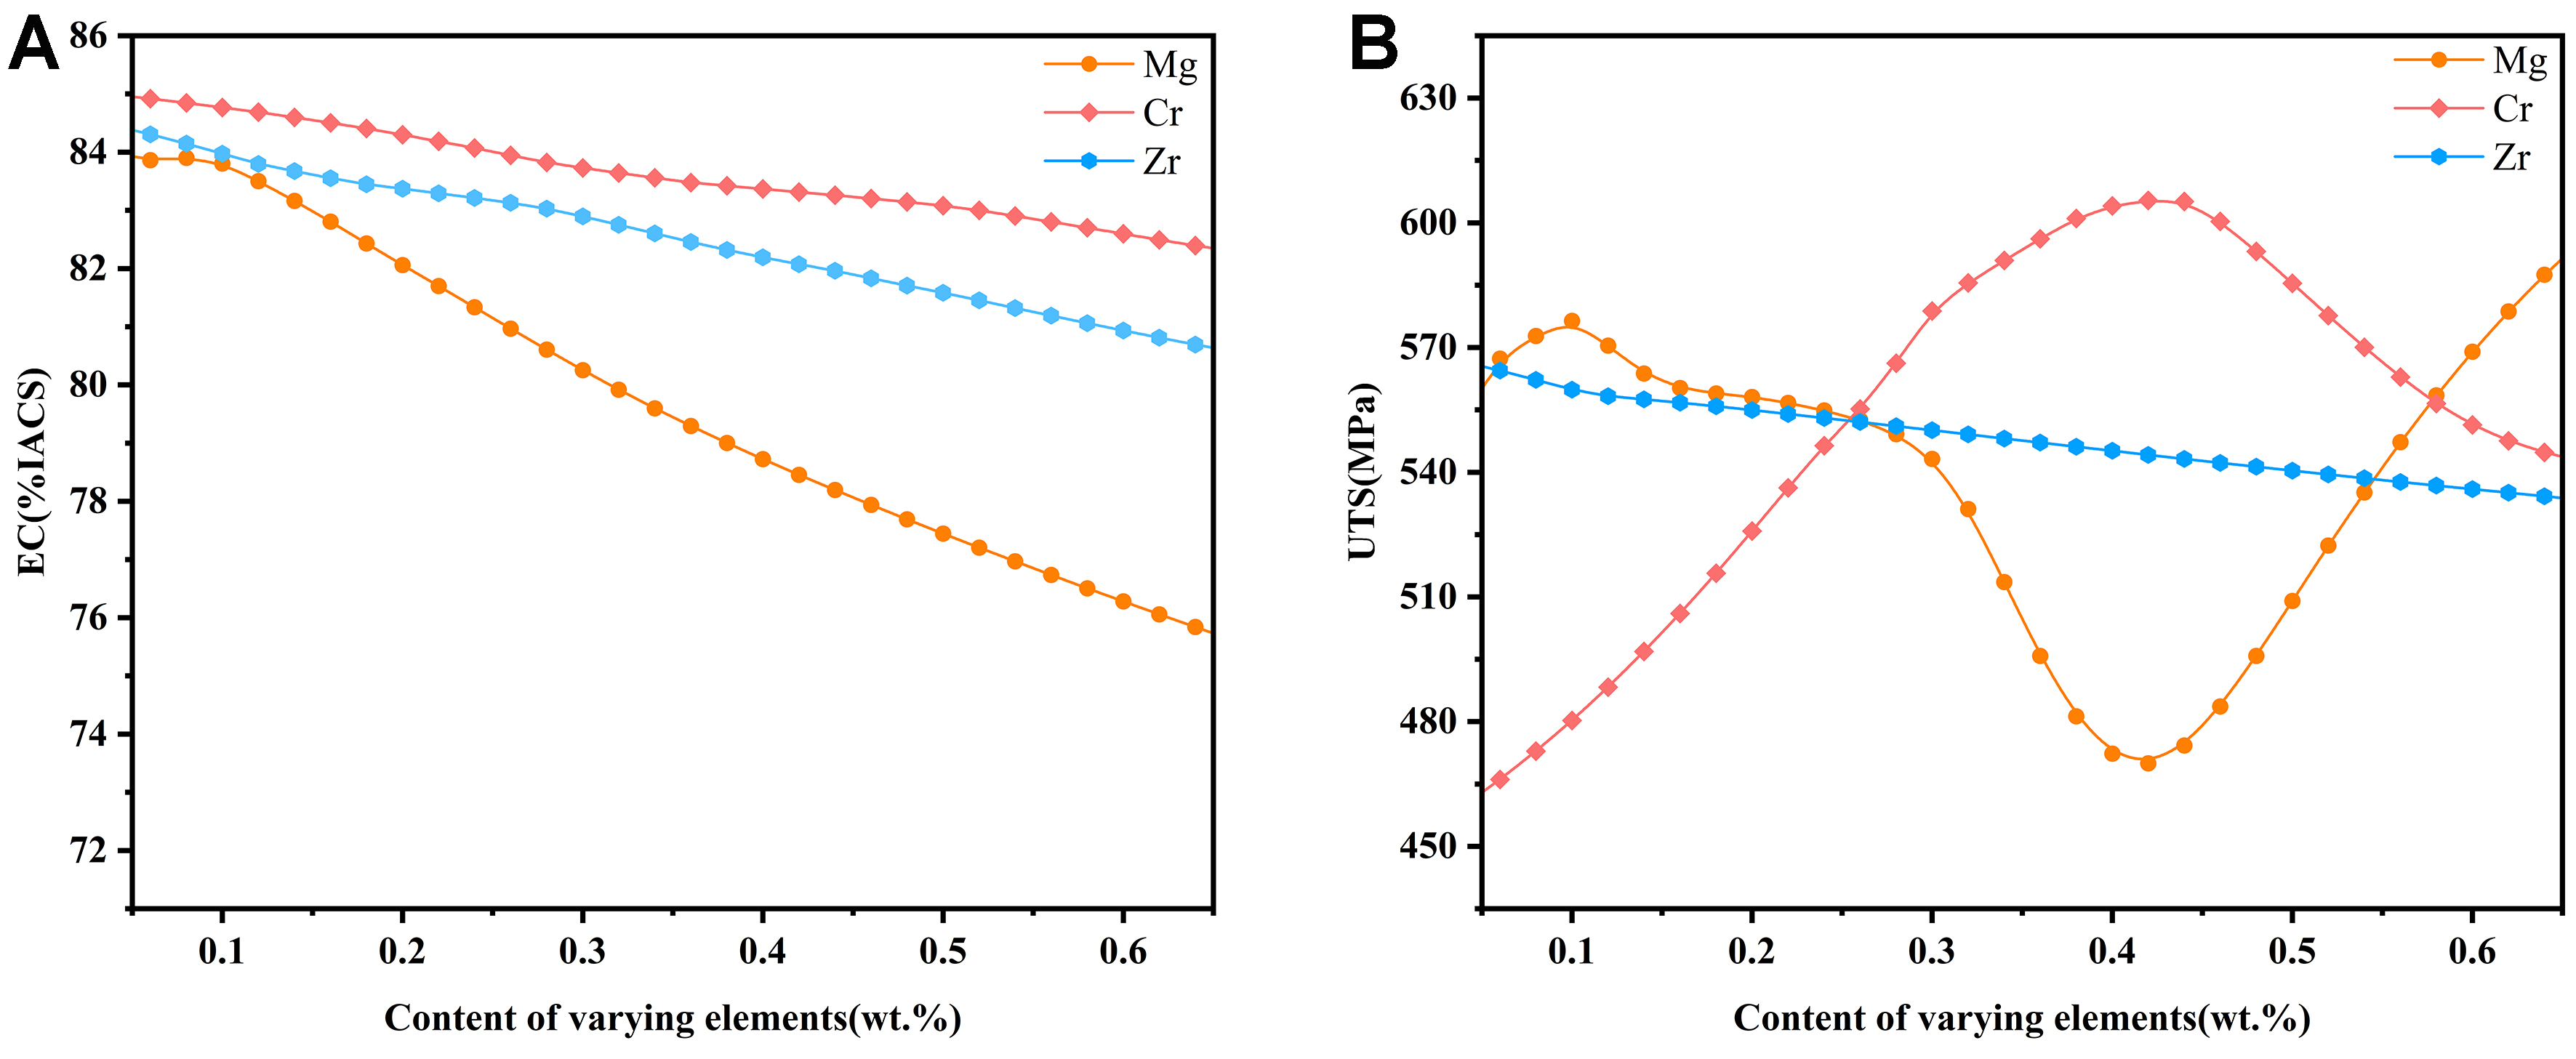
Figure 12. Alloying effect on (A) EC and (B) UTS in Cu-0.05Mg-0.27Cr-0.11Zr (wt.%). In each line, only one element varies, with Cu as the balancing element. EC: Electrical conductivity; UTS: ultimate tensile strength; %IACS: international annealed copper standard.
From Figure 12, as the Mg content increases, there is a significant decrease in its EC. Sun et al. pointed out that the addition of Mg can retard the growth and coarsening of Cr precipitates, which improves the mechanical properties but slightly reduces the EC[28]. The alloy’s tensile strength is only 560 MPa when the Mg content is 0.05 wt.%, but the model’s predicted value for Mg at 0.1 wt.% increases to 576 MPa. Hence, increasing the Mg content from 0.05 wt.% to 0.1 wt.% improves the UTS with a negligible decrease in conductivity. However, when the Mg content exceeds 0.1 wt.%, both UTS and EC experience significant drops. In particular, the UTS decreases by 80 MPa at 0.45 wt.% compared to 560 MPa at 0.05 wt.%. This decrease in strength is due to the formation of a complex Mg-Zr compound, which obstructs the formation of strengthening precipitates containing Cr and Zr. Subsequently, the strength of the alloy rapidly increases when the Mg content exceeds 0.45 wt.%, indicating a potential grain refinement effect from the addition of magnesium[29].
Due to the very low solubility of Cr and Zr in the Cu matrix, Cr and Zr prefer to precipitate from the Cu matrix during the aging process. As a result, the effect of Cr and Zr on EC is much smaller compared to Mg[30], while Cr enhances UTS through second-phase strengthening. From Figure 12, it can be seen that Cr has a significant effect on UTS, with UTS increasing as Cr content rises from 0 wt.% to 0.45 wt.%. The predicted UTS of the Cu-0.05Mg-xCr-0.11Zr alloy exceeds 600 MPa over the range 0.4 < x < 0.46.
The effect of Zr on UTS differs from that of Cr. UTS tends to decrease as Zr content increases. This decrease in strength with Zr addition can be attributed to the reduced solubility of the remaining elements and an increase in the grain size of the matrix[31]. Additionally, Pang et al. proposed that the stacking fault energy of Cu-Cr alloys decreases with the addition of Zr, leading to a more widespread occurrence of stacking faults and twins[32]. Based on this phenomenon, a method involving the introduction of precipitated particles into the microstructure to form nanoscale deformation twins has been proposed[33], which results in an significant improvement in UTS with only a slight decrease in EC.
Alloy inverse design based on ML modeling
Besides property prediction, the well-constructed ML model can also be further integrated with swarm intelligence algorithms to enable performance-driven inverse design of alloy compositions. In this inverse design framework, target properties such as EC and UTS are explicitly specified, and the algorithm systematically explores the compositional space to identify feasible solutions that meet these objectives, rather than selecting from a predefined set of candidates. This work uses the MOGWO algorithm[34] for inverse composition design in the HSHC Cu alloy, and the main parameters are shown in Table 2. In MOGWO, the positions of individual grey wolves are initialized randomly through a series of processes and are constrained within the upper and lower bounds of the variables. At each iteration, the individuals update their positions by mimicking three bootstrap positions (alpha, beta, and delta) to explore new potential non-dominated solutions. As iterations proceed, the population gradually approaches the Pareto frontier. Eventually, the non-dominated solutions collected in the archive constitute the Pareto frontier approximation, which is the final set of optimal solutions for this multi-objective optimization problem. Though the element ratios can be set in MOGWO, in the present optimization, the alloying elements are treated as independent variables without imposing explicit compositional ratio constraints, e.g., Ni/Si. which is quite important in Cu-Ni-Si related systems to precipitate δ-Ni2Si[35,36].
Main parameters of the MOGWO model
| Main parameters | Parameter values |
| Number of variables | 26 |
| Size of the population | 600 |
| Maximum iterations | 400 |
| Archive_size | 100 |
| Grid expansion parameter (alpha) | 0.1 |
| Number of grids per dimension (nGrid) | 29 |
| Selection pressure parameter for leader individuals (beta) | 4 |
| Selection pressure parameter for deleted individuals in the archive (gamma) | 2 |
Considering the large number of alloying elements, we explore the Pareto frontier for several common systems using MOGWO: (1) Cu-Zr-Cr with Mg[37] addition, (2) Cu-Ni-Si with Fe[38] and Cr[39] addition, (3) all three common high-strength, high-conductivity systems (Cu-Cr-Zr, Cu-Ni-Si, and Cu-Fe-P) plus Ag, which has been shown to synergistically enhance strength and conductivity when added in small amounts to copper-based alloys[40,41], and (4) Mn[42] addition to system (3). In the reverse design process, the content of each element, excluding the balance element (Cu), is constrained within the corresponding range from the original dataset, while elements not listed are limited to 0. The Pareto fronts between EC and UTS for the four systems are illustrated in Figure 13. Cu-Cr-Zr-Mg exhibits high EC and moderate UTS. However, both EC and UTS can be tuned across a wide range in the Cu-Ni-Si-Fe-Cr system. In this system, we can get alloys with large EC and moderate UTS (e.g., EC > 80 %IACS and UTS ≈ 650 MPa), as well as alloys with ultra-high strength and moderate EC (e.g., UTS > 1,100 MPa and EC ≈ 30 %IACS). When adding Zr, P, and Ag, the Pareto frontier of Cu-Cr-Zr-Ni-Si-Fe-P-Ag is quite close to that of Cu-Cr-Ni-Si-Fe, and the biggest difference is that the Cu-Cr-Zr-Ni-Si-Fe-P-Ag would promote the UTS when EC ranges from 35 %IACS to 45 %IACS. However, when Mn is added to Cu-Cr-Zr-Ni-Si-Fe-P-Ag, the Pareto frontier takes a big step forward, especially when 60 %IACS < EC < 85 %IACS. In addition, there are a large number of alloys that satisfy the following criteria: UTS > 600 MPa and EC > 80 %IACS, some of which are listed in Table 3.
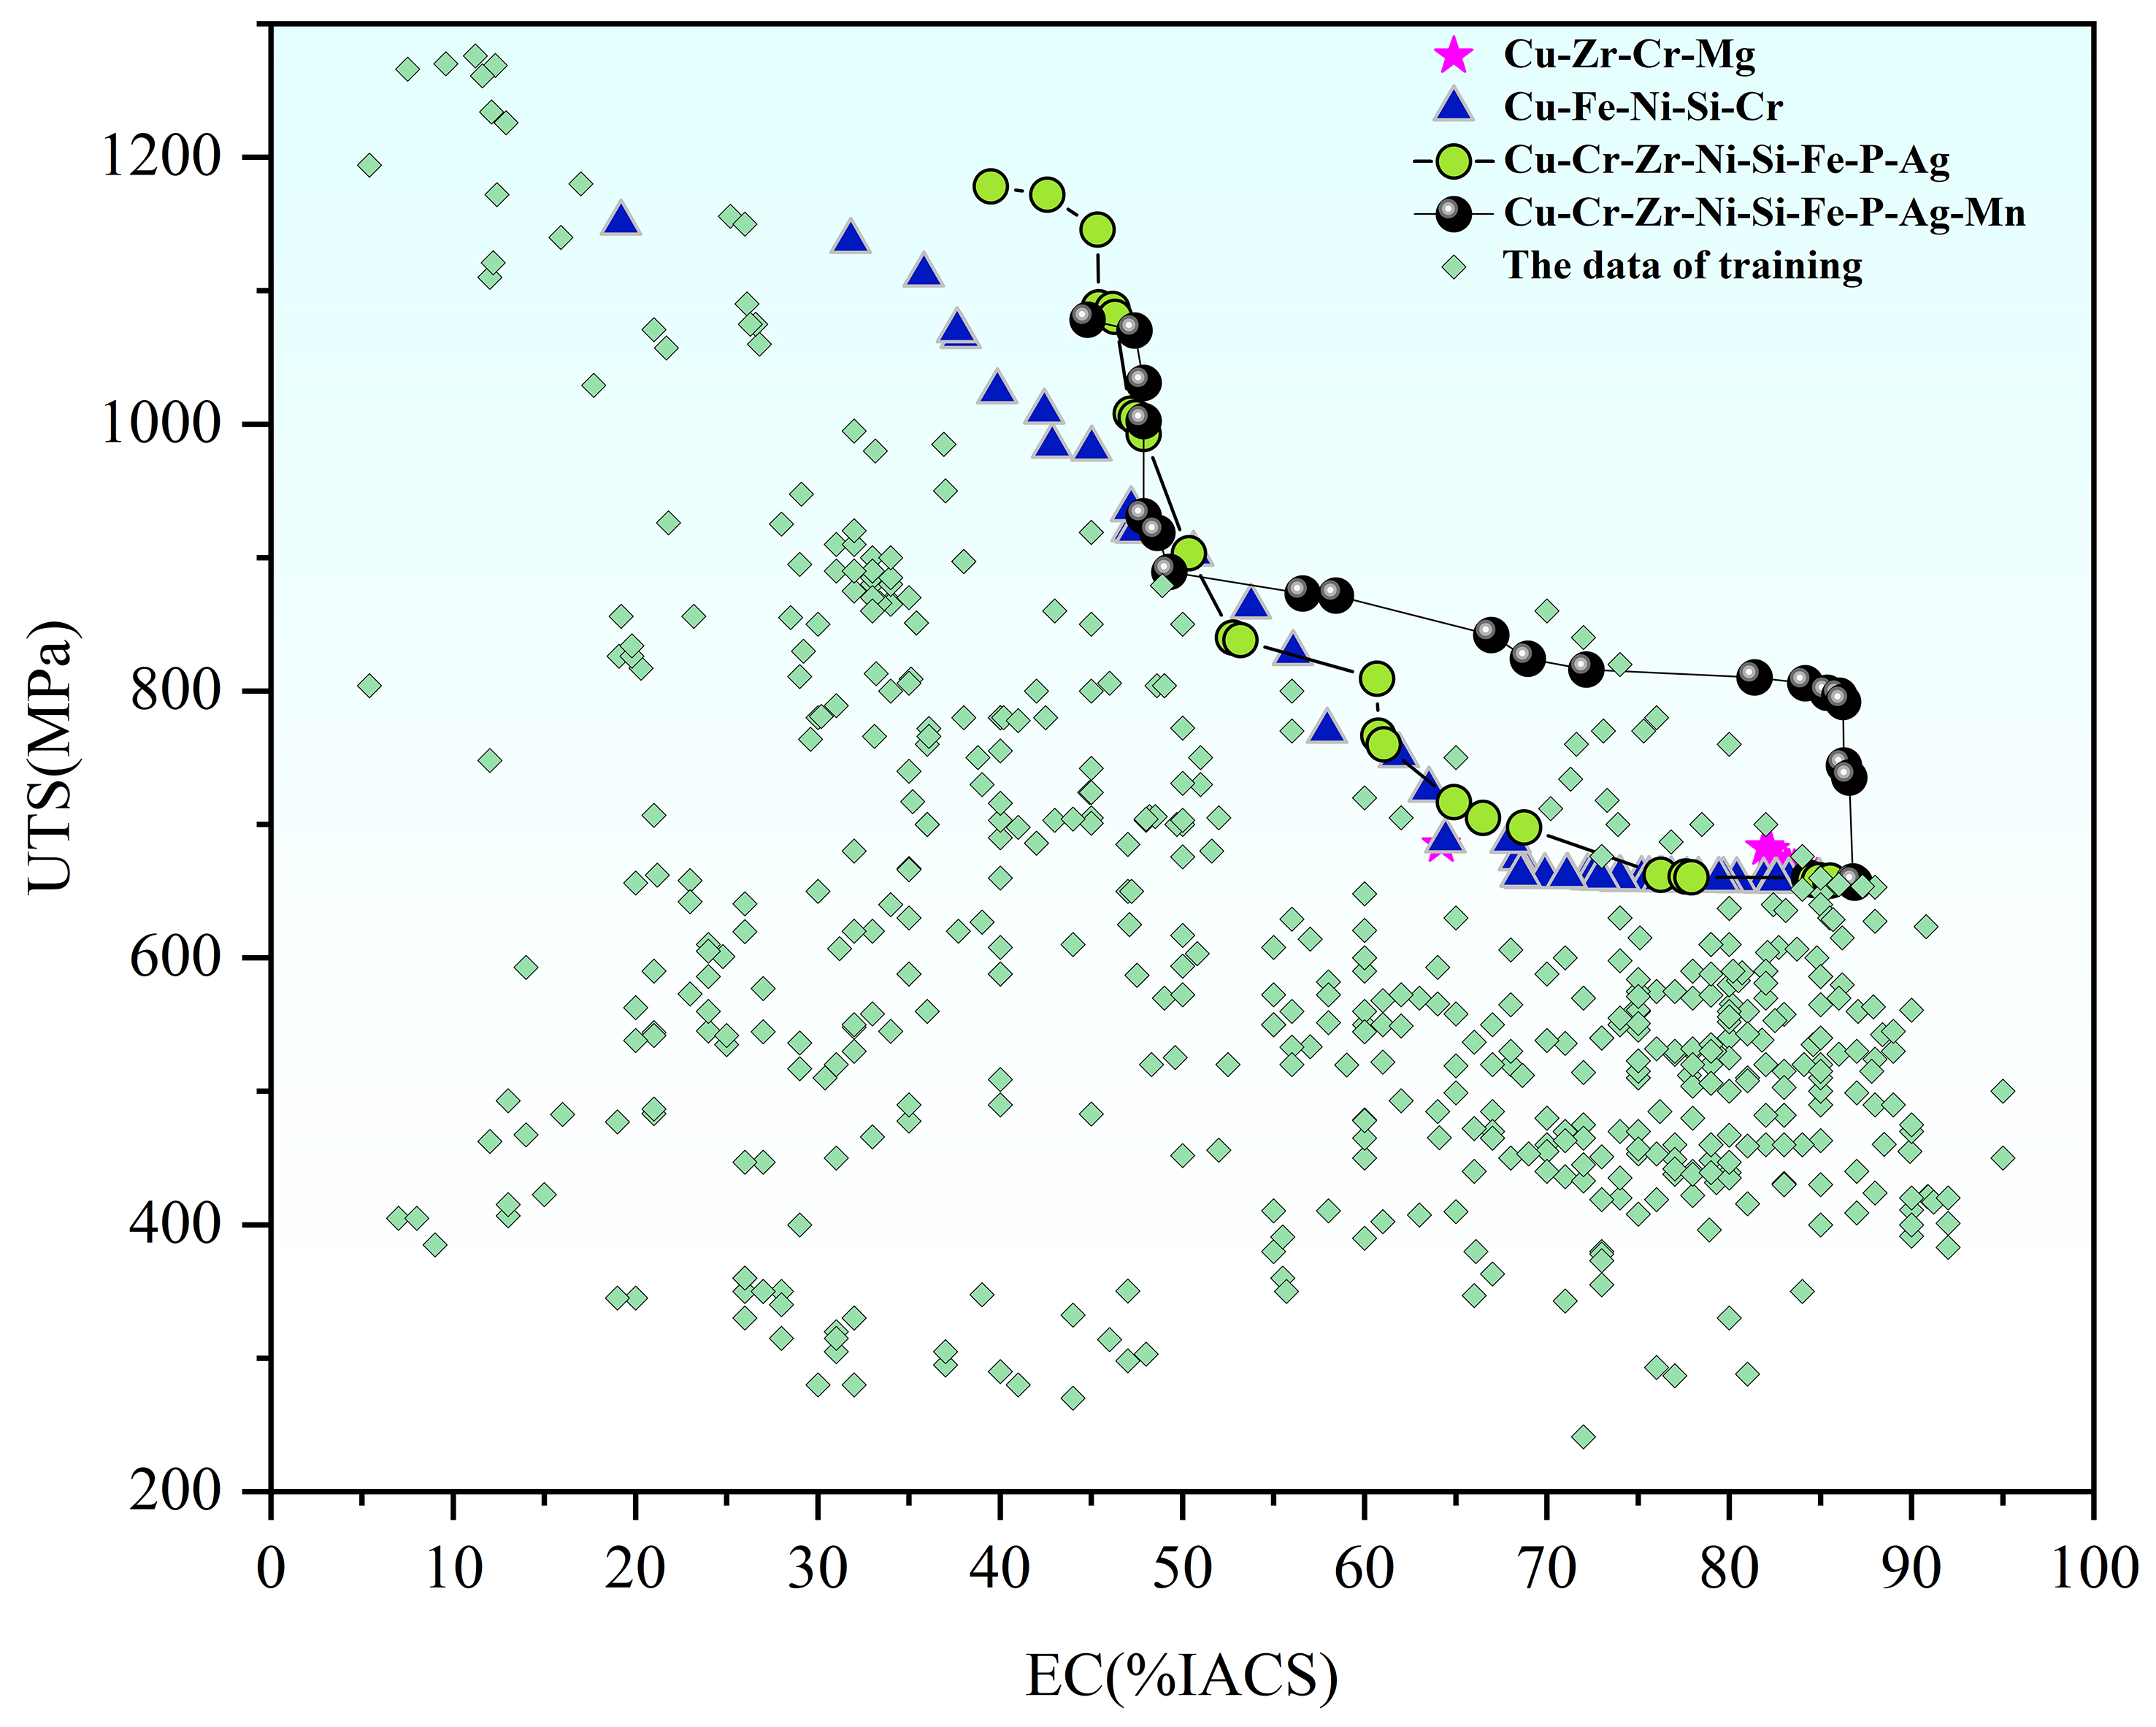
Figure 13. Pareto front between EC and UTS in HSHC Cu alloys. EC: Electrical conductivity; UTS: ultimate tensile strength; HSHC: high-strength and high-conductivity; %IACS: international annealed copper standard.
Alloy composition display of optimization results
| Composition | Pre. Conductivity (%IACS) | Pre. UTS (MPa) |
| Cu-0.03Mg-0.04Cr-4.01Zr | 85.4 | 658.4 |
| Cu-0.02Fe-0.21Ni-0.03Si-0.08Cr | 85.3 | 679.3 |
| Cu-0.03Fe-0.44Ni-0.01Si-0.01Cr | 80.4 | 658.1 |
| Cu-0.01Fe-0.03P-0.01Ni-0.02Si-0.06Cr-2.33Ag-0.64Mn-0.5Zr | 81.4 | 810.1 |
| Cu-0.01Fe-0.11P-0.01Ni-0.02Si-0.06Cr-5.37Ag-0.65Mn-0.29Zr | 86.2 | 792.0 |
It is worth noting that the Ag-containing alloys listed in Table 3 exhibit relatively high Ag contents, showing that Ag is a promising element for HSHC Cu alloys, which is well-validated in previous experiments. On the one hand, Cu-Ag is a classic HSHC system[43-46] as Ag can form nano-sized phases, e.g., nanotwins. In our dataset, about 87.5% Ag-containing samples show high EC (> 80 %IACS). In the other hand, besides the expensive Cu-Ag binary system, small amount of Ag can tune the properties of other cheap systems. Shi et al. demonstrated that the addition of Ag in Cu-10Fe alloys accelerated Fe-rich precipitation, refined the microstructure, and achieved simultaneous improvement in both strength and conductivity[47].
CONCLUSION
In this paper, we constructed an alloy design paradigm for HSHC Cu alloys from model construction to compositional inverse design by integrating feature engineering, ML, SHAP model, and swarm intelligence algorithm. We enabled controllable multi-objective optimization. This framework allows simultaneous tuning of EC and UTS while imposing flexible constraints on elemental composition and content. The main conclusions are listed as follows:
(1) We constructed a ML model among composition, physical features, and properties of Cu alloys using the GPR algorithm with the exponential kernel function.
(2) Through feature engineering, several key physical features, including electron affinity, first ionization energy, work function, etc., are identified and integrated into the ML model, and the error of the final ML model is less than 9%.
(3) With SHAP analysis, the top three physical features affecting the EC (UTS) are valence electron density, work function, and first ionization energy (work function, modulus of rigidity, and enthalpy of melting), and the top five elements affecting the EC (UTS) are Ni, Si, Sn, Zn, and Fe (Ni, Si, Cr, P, and Sn).
(4) The Pareto front for EC and UTS of HSHC Cu alloys was predicted. It was found that Mn clearly enhances the Pareto frontier, especially within the EC range of 60 %IACS - 85 %IACS.
DECLARATIONS
Authors’ contributions
Writing - original draft, methodology, software, investigation, formal analysis, visualization: Wu, C.
Conceptualization, methodology, writing - review and editing, funding acquisition: Liao, M.
Visualization, investigation: Zhou, X.
Data curation, investigation: Chen, J.
Data curation, validation: Qian, X.
Data curation, writing - reviewing and editing: Wang, Y.
Writing - reviewing and editing, resources: Zhou, F.
Writing - review and editing, supervision, funding acquisition: Wang, F.
Availability of data and materials
The data presented in this study are available upon request from the corresponding author.
Financial support and sponsorship
This work was financially supported by the Jiangsu Province Natural Science Foundation for Youths (No. BK20230673) and the National Natural Science Foundation of China (Nos. 51875269 and 52275193).
Conflicts of interest
All authors declared that there are no conflicts of interest.
Ethical approval and consent to participate
Not applicable.
Consent for publication
Not applicable.
Copyright
© The Author(s) 2026.
REFERENCES
1. Yang, K.; Wang, Y.; Guo, M.; et al. Recent development of advanced precipitation-strengthened Cu alloys with high strength and conductivity: a review. Prog. Mater. Sci. 2023, 138, 101141.
2. He, S. Y.; Xiong, D. B. Application status of copper-based materials in integrated circuits and prospect on their composites with graphene. Chin. J. Nonferrous. Met. 2022, 33, 1349-77. (in Chinese).
3. Shan, L.; Yang, L.; Wang, Y. Improving the high temperature mechanical performance of Cu–Cr alloy induced by residual nano-sized Cr precipitates. Mater. Sci. Eng. A. 2022, 845, 143250.
4. Mishnev, R.; Shakhova, I.; Belyakov, A.; Kaibyshev, R. Deformation microstructures, strengthening mechanisms, and electrical conductivity in a Cu–Cr–Zr alloy. Mater. Sci. Eng. A. 2015, 629, 29-40.
5. Shang, Y.; Xiong, Z.; An, K.; Hauch, J. A.; Brabec, C. J.; Li, N. Materials genome engineering accelerates the research and development of organic and perovskite photovoltaics. MGE. Advances. 2024, 2, e28.
6. Lv, C.; Zhou, X.; Zhong, L.; et al. Machine learning: an advanced platform for materials development and state prediction in lithium-ion batteries. Adv. Mater. 2022, 34, e2101474.
7. Liao, X.; Liao, M.; Wei, C.; et al. A process-structure-property model via physics-based/data-driven hybrid methods for freeze-cast porous ceramics in Si3N4-Si2N2O case system. Acta. Mater. 2024, 269, 119819.
8. Xi, S.; Yu, J.; Bao, L.; et al. Predicting atomic structure and mechanical properties in quinary L12-Strengthened cobalt-based superalloys using machine learning-driven first-principles calculations. Mater. Today. Commun. 2024, 38, 107774.
9. Chen, Z.; Yang, Y. Data-driven design of eutectic high entropy alloys. J. Mater. Inf. 2023, 3, 10.
10. Jin, H.; Zhang, H.; Li, J.; et al. Discovery of novel two-dimensional photovoltaic materials accelerated by machine learning. J. Phys. Chem. Lett. 2020, 11, 3075-81.
11. Ojih, J.; Onyekpe, U.; Rodriguez, A.; Hu, J.; Peng, C.; Hu, M. Machine learning accelerated discovery of promising thermal energy storage materials with high heat capacity. ACS. Appl. Mater. Interfaces. 2022, 14, 43277-89.
12. Ghorbani, M.; Boley, M.; Nakashima, P.; Birbilis, N. A machine learning approach for accelerated design of magnesium alloys. Part A: Alloy data and property space. J. Magnes. Alloys. 2023, 11, 3620-33.
13. Zhang, X. Q.; Chen, M. Heat treatment schedule model of high strength and high conductivity copper alloy based on RBF artificial neural network. Trans. Mater. Heat. Treat. 2022, 43, 154-60. (in Chinese).
14. Wang, C.; Fu, H.; Jiang, L.; Xue, D.; Xie, J. A property-oriented design strategy for high performance copper alloys via machine learning. npj. Comput. Mater. 2019, 5, 227.
15. Ozerdem, M. S.; Kolukisa, S. Artificial neural network approach to predict the mechanical properties of Cu–Sn–Pb–Zn–Ni cast alloys. Mater. Design. 2009, 30, 764-9.
16. Zhao, Q.; Yang, H.; Liu, J.; Zhou, H.; Wang, H.; Yang, W. Machine learning-assisted discovery of strong and conductive Cu alloys: data mining from discarded experiments and physical features. Mater. Design. 2021, 197, 109248.
17. Villars, P.; Brandenburg, K.; Berndt, M.; et al. Binary, ternary and quaternary compound former/nonformer prediction via Mendeleev number. J. Alloys. Compd. 2001, 317-8, 26-38.
18. Zhang, X.; Zhang, Y.; Tian, B.; et al. Review of nano-phase effects in high strength and conductivity copper alloys. Nanotechnol. Rev. 2019, 8, 383-95.
19. Zhang, H.; Fu, H.; Zhu, S.; Yong, W.; Xie, J. Machine learning assisted composition effective design for precipitation strengthened copper alloys. Acta. Mater. 2021, 215, 117118.
20. Gorsse, S.; Gouné, M.; Lin, W. C.; Girard, L. Dataset of mechanical properties and electrical conductivity of copper-based alloys. Sci. Data. 2023, 10, 504.
21. He, S.; Wang, Y.; Zhang, Z.; et al. Interpretable machine learning workflow for evaluation of the transformation temperatures of TiZrHfNiCoCu high entropy shape memory alloys. Mater. Design. 2023, 225, 111513.
23. Lu, H.; Zhao, C.; Wang, H.; Liu, X.; Yu, R.; Song, X. Hardening tungsten carbide by alloying elements with high work function. Acta. Crystallogr. B. Struct. Sci. Cryst. Eng. Mater. 2019, 75, 994-1002.
24. Li, J.; Huang, G.; Mi, X.; Peng, L.; Xie, H.; Kang, Y. Effect of Ni/Si mass ratio and thermomechanical treatment on the microstructure and properties of Cu-Ni-Si alloys. Materials 2019, 12, 2076.
25. Cheng, J.; Tang, B.; Yu, F.; Shen, B. Evaluation of nanoscaled precipitates in a Cu-Ni-Si-Cr alloy during aging. J. Alloys. Compd. 2014, 614, 189-95.
26. Pan, S.; Yu, J.; Han, J.; et al. Customized development of promising Cu-Cr-Ni-Co-Si alloys enabled by integrated machine learning and characterization. Acta. Mater. 2023, 243, 118484.
27. Peng, L. J.; Xie, H. F.; Huang, G. J.; Yang, Z.; Mi, X. J.; Xiong, B. Q. Dynamics of phase transformation in Cu-Cr-Zr alloy. Adv. Mater. Res. 2014, 887-8, 333-7.
28. Sun, Y.; Peng, L.; Huang, G.; Xie, H.; Mi, X.; Liu, X. Effects of Mg addition on the microstructure and softening resistance of Cu–Cr alloys. Mater. Sci. Eng. A. 2020, 776, 139009.
29. Han, Z.; Zhou, M.; Jing, K.; et al. Effect of Mg addition on the microstructure and mechanical properties of Cu-Ti-Zr alloy. J. Alloys. Compd. 2024, 1004, 175897.
30. Ban, Y.; Zhang, Y.; Jia, Y.; et al. Effects of Cr addition on the constitutive equation and precipitated phases of copper alloy during hot deformation. Mater. Design. 2020, 191, 108613.
31. Han, L.; Liu, J.; Tang, H.; Yan, Z. Study of Zr addition on the composition, crystallite size, microstructure and properties of high-performance nano Cu alloys prepared by mechanical alloying. Mater. Chem. Phys. 2022, 290, 126630.
32. Pang, Y.; Xia, C.; Wang, M.; et al. Effects of Zr and (Ni, Si) additions on properties and microstructure of Cu-Cr alloy. J. Alloys. Compd. 2014, 582, 786-92.
33. Li, R.; Kang, H.; Chen, Z.; et al. A promising structure for fabricating high strength and high electrical conductivity copper alloys. Sci. Rep. 2016, 6, 20799.
34. Mirjalili, S.; Mirjalili, S. M.; Lewis, A. Grey wolf optimizer. Adv. Eng. Softw. 2014, 69, 46-61.
35. Tao, S.; Lu, Z.; Jia, L.; Xie, H.; Zhang, J. Effect of Ni/Si mass ratio on microstructure and properties of Cu-Ni-Si alloy. Mater. Res. Express. 2020, 7, 066520.
36. Xue, W.; Xie, G.; Huang, X.; et al. Achieving high strength and high-electrical-conductivity of Cu-Ni-Si alloys via regulating nanoprecipitation behavior through simplified process. J. Mater. Sci. Technol. 2025, 216, 121-9.
37. Su, J.; Dong, Q.; Liu, P.; Li, H.; Kang, B. Research on aging precipitation in a Cu-Cr-Zr-Mg alloy. Mater. Sci. Eng. A. 2005, 392, 422-6.
38. Wang, M.; Yang, Q.; Jiang, Y.; et al. Effects of Fe content on microstructure and properties of Cu-Fe alloy. Trans. Nonferrous. Met. Soc. China. 2021, 31, 3039-49.
39. Wang, W.; Kang, H.; Chen, Z.; et al. Effects of Cr and Zr additions on microstructure and properties of Cu-Ni-Si alloys. Mater. Sci. Eng. A. 2016, 673, 378-90.
40. Zhao, X.; Wang, E.; An, B.; et al. Effects of Sc doping on microstructure and properties of high strength and high conductivity Cu-6 wt%Ag alloy wires with large section size for ultra-high pulsed magnet coils. Mater. Sci. Eng. A. 2025, 927, 148038.
41. Xiao, Z.; Ding, Y.; Wang, Z.; et al. Research and development of advanced copper matrix composites. Trans. Nonferrous. Met. Soc. China. 2024, 34, 3789-821.
42. Zhang, C.; Xiao, X.; Yang, W.; Gao, W.; Li, Q.; He, J. Microstructural evolution and properties of a Cu-Fe-Mn-P alloys with high strength and high conductivity. Mater. Today. Commun. 2024, 39, 108611.
43. Yang, H.; Ma, Z.; Lei, C.; et al. High strength and high conductivity Cu alloys: a review. Sci. China. Technol. Sci. 2020, 63, 2505-17.
44. Zhang, B.; Tao, N.; Lu, K. A high strength and high electrical conductivity bulk Cu-Ag alloy strengthened with nanotwins. Scr. Mater. 2017, 129, 39-43.
45. Kong, L.; Zhu, X.; Xing, Z.; et al. Preparation and mechanisms of Cu-Ag alloy fibers with high strength and high conductivity. Mater. Sci. Eng. A. 2024, 895, 146219.
46. Tian, Y.; Zhang, Z. Bulk eutectic Cu-Ag alloys with abundant twin boundaries. Scr. Mater. 2012, 66, 65-8.
Cite This Article
How to Cite
Download Citation
Export Citation File:
Type of Import
Tips on Downloading Citation
Citation Manager File Format
Type of Import
Direct Import: When the Direct Import option is selected (the default state), a dialogue box will give you the option to Save or Open the downloaded citation data. Choosing Open will either launch your citation manager or give you a choice of applications with which to use the metadata. The Save option saves the file locally for later use.
Indirect Import: When the Indirect Import option is selected, the metadata is displayed and may be copied and pasted as needed.
About This Article
Copyright

Data & Comments
Data
0


Comments
Comments must be written in English. Spam, offensive content, impersonation, and private information will not be permitted. If any comment is reported and identified as inappropriate content by OAE staff, the comment will be removed without notice. If you have any queries or need any help, please contact us at [email protected].