


Deep learning-enhanced cellular automaton framework for modeling static recrystallization behavior
 0
0 Abstract
Accurately characterizing dislocation behavior - the driving force behind nucleation and growth of recrystallized grains - has long been a formidable challenge for traditional cellular automata methods. We are proud to unveil a groundbreaking, machine learning-enhanced cellular automaton framework that fundamentally transforms the mapping of dislocation substructures while expertly modeling static recrystallization (SRX) behavior. By integrating the dislocation escape assumption during recovery, we decisively eliminate spatial resolution limitations and capture the intricate mesoscopic dynamics of dislocation evolution with unprecedented precision. Our innovative approach has demonstrated extraordinary effectiveness in predicting the recrystallization kinetics of a typical austenitic alloy, bolstered by strong experimental validation. The deep learning-based dislocation implantation module, SRX-net, stands out as a game-changer, surpassing traditional techniques such as random forests and U-net by showcasing exceptional capabilities in identifying complex intracrystalline substructures and managing uneven strain concentrations. The proposed advanced simulations yield critical insights into dislocation density variations, highlighting significant local fluctuations driven by dislocation escape. Importantly, while the migration and accumulation of dislocations may falter in meeting nucleation conditions during grain growth, our model excels in accurately predicting average SRX grain sizes without introducing any unphysical artifacts. This revolutionary framework dramatically reduces time-to-solution, empowering comprehensive parametric studies and enabling near real-time recrystallization simulations, thus setting a bold new standard for industrial applications.
Keywords
INTRODUCTION
The escalating demand for products with complex shapes and functionalities propels the ongoing advancement of the metal component production chain. The prevailing material forming method involves modifying the microstructure through strain-free grain nucleation and growth, as well as strain-induced grain boundary migration via suitable thermomechanical treatments[1]. Generally, metallic materials undergo multi-pass deformation during hot forming, which can introduce complex microstructure evolution mechanisms, including static recovery (SRV), static recrystallization (SRX), and metadynamic recrystallization (MDRX) among others. Moreover, achieving alloys with some desired mechanical properties necessitates a comprehensive consideration of both deformation processing parameters and key microstructure features, such as crystallographic texture, grain size distribution, and phase volume fraction, which collectively govern material performance. This often requires a thorough understanding of the impact of thermally activated recrystallization behavior on microstructure evolution.
Studying the microstructural characteristics during grain growth through physical experiments presents significant challenges. Consequently, many researchers have concentrated on both experimental and theoretical investigations of SRX behavior, leading to the development of various computer simulation methods that establish mapping relationships[2,3]. Currently, the most extensively utilized field models encompass the cellular automaton (CA) model, the phase field model, and the Monte Carlo model. Among these, the CA model has emerged as an effective approach for representing the discrete spatial and temporal evolution of microstructure at mesoscopic scales. It allows for intuitive simulations of microstructural changes while maintaining high computational efficiency. Since Hesselbarth and Göbel introduced the foundational CA algorithm for recrystallization modeling[4], several CA models have been developed to simulate recrystallization evolution under complex thermomechanical processing conditions. However, an accurate model for predicting microstructure evolution typically relies on very precise initial crystallographic information, such as grain size and anisotropy, since these factors can significantly influence nucleation and growth during recrystallization[5].
Besides, the stored deformation energy plays a critical role as the primary driving force for the nucleation and subsequent growth of recrystallization grains. Studies have shown that tailoring dislocation behavior can effectively overcome the strength-ductility trade-off[6]. Hence, dislocation behavior modeling has continuously been a focal point and challenge for SRX full-field modeling. Papanikolaou et al. generated aluminum crystalline thin-film samples with varying levels of pre-deformation via two-dimensional (2D) discrete dislocation dynamics simulations and extracted spatial strain-correlation features during the test deformation stage[7]. By combining principal component analysis with a continuous k-nearest neighbors algorithm, they achieved accurate identification of the material’s prior plastic deformation states. The study highlights the promise of coupling physical modeling and machine learning (ML) techniques for inverse reconstruction of past stress conditions. Eghtesad et al. embedded a density functional theory (DFT)-informed dislocation-density (DD) hardening law into a full-field crystal plasticity fast Fourier transform (CPFFT) model and systematically investigated, in polycrystalline pure Ni, the nonlinear relationships between microscale stress concentrations and microstructural attributes[8]. Using field data extracted at 20% strain, a random forest (RF) regression was trained to link voxel-level descriptors to stress/strain hotspots. SHapley Additive exPlanations (SHAP)-based interpretability revealed that the Schmid factor, slip transfer factor, grain boundary misorientation angle, and grain size are of pronounced importance. Conventional approaches for determining crystal plasticity (CP) parameters suffer from low efficiency, high computational cost, and limited parameter dimensionality, making them inadequate for modeling the micro-macro behavior of complex materials. Jiang et al. proposed an efficient CP parameter optimization method for Al-Cu eutectic alloys by introducing a coefficient of determination for crystal plasticity simulation (Cecp) metric built from experimental stress-strain curves and coupling it with Gaussian process regression and active learning[9]. With only six iterations, the optimal parameters were identified from 1010 combinations, markedly improving simulation accuracy and efficiency and validating the method’s applicability and generality to high-dimensional nonlinear parameter optimization problems.
However, in the CA field, the initial approach involved introducing energy into the CA computational domain along grain boundaries (GBs), either a homogeneous or heterogeneous manner. During plastic deformation, complex strain heterogeneity and plastic anisotropy are commonly observed[10,11]. Additionally, variations in dislocation characteristics can also affect the ferrite recrystallization behavior[12]. To address these challenges, some modified models used a distribution function to define the internal energy distribution structure within the deformation grains. Raabe and Becker developed a coupled CP finite element method (CPFEM) combined with a CA algorithm to simulate primary recrystallization following heterogeneous deformation[13]. Building upon this work, Li et al. created a 3D coupled CA-CPFEM framework to investigate the interplay among heterogeneous deformation, mechanical response, and microstructure evolution during the hot working of TA15 titanium alloy[14]. This integrated framework effectively predicts macroscale forming behavior, mesoscale deformation mechanisms, and microscale microstructure evolution, with potential application in other material processes. Unfortunately, although the coupled CPFEM and CA framework improves adaptability to heterogeneous deformation structures, it also significantly escalates the computational cost. It is well known that the practical applications of CA models at the industrial scale invariably necessitate a reduction in computational time from hours to seconds to deliver timely results, particularly for complex structures or 3D-CA models. Therefore, developing an accurate and computationally efficient CA model for describing SRX behavior holds significant value for industrial applications.
Recently, many efforts have focused on leveraging advanced computational techniques, such as parallel processing and adaptive meshing, to drastically reduce simulation times without sacrificing model fidelity. Sitko et al. proposed that the parallel CA-SRX model could significantly enhance computation efficiency, achieving speedups of around 70 and 120 times for the 2D and 3D scenarios, respectively[15]. In contrast, heterogeneous deformation structures continue to be predicted based on CPFEM, leading to increased simulation time for the entire process. It is worth noting that the intensive growth of machine learning has provided an opportunity for further improving recrystallization models, enhancing predictive capability and computational efficiency while allowing for explicit consideration of microstructural evolution. Though the construction of a parameter mapping relationship requires substantial data and time, machine learning can rapidly generate predictive results after the training process. However, few CA models driven by machine learning can be found in the previous works, which are mainly focused on the cell transition rules[16]. In terms of modeling the microstructure evolution of solid metallic materials, can machine learning approaches be employed to reduce or optimize the dependence of CA model on CPFEM during dislocation implantation? If so, the integration of machine learning could further enhance the feasibility of the employed CA model for industrial applications.
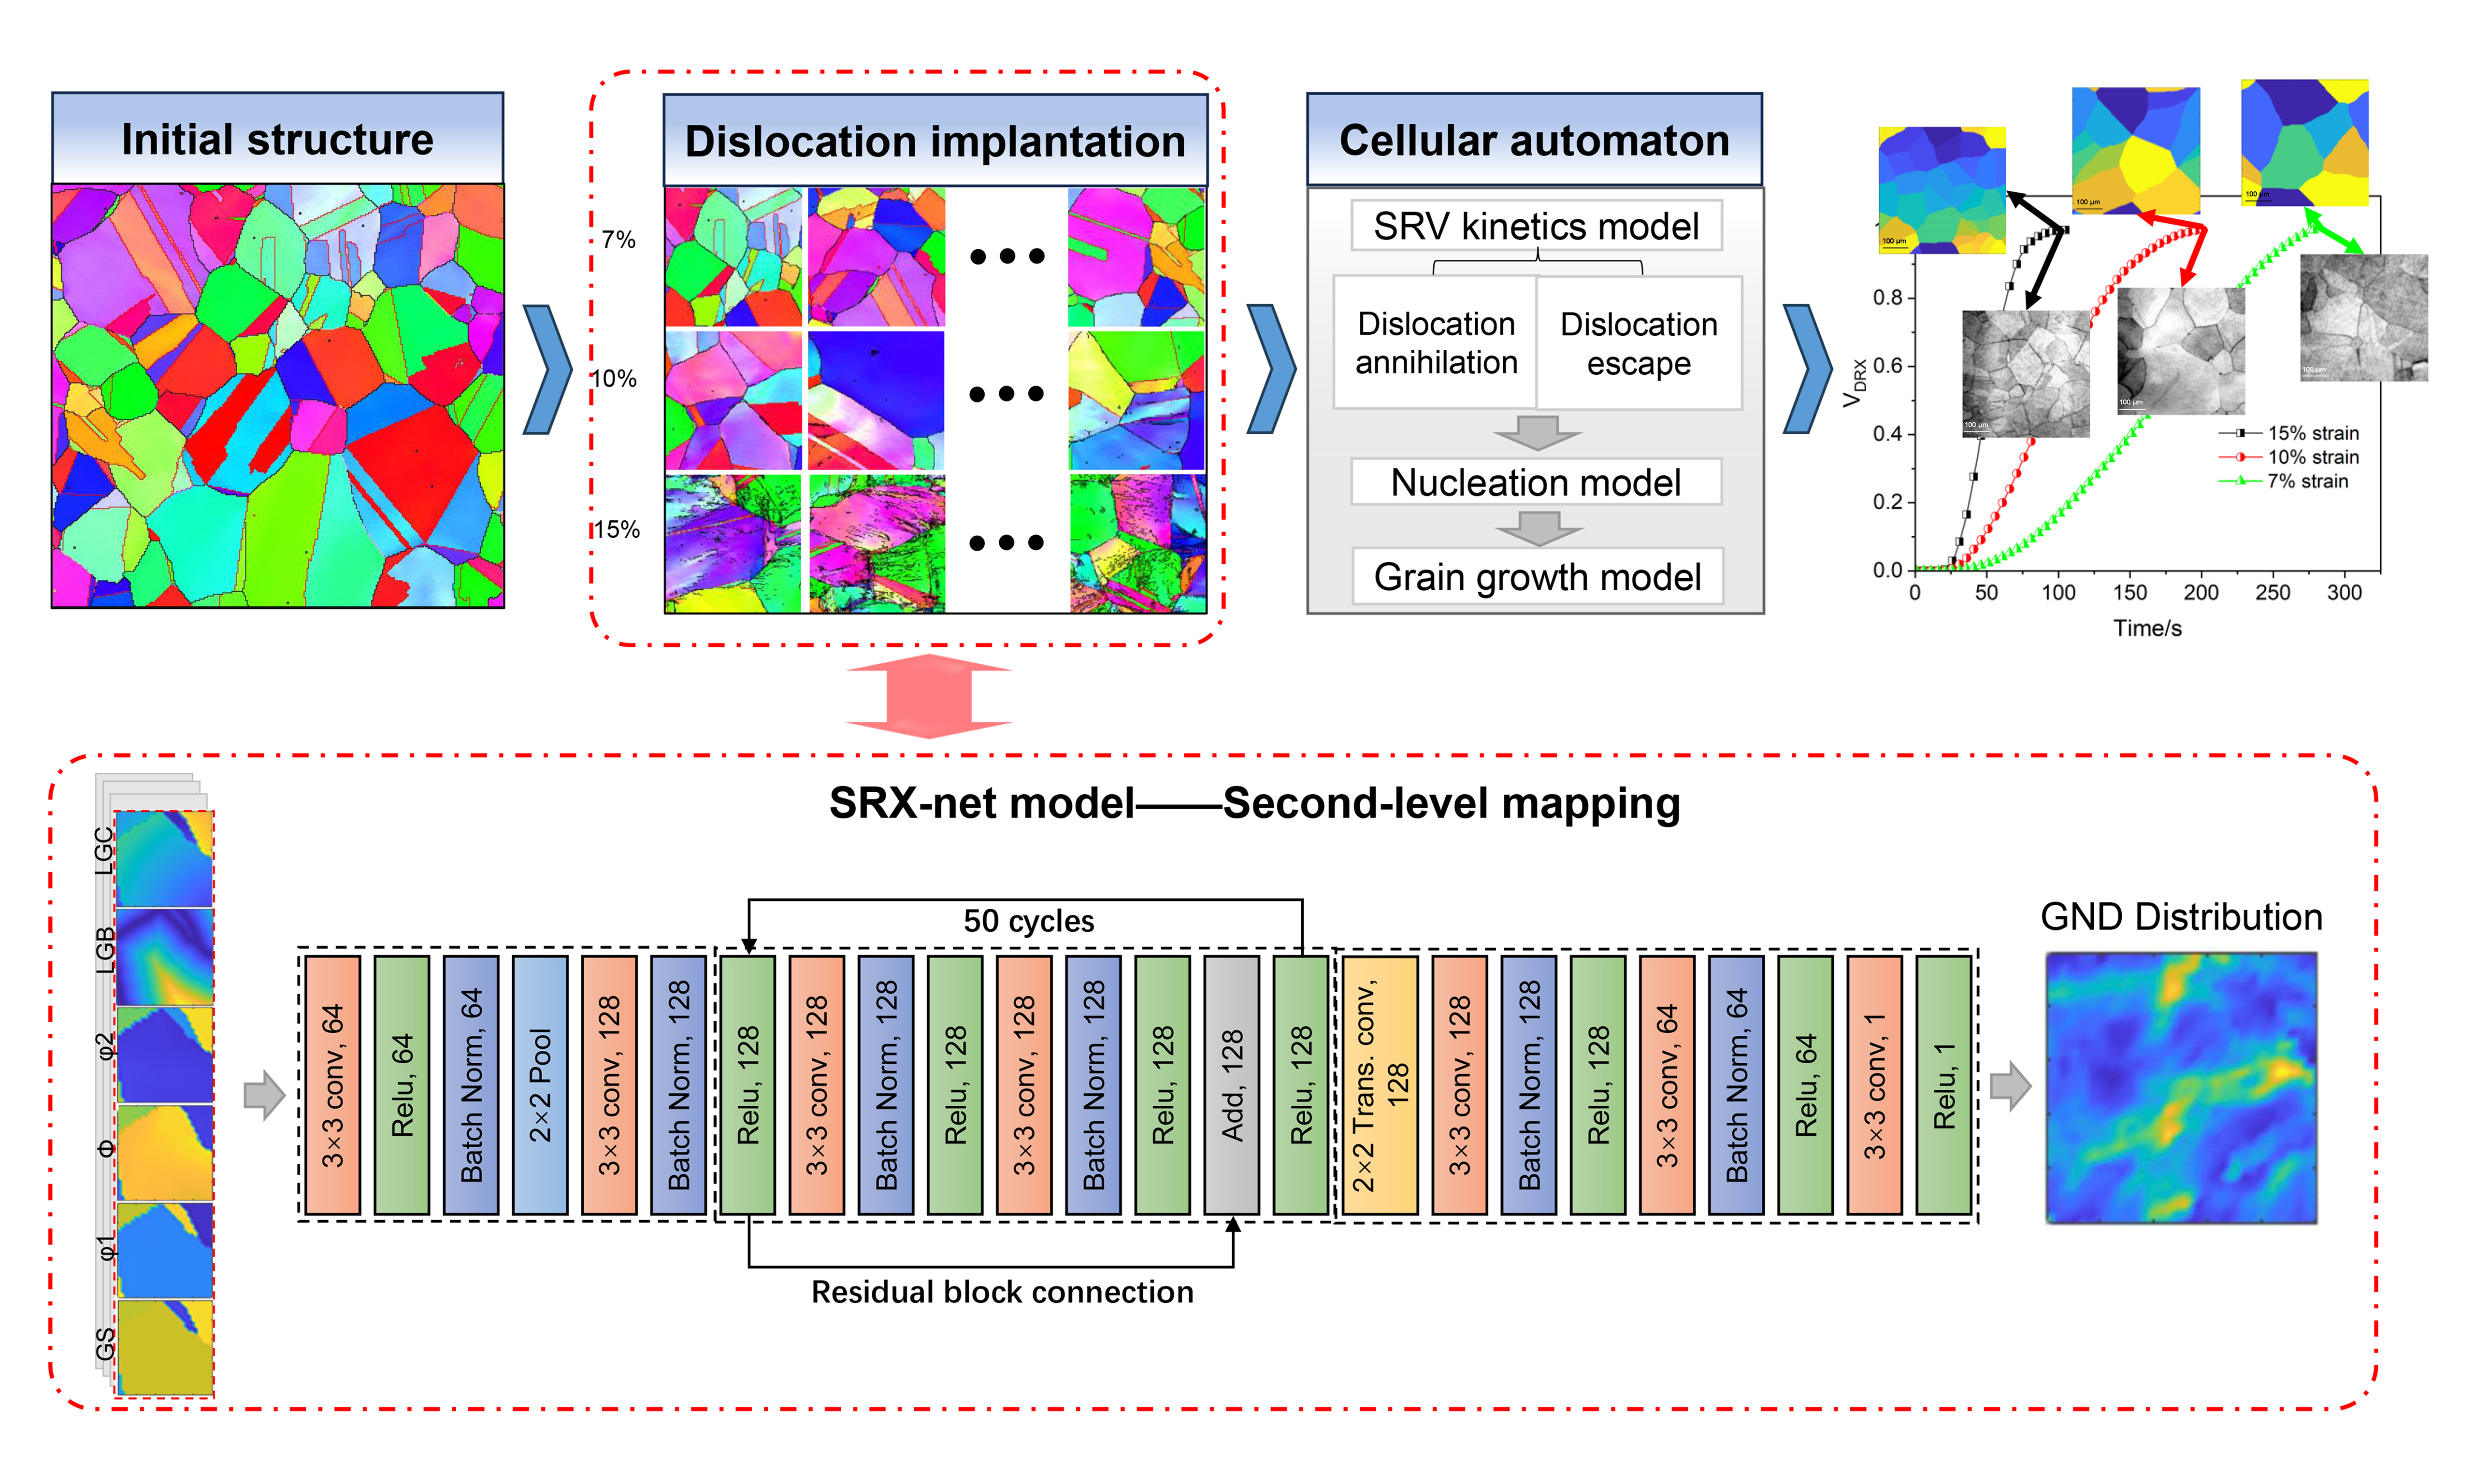
To explore these inquiries, we initially need to assess the effectiveness and consistency of dislocation implantation at the simulation scale. Some previous work[17,18] indicated that the simulation precision of CA model can align with the experimental data captured by electron backscattered diffraction (EBSD), confirming its capability to capture meso-micro characteristics effectively. We therefore intended to integrate EBSD and machine learning to construct a dislocation implantation module that can realize the discrete mapping of dislocation structures. The machine-learning-based CA framework known as SRX (MCA-SRX) developed in this work extends previous models by incorporating specific physical assumptions. It considers the key mechanisms that influence recrystallization, including dislocation migration, recovery, SRX nucleation, and the movement of SRX grain boundaries. To account for the heterogeneity of energy accumulated during the deformation process leading up to SRX, a dislocation implantation module was integrated. Additionally, the MCA-SRX model was validated using a series of experimental data from a typical austenitic alloy (specifically, INCOLOY alloy 925) to effectively demonstrate its predictive capability.
MATERIALS AND METHODS
Dislocation implantation model
Data acquisition and processing
Deformation history and microstructural characteristics play an important role in the kinetics of dislocation migration[19,20]. Even for FCC alloys, which exhibit better deformability, our earlier research[21] found that while dislocations exhibit a long-range, orderly, uniform distribution under different loading strains, 10% strain can facilitate apparent dislocation multiplication by generating various substructure morphologies. The obstruction of dislocation slip on the close-packed planes can form a higher local misorientation. Thus, the post-deformation dislocation microstructure can be related to the microstructure characteristics of the original sample. Previous research[22,23] has demonstrated that the gradient features of dislocation distribution within grains, namely, the magnitude of the increased strain decreases with the rising distance away from the GBs (mantle regions) towards the grain interior regions (core). Meanwhile, there indeed exists an inflection point in the change of strain with respect to the distance from grain boundary[24]. Hence, based on prior physical knowledge, the following characteristics of dislocation distribution should be considered:
• Dislocations show a gradient distribution within grains, which is associated with distance parameters (distance to grain boundaries and distance to grain core).
• The grain orientation (referring to Euler angles), which can change the direction of close-packed planes, influences the tendency of dislocation migration and the formation of substructures.
• The grain size can influence the dislocation distribution by affecting the long-range migration.
Note that the impact of grain boundary types was not considered in this work, which to a certain extent overlooked the strain transmission effect of dislocations in the grain boundary network. Furthermore, according to the abovementioned hypothesis, the characteristics of dislocation for each EBSD pixel can be quantified with six simplified parameters, i.e., length from the grain boundary (LGB) and the grain core (LGC), Euler angles (φ1, Φ, φ2), and grain size (GS). All these parameters can be easily obtained from EBSD analysis with a large-scale scanning to construct an abundant training database.
Apart from the impact of microstructure characteristics, deformation conditions play a key role in dislocation microstructure as well. Considering that the strain rate and deformation temperature are constant during the employed rolling deformation process, the rolling reduction is the principal process factor in this work. Hence, the feature engineering, in the present work, was established based on the combination of rolling reduction and microstructure characteristics, which is regarded as the foundation of the dislocation implantation model. The specific data preprocessing is shown in Figure 1. Firstly, a large number of EBSD tests were performed on the INCOLOY alloy 925 after thermomechanical treatment. More specifically, the deformed samples with different strains (i.e., 5%, 10%, and 20%) were prepared as the training data, in order to better learn the microstructural features under different deformation conditions. To illustrate the generalization ability of the model, samples with strain of 7%, 10% and 15% were used in the subsequent verification of dislocation implantation effect. Experimental details are provided in the Supplementary Materials. Due to limitations in computational capacity, the scanned EBSD datasets were cropped at randomly selected locations into regions of 100 × 100 μm2. The EBSD dataset yielded approximately 6,000 training patches in total, with over 2,000 patches for each of the 5%, 10%, and 20% strain levels, providing a rich and diverse set of microstructural patterns for training. These samples were then used to compute the six microstructural quantitative parameters described above, which served as the input channels.
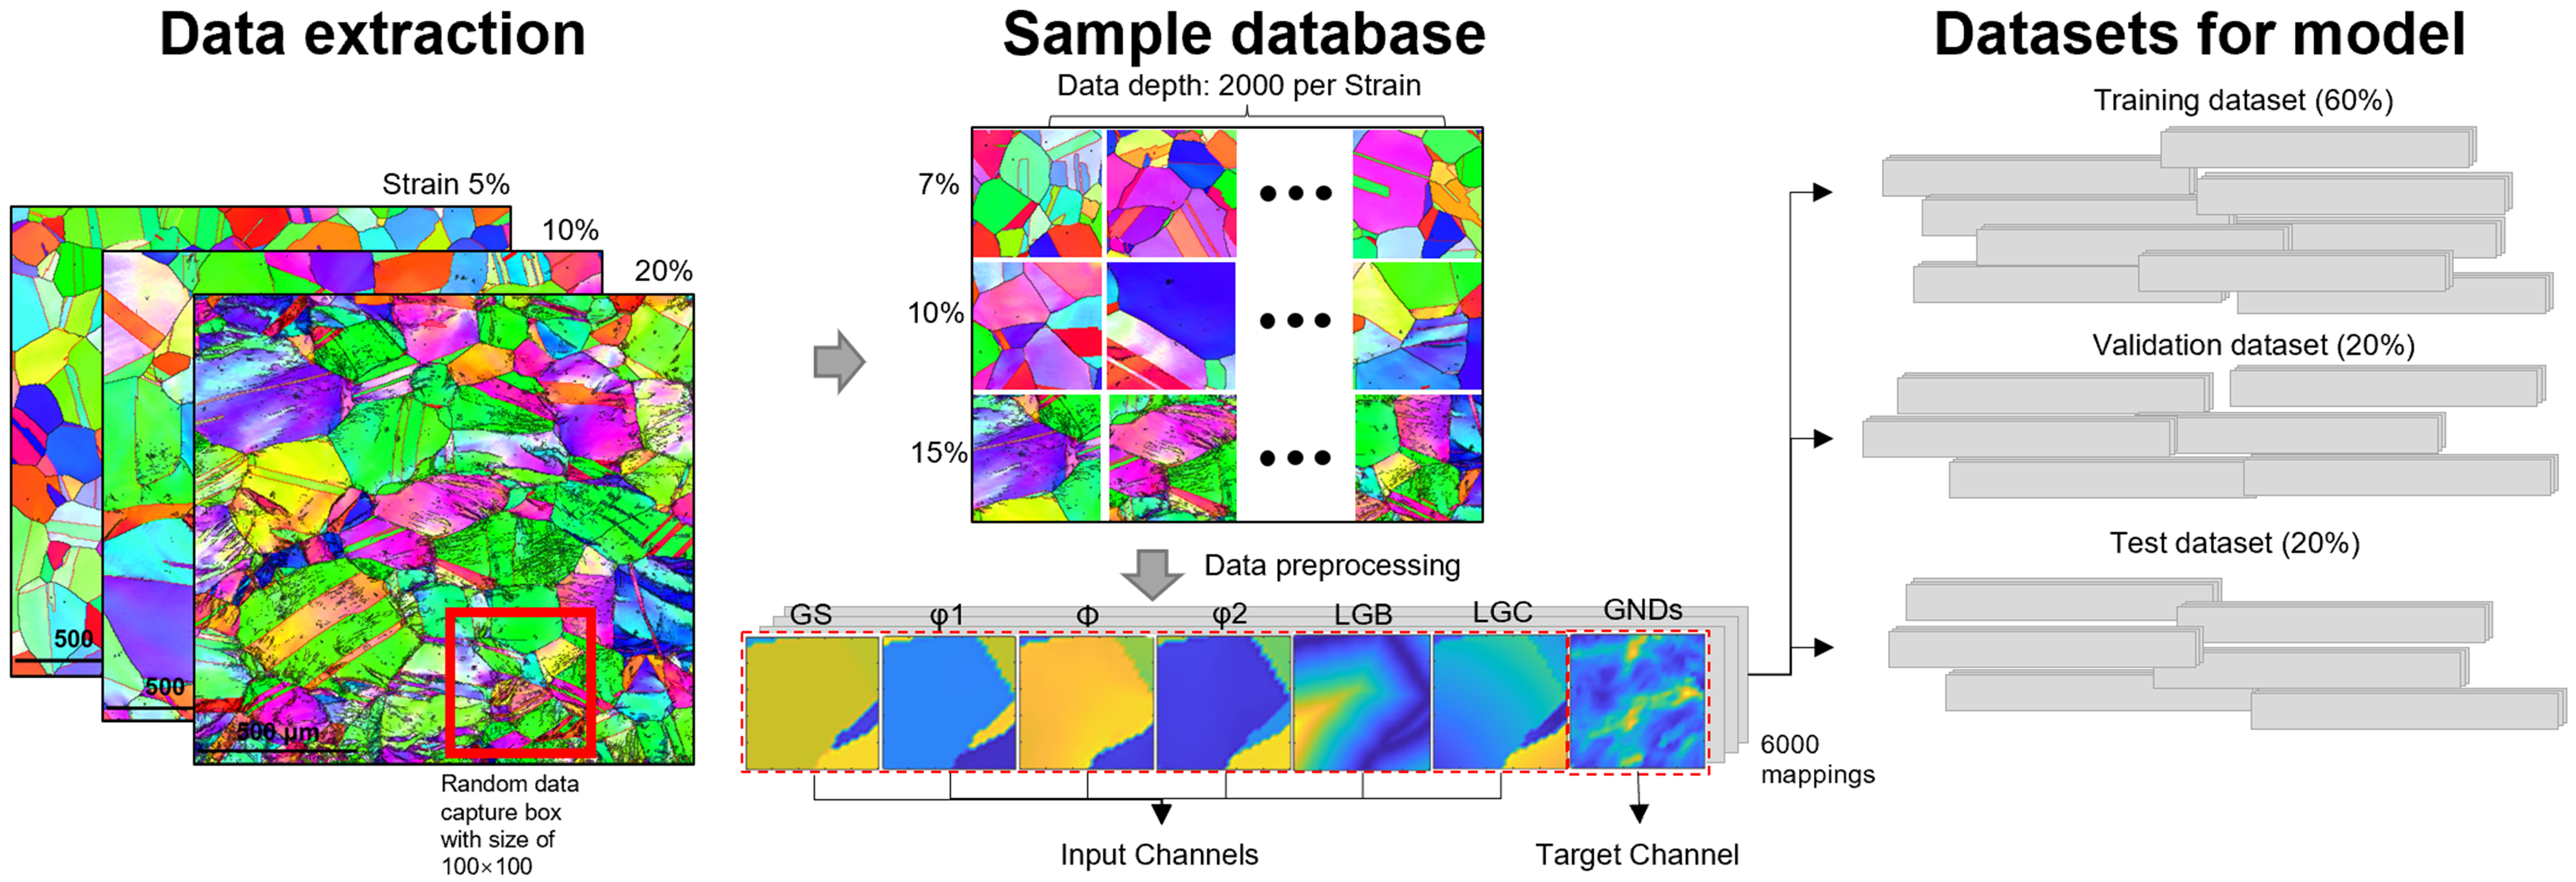
Figure 1. Schematic of data preprocessing. GS: Grain size; LGB: length from the grain boundary; LGC: length from the grain core; GNDs: geometrically necessary dislocations.
Essentially, the dislocation implantation model needs to provide dislocation density at the specific locations according to feature engineering. Since local misorientation is induced by the curvature of the crystal lattice which is related to the formation of geometrically necessary dislocation (GND), it is widely accepted to utilize the kernel average misorientation (KAM) value for GND analysis. Thus, a simplified method was used to calculate the GND density (ρGND) based on the strain gradient theory[25]:
where b and μ are the Burgers vector (i.e., 0.25873 nm) and the step size, respectively. θ0 is the local misorientation that can be determined as follows[25]:
where θi is the misorientation between the corresponding point and the adjacent points.
Prior to the network training, data cleaning and normalization preprocessing are necessary to ensure data accuracy and convergence. The normalization process in this work was carried out as follows:
where x and x* are the data before and after normalization. xmax and xmin represent the maximum and minimum values of the corresponding dataset, respectively. It is noteworthy that due to the distinct range features of certain experimental parameters, some peculiar normalization processing should be conducted; for example, grain orientations (φ1, Φ, φ2) correspond to the xmax values of 360, 180, and 360, respectively. After preprocessing, the data were partitioned into training, validation, and test datasets, comprising 60%, 20%, and 20% of the total samples.
Deep-learning algorithm
Considering the significant role of dislocation structure in CA simulation, the effectiveness of RF, U-net, and deep residual network (ResNet) methods in constructing pattern recognition was compared to better achieve the quantitative implementation of dislocation density. Although these network frameworks have slight differences, they essentially build the mapping relationship between feature factors and dislocation density. The classical RF model, optimized via a comprehensive search over the parameter space, was employed in this work. The optimal parameter was configured with 200 trees, using the mean squared error as the function to measure the quality of a split. A suboptimal number of features was considered at each split, and the model operated without bootstrapping. Moreover, no constraints were imposed on the maximum depth of the trees, ensuring the model’s ability to learn intricate structures within the data.
To better capture and integrate the spatial distribution characterization of different factors, a deep learning structure was further employed based on the computer vision, and the specific network architecture is depicted in Figure 2. Herein, the downsampling and upsampling structure of U-net can capture the multiscale spatial features, while ResNet can capture deep spatial features through residual blocks and deep network design, enhancing the model’s expressive ability. Notably, we introduced SRX-net, a modified ResNet architecture designed to meet the specific computational and representational requirements. Unlike the traditional Res-net structures, this variant can be distinguished by its unique combination of encoding and decoding sections, working in tandem with central residual blocks. Furthermore, the encoding sections in our network utilize convolutional layers with batch normalization and rectified linear unit (ReLU) activation to extract hierarchical features from the input, followed by max pooling for spatial downsampling. The core of the network is a deep central block designed to enhance feature representation through residual learning. This block consists of a sequence of 50 computational cycles. Each cycle contains a 3 × 3 convolutional layer with 128 filters, a batch normalization layer, and a ReLU activation function. A single, long-range residual connection is implemented across this entire central block, in which the output of the encoding section is added element-wise to the output of the 50th cycle. This identity shortcut facilitates gradient flow through the deep architecture, mitigating the vanishing gradient problem and allowing the network to learn more complex features. The subsequent decoding sections are structured to upscale feature maps and reconstruct the output through a combination of transposed convolutional layers and standard convolutional layers. The network concludes with a regression layer, serving as the output layer. The loss between ground truth and predicted value is calculated by the root mean square error (RMSE), which is expressed as:
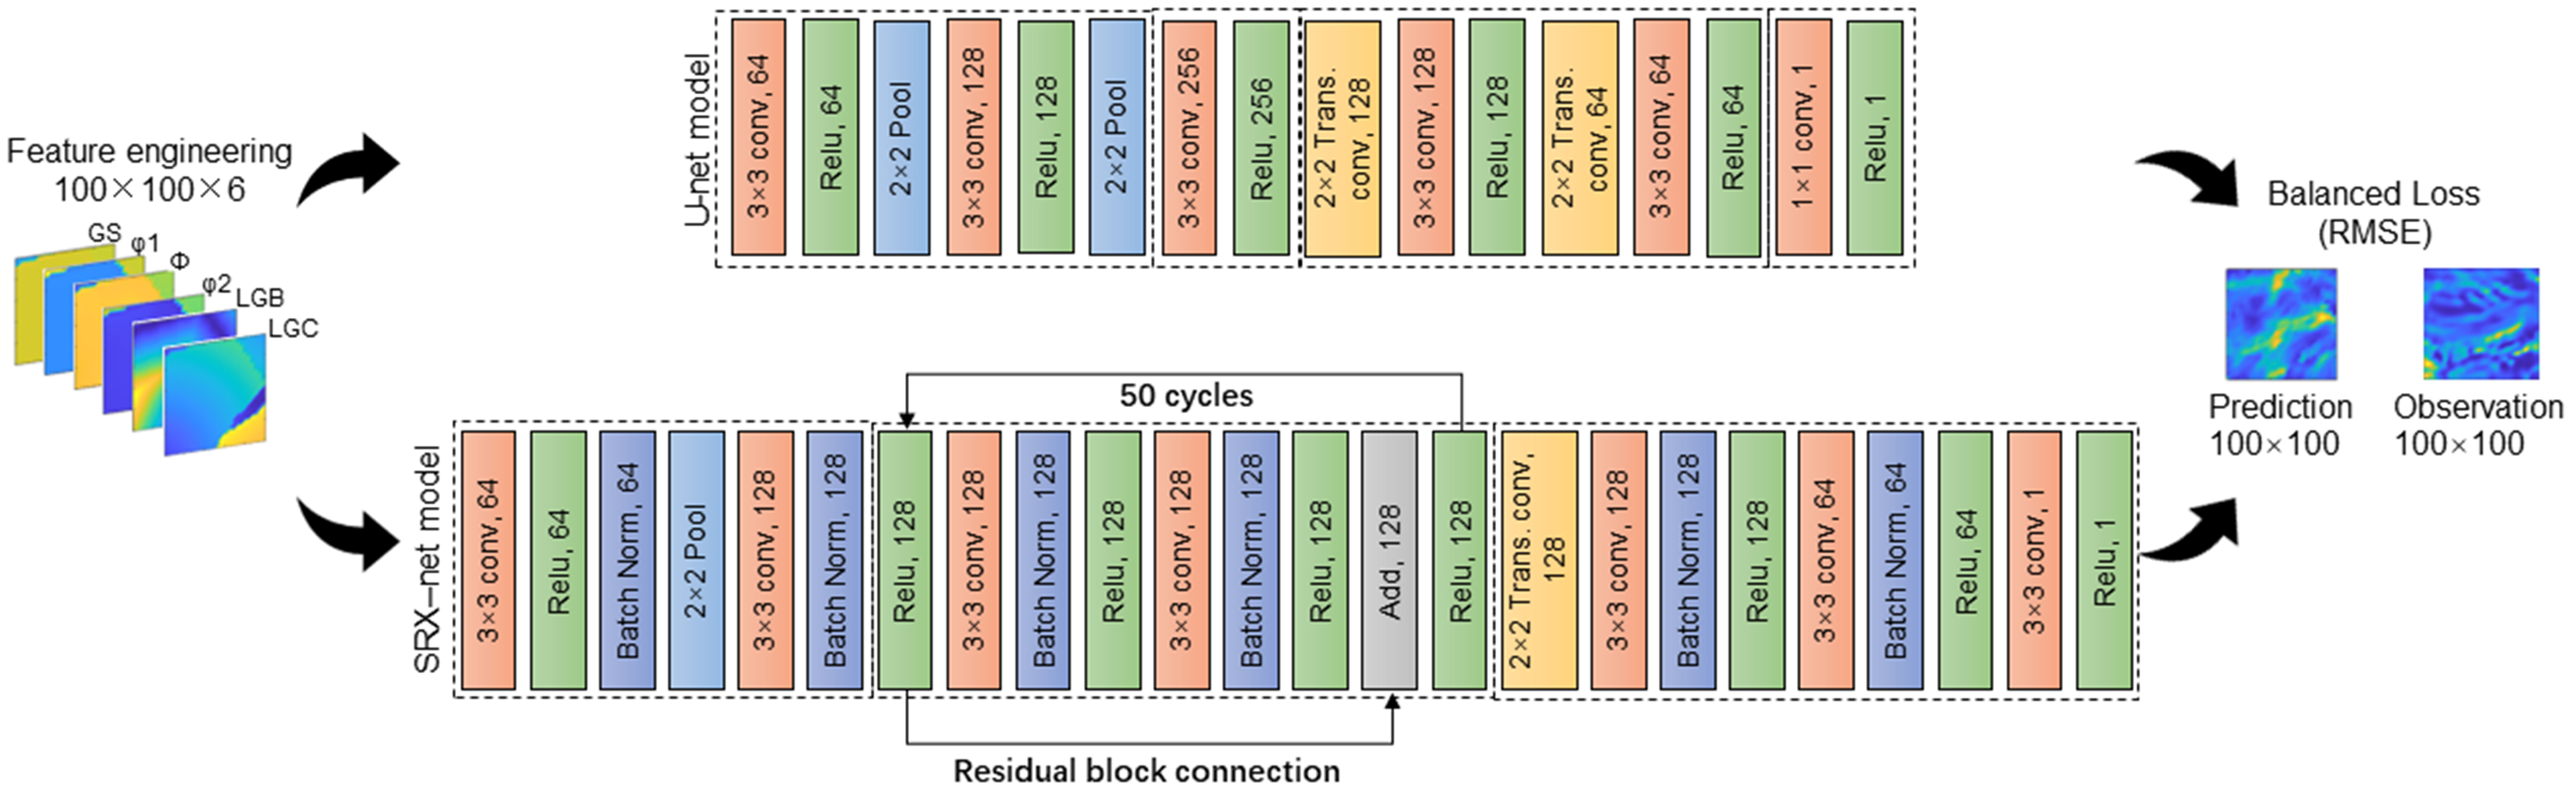
Figure 2. Architecture of the deep learning U-net and SRX-net models. SRX: Static recrystallization; GS: Grain size; LGB: length from the grain boundary; LGC: length from the grain core; RMSE: root mean square error.
Here, Oi and Mi denote the experimentally observed and model-predicted values at cell i, respectively, and n is the total number of cells. RMSE can accurately reflect the magnitude of deviation because it accounts for the discrepancy between each cellular grid point and its corresponding EBSD pixel. A smaller RMSE indicates that the experimentally measured and predicted GND densities differ only minimally, demonstrating the high fidelity of the dislocation implantation model. Compared with the mean squared error, RMSE retains the same units as the original data, making it more interpretable. Likewise, it is particularly sensitive to large errors and may be affected by outliers.
For model training, the Adam optimizer was employed due to its effectiveness in handling adaptive learning rates. Adam adjusts the learning rate for each parameter individually, combining the advantages of both root mean square propagation and adaptive gradient algorithm. The model was set to train for a total of 1,000 epochs using a mini-batch size of 64, with the initial learning rate set as 0.001. Importantly, a piecewise learning rate schedule was adopted wherein the learning rate is reduced by 50% every 100 epochs. This approach aims to ensure gradual refinement in model parameters while mitigating potential convergence issues. In this study, all calculations were performed using MATLAB with the MTEX toolkit. For computational efficiency, we also executed the training on a graphics processing unit (GPU) environment. All experiments were carried out on a workstation equipped with an NVIDIA GeForce RTX 4090 GPU with 24 GB (gigabytes) of GDDR6X memory.
Establishment of CA model
Parent grain formation
Initial microstructural characteristics are essential for the high-precision prediction of microstructure evolution. To accurately simulate the evolution of SRX, the nucleation density in the cellular space was estimated based on the initial grain size that was obtained by EBSD. It is envisaged that a certain number of nuclei, which can grow unconstrainedly within the matrix according to the Alternant Moore-type neighbor relationship[26], are randomly dispersed in the cellular space. Assuming that the parent grains can be geometrically approximated as circles, we can derive the Equation (5) based on the conservation of area within the cellular space[26]:
where Y is the total cell number, d0 is the average grain size for the initial sample, and a is the cell size that is assumed to be 1 μm. N is the nuclei number in the cell space, which can be determined by the experimentally measured average diameter of the initial grains. Due to constraints on computational resources, the simulation domain was restricted to a 2D area of 100 × 100 μm2 in this study.
SRV kinetics model
The SRV phenomenon generally occurs during the annealing process of deformed metallic materials with higher stacking fault energy. The specific annealing temperature can provide the needed activation energy for the movement and realignment of dislocations, forming some lower energy configurations. To distinguish the simultaneous contributions from SRV and SRX, the relaxation of internal stress and dislocation annihilation caused by thermally activated mechanism was defined as the primary softening mechanism at this stage. The kinetics of SRV in the post-deformation annealing process can be estimated through the analytical method proposed by Goetz[27]:
where ρ0 and t represent the initial dislocation density and annealing time, respectively. And k is the SRV influence coefficient, which can be calculated by Equation (7) as follow[27]:
where k0, mk, and Qk are constants [Table 1]. R is the gas constant. T is the thermodynamic temperature. Equation (7) is currently widely used to compute dislocation evolution during the annealing process. However, due to the polygonization phenomena[28], the movable substructure can continually absorb dislocations, increasing its orientation difference. In this case, although a general decrease in stored energy occurs owing to the removal and rearrangement of microstructure defects, the dislocation density can still locally increase. Hence, to accurately predict the softening kinetics of the annealing process, the potential contribution of dislocation annihilation and dislocation migration in the course of recovery should be determined. A relevant work[14] has indicated that the accuracy of CA model is insufficient to precisely simulate the migration and interaction of mobile dislocations. Thus, our work proposed the dislocation probability escape assumption to simplify the dislocation migration behavior, and further aimed to describe the evolution of dislocation density during the annealing process.
| Parameter | Value |
| λ | 0.5 |
| b (m) | 2.538 × 10⁻¹⁰ |
| vD (Hz) | 2 × 10-12 |
| Qr (KJ/mol) | 345 |
| ω | 36 b3 |
| k 0 (s-1) | 1.05 × 10⁹ |
| mk | -0.856 |
| Qk (J·K-1·mol-1) | 181,500 |
In this CA model, the dislocation escape probability assumption can overcome the spatial resolution limitations to some extent, capturing mesoscopic dislocation dynamic evolution. Each CA cell, sized to be
where
where b, vD, R, Qr,T, ω and kB are the Burgers vector, Debye frequency, universal gas constant, recovery activation energy, temperature, recovery activation volume and Boltzmann constant, respectively.
The model parameters mentioned above in this section are listed in Table 1, based on some available literature[30,31]. Therefore, the escape ratio in the CA model rarely gets updated with the increasing time steps. Generally speaking, the dislocation escape hypothesis approximates mesoscopic dislocation migration within the CA paradigm, which can provide some nuanced insight into the dislocation behavior.
Nucleation model
Nucleation during recrystallization is a highly heterogeneous phenomenon. Deformed structures with higher local deformation stored energy can become preferred locations for recrystallization[32]. In this work, nucleation is considered as a thermally activated process associated with the distribution of stored energy. The SRX nucleation kinetics essentially depend on the annealing temperature and the energy consumption triggered by nucleation. Therefore, the nucleation rate (
where c0 is a constant. k is a dimensionless fitting coefficient, taken as 0.5 in this work. QN is the activation energy for SRX, taken as 414 J/mol in this work[34]. Moreover, ΔEij represents the magnitude of energy change during the nucleation process, which can be computed using[30]:
where λ is constant. G is the shear modulus of the material. Vn and AGB represent the volume of the nucleus and the area of the grain boundary, respectively. The first term (
Grain growth
The essence of grain growth mainly involves the migration of grain boundaries within the crystal structure. Similar to nucleation, the driving force for grain boundary movement is largely related to the reduction in the free energy within the matrix. Additionally, it can also be provided by the interfacial energy through the curvature of grain boundary[36]. Generally, the migration rate (v) of grain boundaries can be used to characterize their movement, which can be further simplified as their migration speed under the action of a unit driving force. Therefore, based on the Turnbull rate equation, the relationship between the grain migration rate and the driving force acting on a unit area of grain boundary can be derived as follows[36]:
where m is the grain boundary mobility, which can be estimated from[36]:
where D0 is the diffusion coefficient of grain boundary, taken as 1.1 × 10⁻⁶ m2/s, and Qb is the activation energy of mobile grain boundary, taken as 140 kJ/mol. In addition, the following relationship can be utilized to calculate the local driving pressure (P) existing on a moving grain boundary[37]:
where λGb2Δρd corresponds to the energy difference on both sides of the interface. In this CA model, Δρd can be defined as the change in dislocation density on both sides of the moving grain boundary. kγGB is provided by the grain boundary curvature. γGB is the energy of high-angle grain boundary with a typical value of
where a is the cell size of CA lattice. A is a coefficient, taken as 1.28. N0 is the number of the first and second nearest neighbors, taken as 24. Ni is the number of cells within the neighborhood which the state is the same as that of the cell i, and Kink is the number of cells within the neighborhood with the same state as cell i for a flat interface. Thus, the difference between Kink and Ni represents the curvature of grain boundary to some degree. More details about this equivalent model for curvature calculation can be found in Ref.[38].
During the actual annealing process, once a cell begins to nucleate, it will grow at a rate of v toward its neighbors, transforming neighboring cells from the uncrystallized state to the crystallized state. Meanwhile, the actual annealing time is discretized into multiple time steps, and the growth distance l of the nucleated cells towards neighboring uncrystallized cells with the time step dt can be calculated using
If l ≥ a, it can be pointed out that the neighbor has changed from an unrecrystallized unit cell to a static recrystallized unit cell.
RESULTS AND DISCUSSION
Figure 3 illustrates the comparison between the experimental value and predicted value of GND frequency distribution with different strains. It can be conjectured that the curves with different strains are roughly similar, but as the deformation increases, all of the curves shift positively along the density axis to larger values. As expected, the stored energy in the deformed sample rises with the increasing rolling reduction. Interestingly, some notable differences can be found in the prediction results from various models, indicating the RF model has a superior ability to replicate the high-frequency distribution regions of dislocation density in the matrix, associated with ρGND values of 3 × 10¹⁵, 7.5 × 10¹⁵, and 1.5 × 10¹⁶ m-2 at the rolling reduction of 7%, 10%, and 15%, respectively. When subjected to larger strain, the peak predicted by the RF model can mildly surpass the experimental distribution, as shown in Figure 3C. The increased complexity of dislocation behavior with higher strains is prone to affect the model’s prediction variance. Moreover, the model displays a weaker response to localized stress concentration (maximal value of ρGND), with the relative dislocation density fraction nearly at zero. In contrast, the U-net model, which can adeptly predict the overarching distribution trend of dislocation density in the samples subjected to 5% strain, exhibits a higher sensitivity to localized stress concentration. However, the model lags in precision for the high-frequency zones with insufficient dislocation densities, indicating a more substantial deviation from the actual distribution, as shown by the blue line in Figure 3. Compared to the classic U-net model, the improved SRX-net can accurately reconstruct the dislocation density. Additionally, under all of the different strain conditions, the predicted distribution of dislocation density remains highly correlated with actual outcomes.
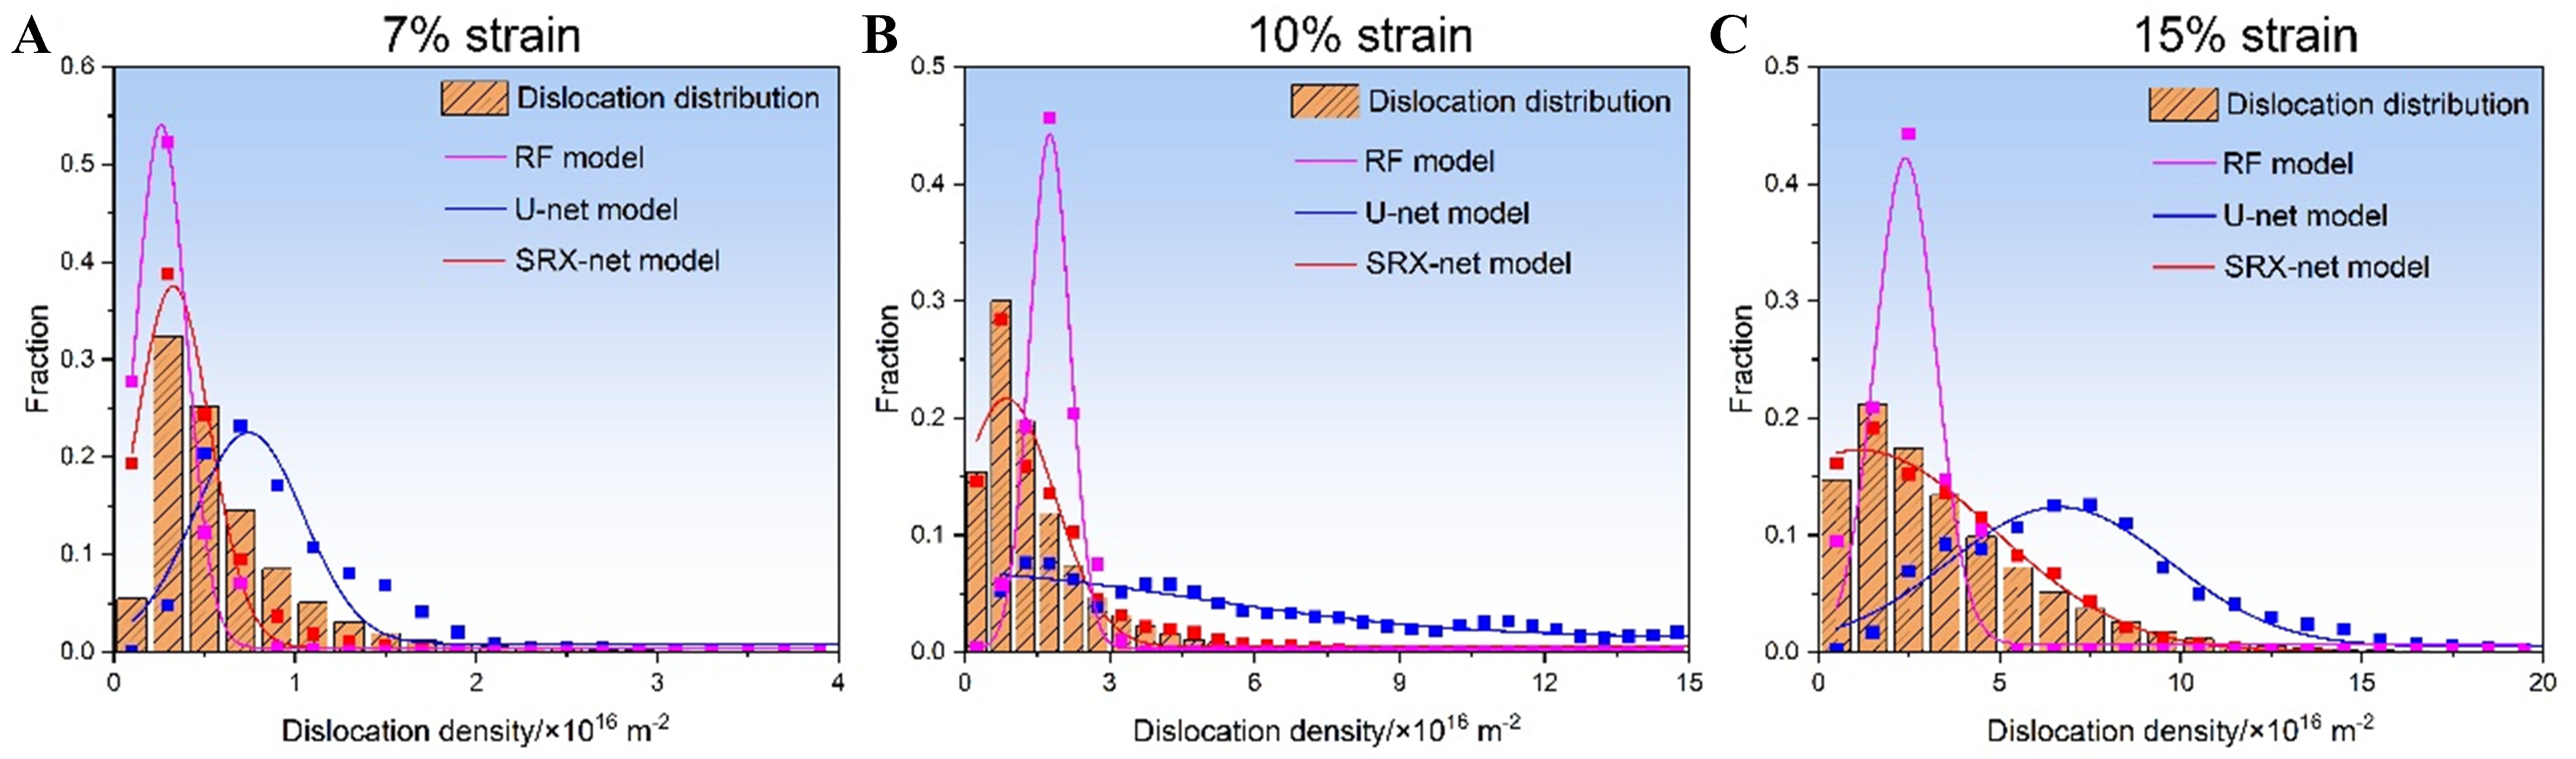
Figure 3. Experimentally determined and model-predicted GND frequency distributions under different strain conditions: (A) 7%; (B) 10%; (C) 15%. GND: Geometrically necessary dislocation; RF: random forest; SRX: static recrystallization.
As depicted in Figure 4, to clearly demonstrate the performance of different models in dislocation density reconstruction, the EBSD results with different strains were tailored using MTEX to fit the neural network’s input structure and compared the predictions from different models. An intragranular local structure was selected from the 7% strain sample. It can be observed in Figure 4B that the RF model shows a lower order of GND density magnitude than that of the experimental result, signifying that the RF model is unable to capture the localized strain concentration. Moreover, there appears to be a noticeable over-segmentation in some specific regions, leading to pronounced contrast and gradient differences. On the whole, the RF model, due to its decision-tree-based nature, should be more sensitive to the localized features, leading to the occurrence of capturing noise or overfitting certain features. Comparatively speaking, the U-net model can provide a relatively smoother GND distribution. Even though it can adeptly forecast the intragranular strain concentration and positioning, the overarching distribution appears subdued, implying that the model might be dispersing the GND density over a broader region. Notably, Figure 4D is clear evidence that the SRX-net model can more accurately reflect the experimental findings, preserving nuanced features and changes in intensity, which can be negligible from a broader perspective.
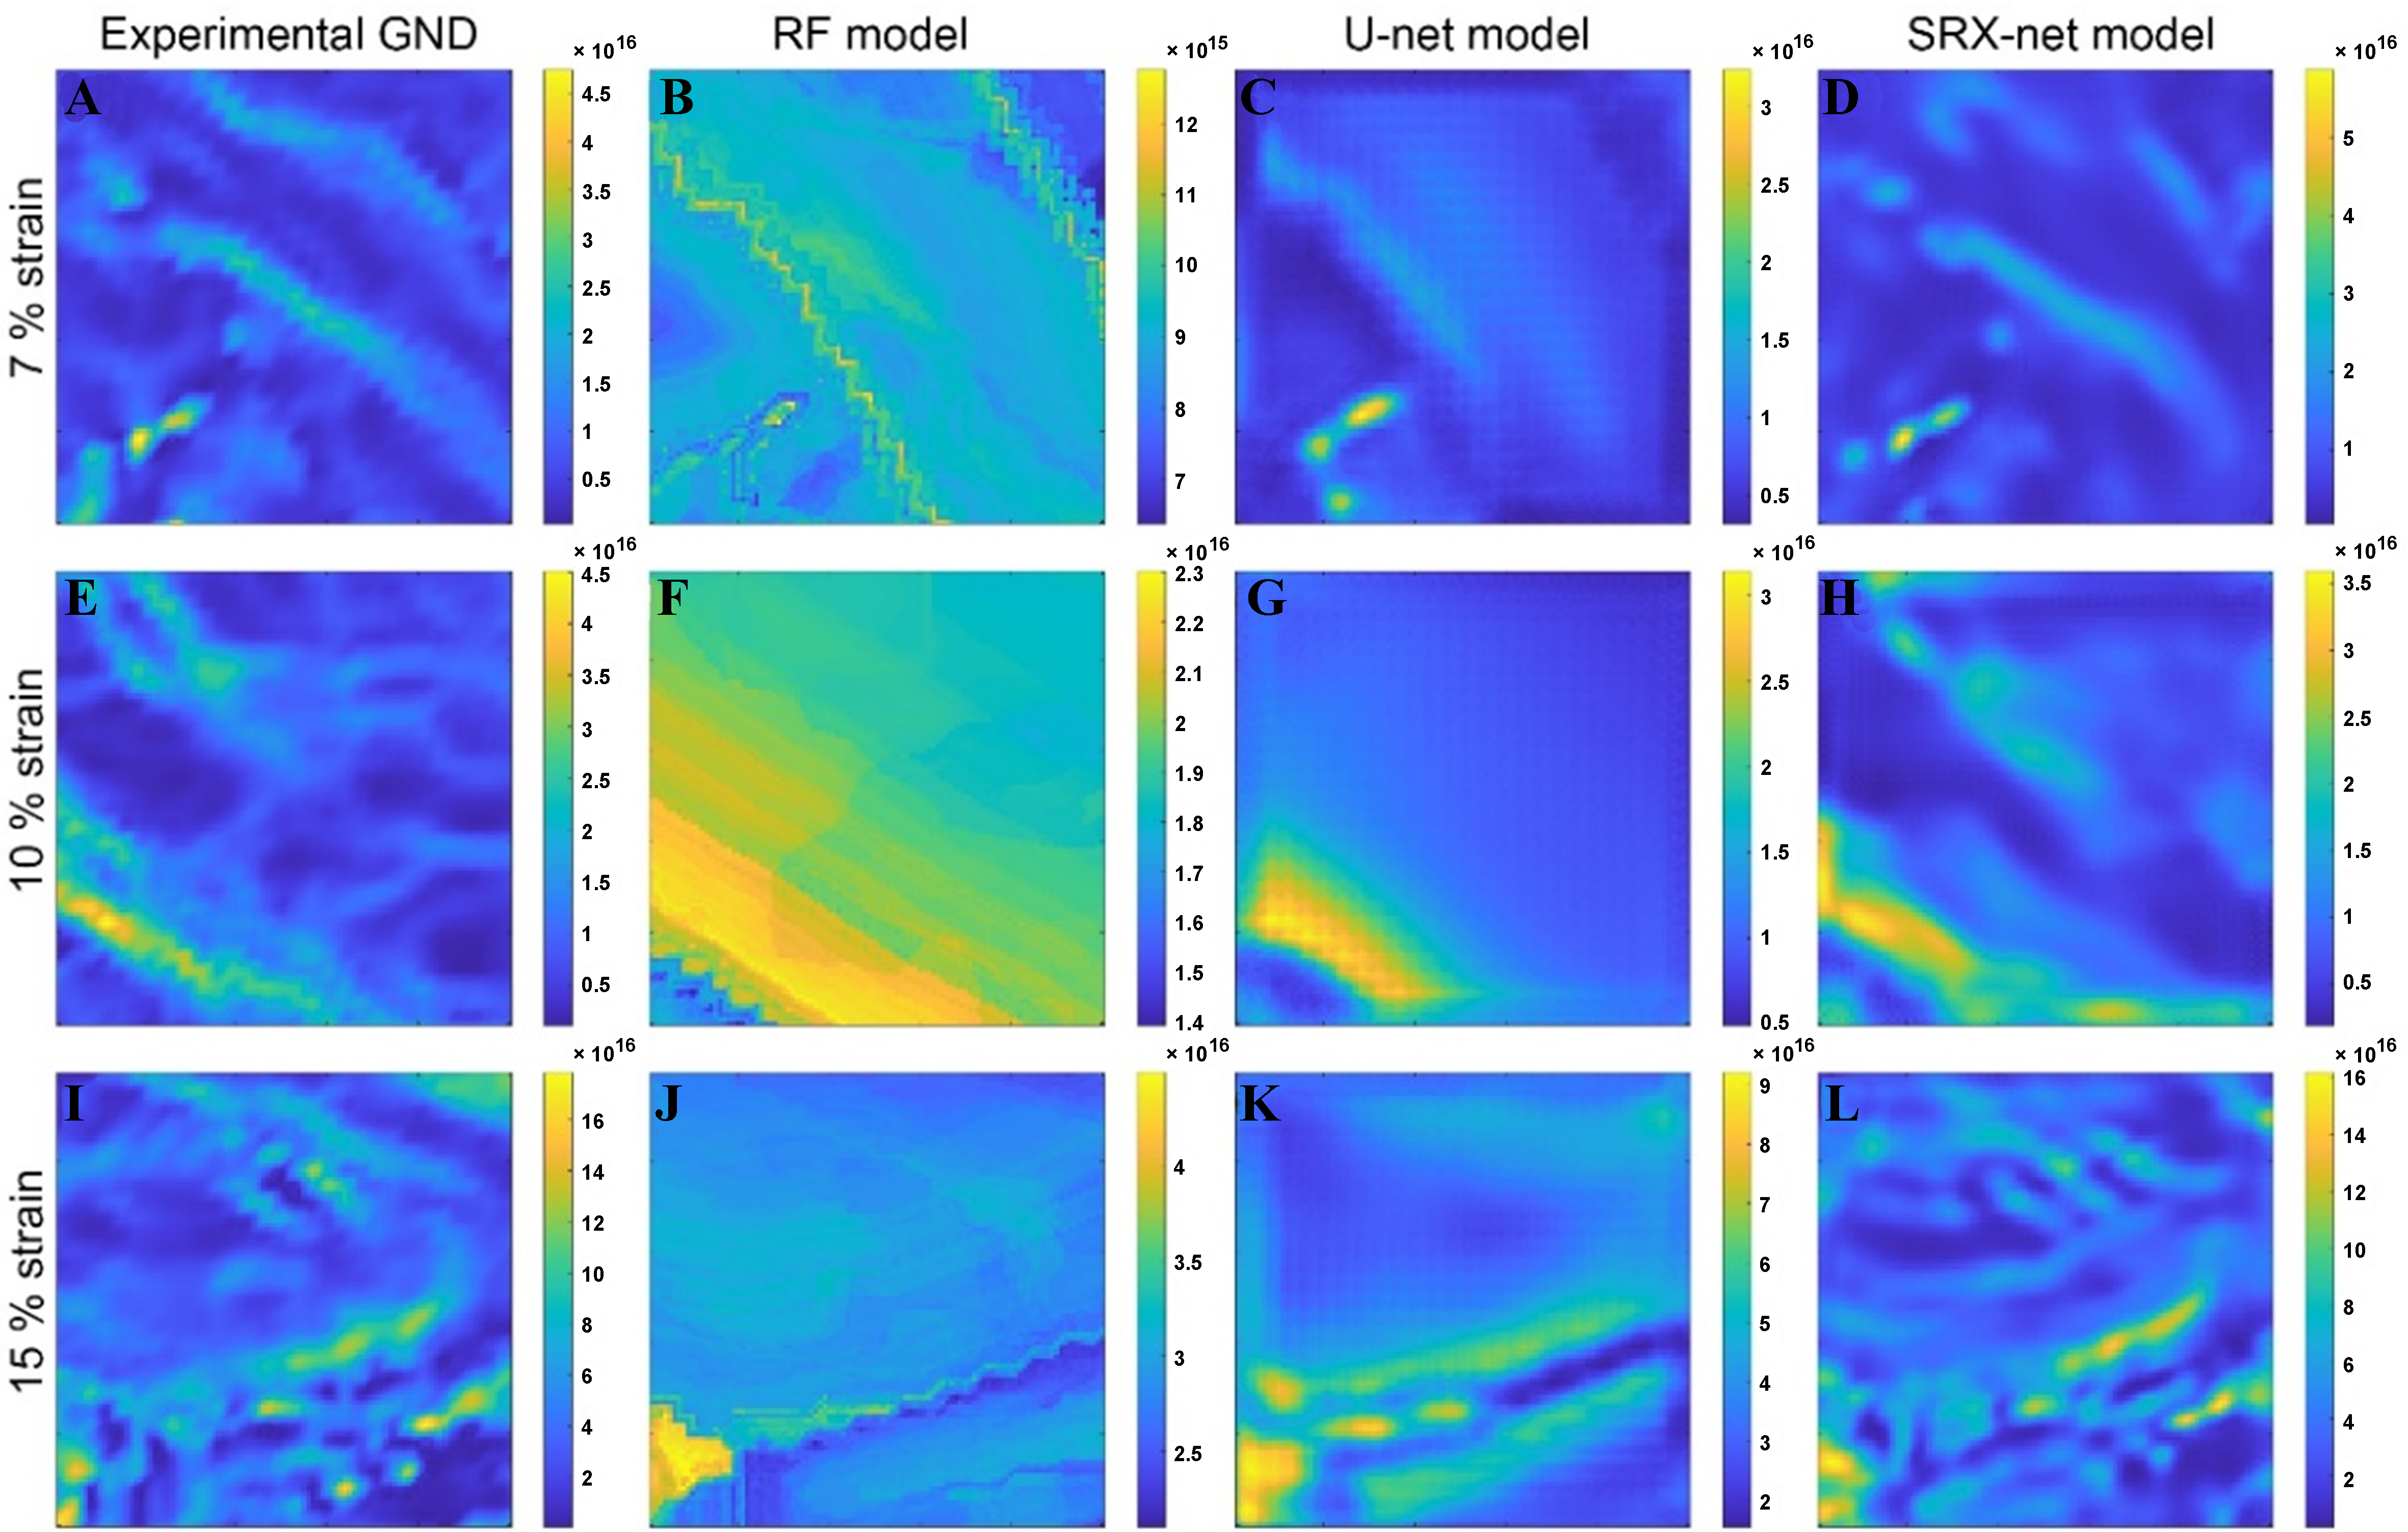
Figure 4. GND distributions under 7%, 10%, 15% strain (A, E, I) and the predicted distribution for different models: (B, F, J) RF model; (C, G, K) U-net model; (D, H, L) SRX-net. GND: Geometrically necessary dislocation; RF: random forest; SRX: static recrystallization.
For the samples subjected to higher strains (10% and 15%) as shown in Figure 4E-L, we trimmed a region inclusive of grain boundaries. It can be inferred that the RF model reveals a more distinct GND gradient proximal to the grain boundaries, suggesting that the feature parameters, including the LGB and core of the grain, might have higher parameter weights. This is also the main reason for the more concentrated distribution of dislocation density in the dislocation reconstruction. As shown in Figure 4G and K, the U-net is more adept at accurately seizing the strain concentration in the vicinity of grain boundaries. However, its rudimentary network design neglects the intricate local dislocation tangles and intragranular substructures. In contrast, the SRX-net model presents an exceptional predictive ability, not only efficiently grasping macroscopic and microscopic tendencies but also elucidating abundant substructures, as illustrated in Figure 4H and L. Thus, the SRX-net model consistently outperforms the other two models regardless of strain levels, prompting a detailed and accurate prediction of GND densities. Its deeper architecture, coupled with residual connection, likely aids in discerning the intricate microstructure and density, yielding a prediction that closely aligns with the experimental observation.
In the scatter plots presented in Figure 5, the reconstruction efficacy of three distinct computational models (i.e., RF, U-net, and SRX-net) is critically analyzed against the benchmarked experimental GND density. It can be found from Figure 5A that the RF model delineates a discernible disparity between the predicted and experimental GND densities, especially at 15% strain, as indicated by its lower correlation coefficient (R2) value. Although the model shows a better consistency at 10% strain, the prediction results are not concentrated around the ideal y = x line while displaying a clear horizontal distribution, which clearly implies that the dislocation density distribution reconstructed by RF model is predominantly concentrated in some local area, consistent with the abovementioned conclusion. By contrast, the scatter plot of the U-net model also manifests a pronounced deviation, particularly with larger strains. It is important to mention here that the U-net model can exhibit a nuanced capability in reconstructing lower GND densities. However, the challenge of accurately predicting higher GND densities can still be observed, as denoted by the spread of data points in Figure 5B.
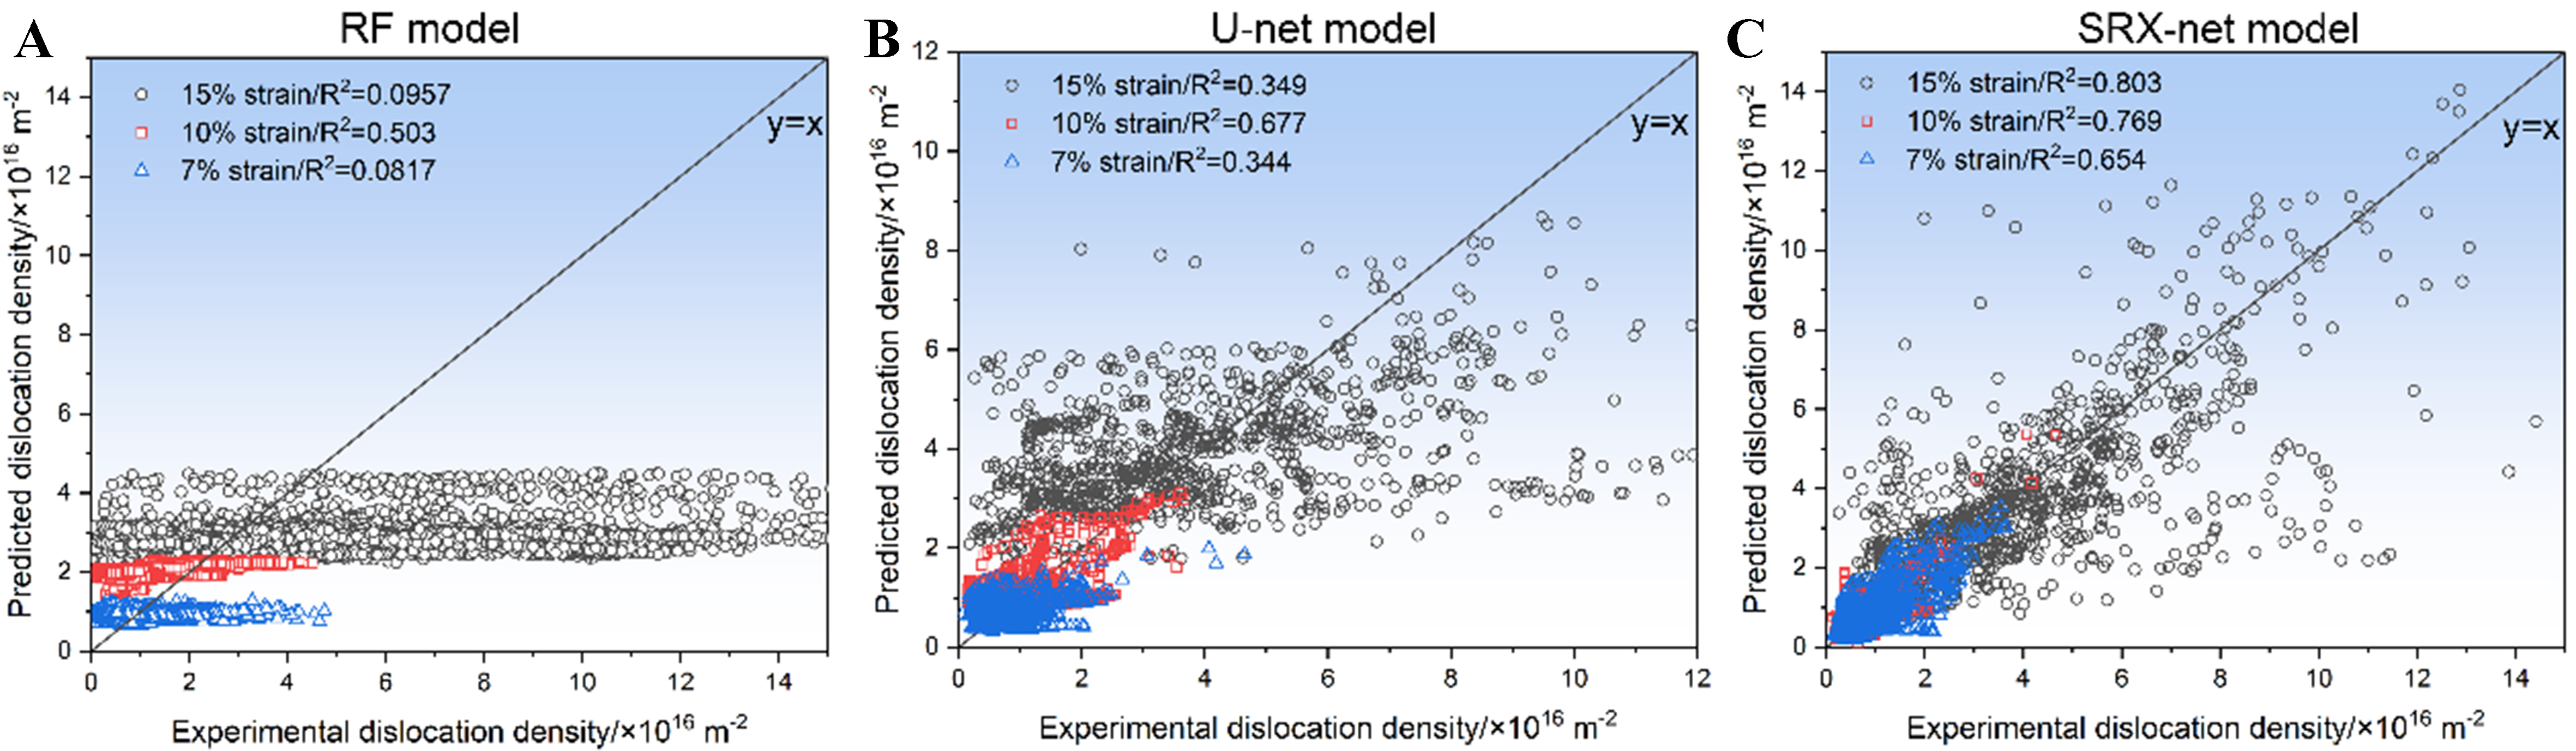
Figure 5. Correlation between the experimental and predicted dislocation densities from: (A) RF model, (B) U-net model, and (C) SRX-net. RF: Random forest; SRX: static recrystallization.
The SRX-net model, by contrast, demonstrates a superior precision in GND density reconstruction at all strain levels, which can be distinctly verified by its higher R2 values [Figure 5C]. Meanwhile, the clustering of data points is proximate to the y = x line, indicative of its superior predictive ability. Conclusively, the SRX-net model emerges as the most adept in terms of GND reconstruction, which can be largely attributed to the inherent benefits of deeper network architectures and the nuances of residual learning.
Figure 6 shows the evolution of average dislocation density during the annealing process at different temperatures. Thus, it can be clearly observed that the process of dislocation density evolution can be categorized into three stages. At the onset of annealing (Stage I), with the dislocation density surpassing the nucleation critical value, numerous SRX nuclei can be generated around the grain boundaries within the deformation matrix, simultaneously consuming a large number of dislocations at high speed. The simulated results indicate that a significant drop in dislocation density typically occurs within 2-4 s. It is worth noting that there existed a certain discrepancy from the real-time results since the heating process of this experiment was not considered during the simulation. Additionally, we can also observe that higher annealing temperatures can further promote the consumption of dislocations at this stage. It can be deduced that the annealing temperature might induce a decrease in dislocation density by impacting the nucleation density and the localized migration of high-angle grain boundaries. With the prolongation of annealing time, the alteration in dislocation density will progressively diminish. However, higher temperatures can accelerate grain boundary migration in the recrystallized grains, leading to a faster decline in dislocation density. Interestingly, although the overall trend of dislocation density during the annealing process is continuously downward, some local fluctuations are still evident, which primarily arises from the assumption of dislocation escape, facilitating the migration and localized accumulation of mobile dislocations. This type of localized stress concentration rarely satisfies the nucleation prerequisites, in accord with the previous work[39]. As expected, greater strains require longer annealing times to eliminate the residual stress.
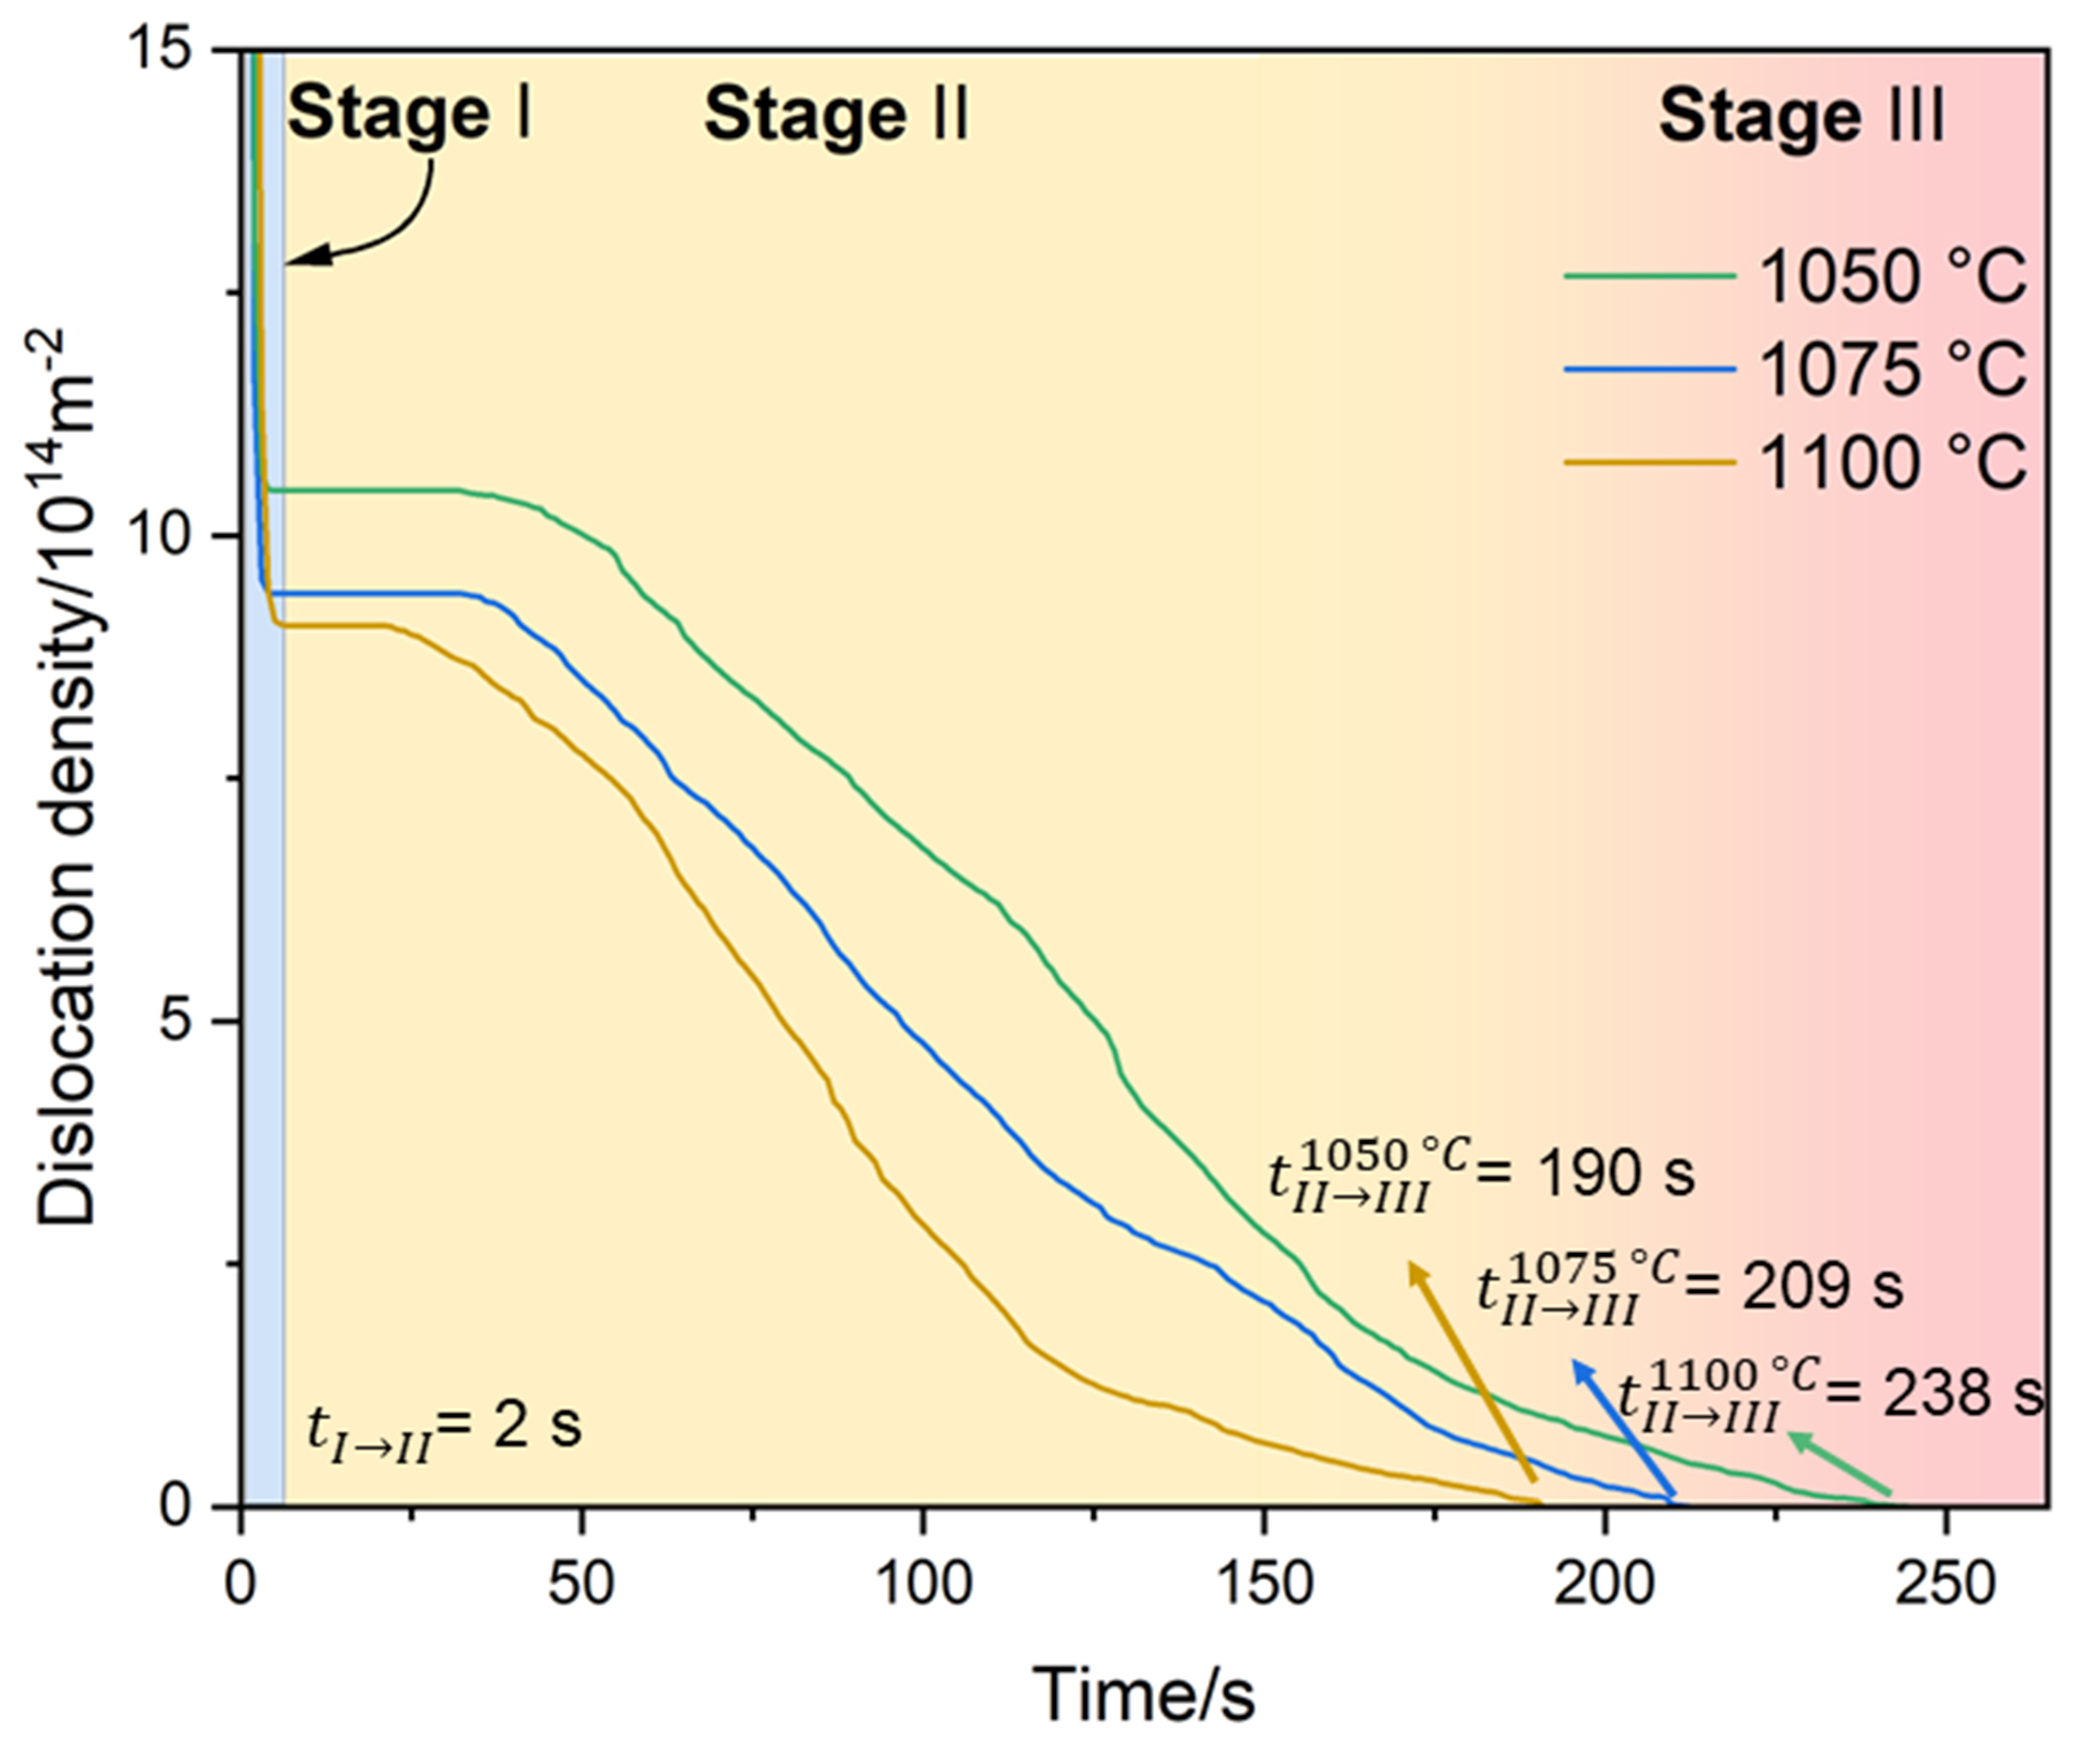
Figure 6. Evolution of the average dislocation density during the annealing process at different temperatures.
At Stage II, given that there remains a certain deformation energy within the pre-annealed matrix, the main driving force stems from energy disparities, with dislocation density progression chiefly involving recovery and grain enlargement. As the annealing time extends, the change rate of dislocation density decelerates, eventually stabilizing after a long-time annealing process. Under this condition, the driving pressure provided by grain boundary curvature plays a major role in the grain growth after annealing, but the deformed structure can be completely eliminated, thus the dislocation density tends to be stable (Stage III) in this work.
Figure 7 clearly describes the change of several typical SRX characteristics as annealing time increases in the 10%-1,075 °C sample. To avoid abrupt changes in size due to early SRX nuclei, an area-weighted equivalent grain size (
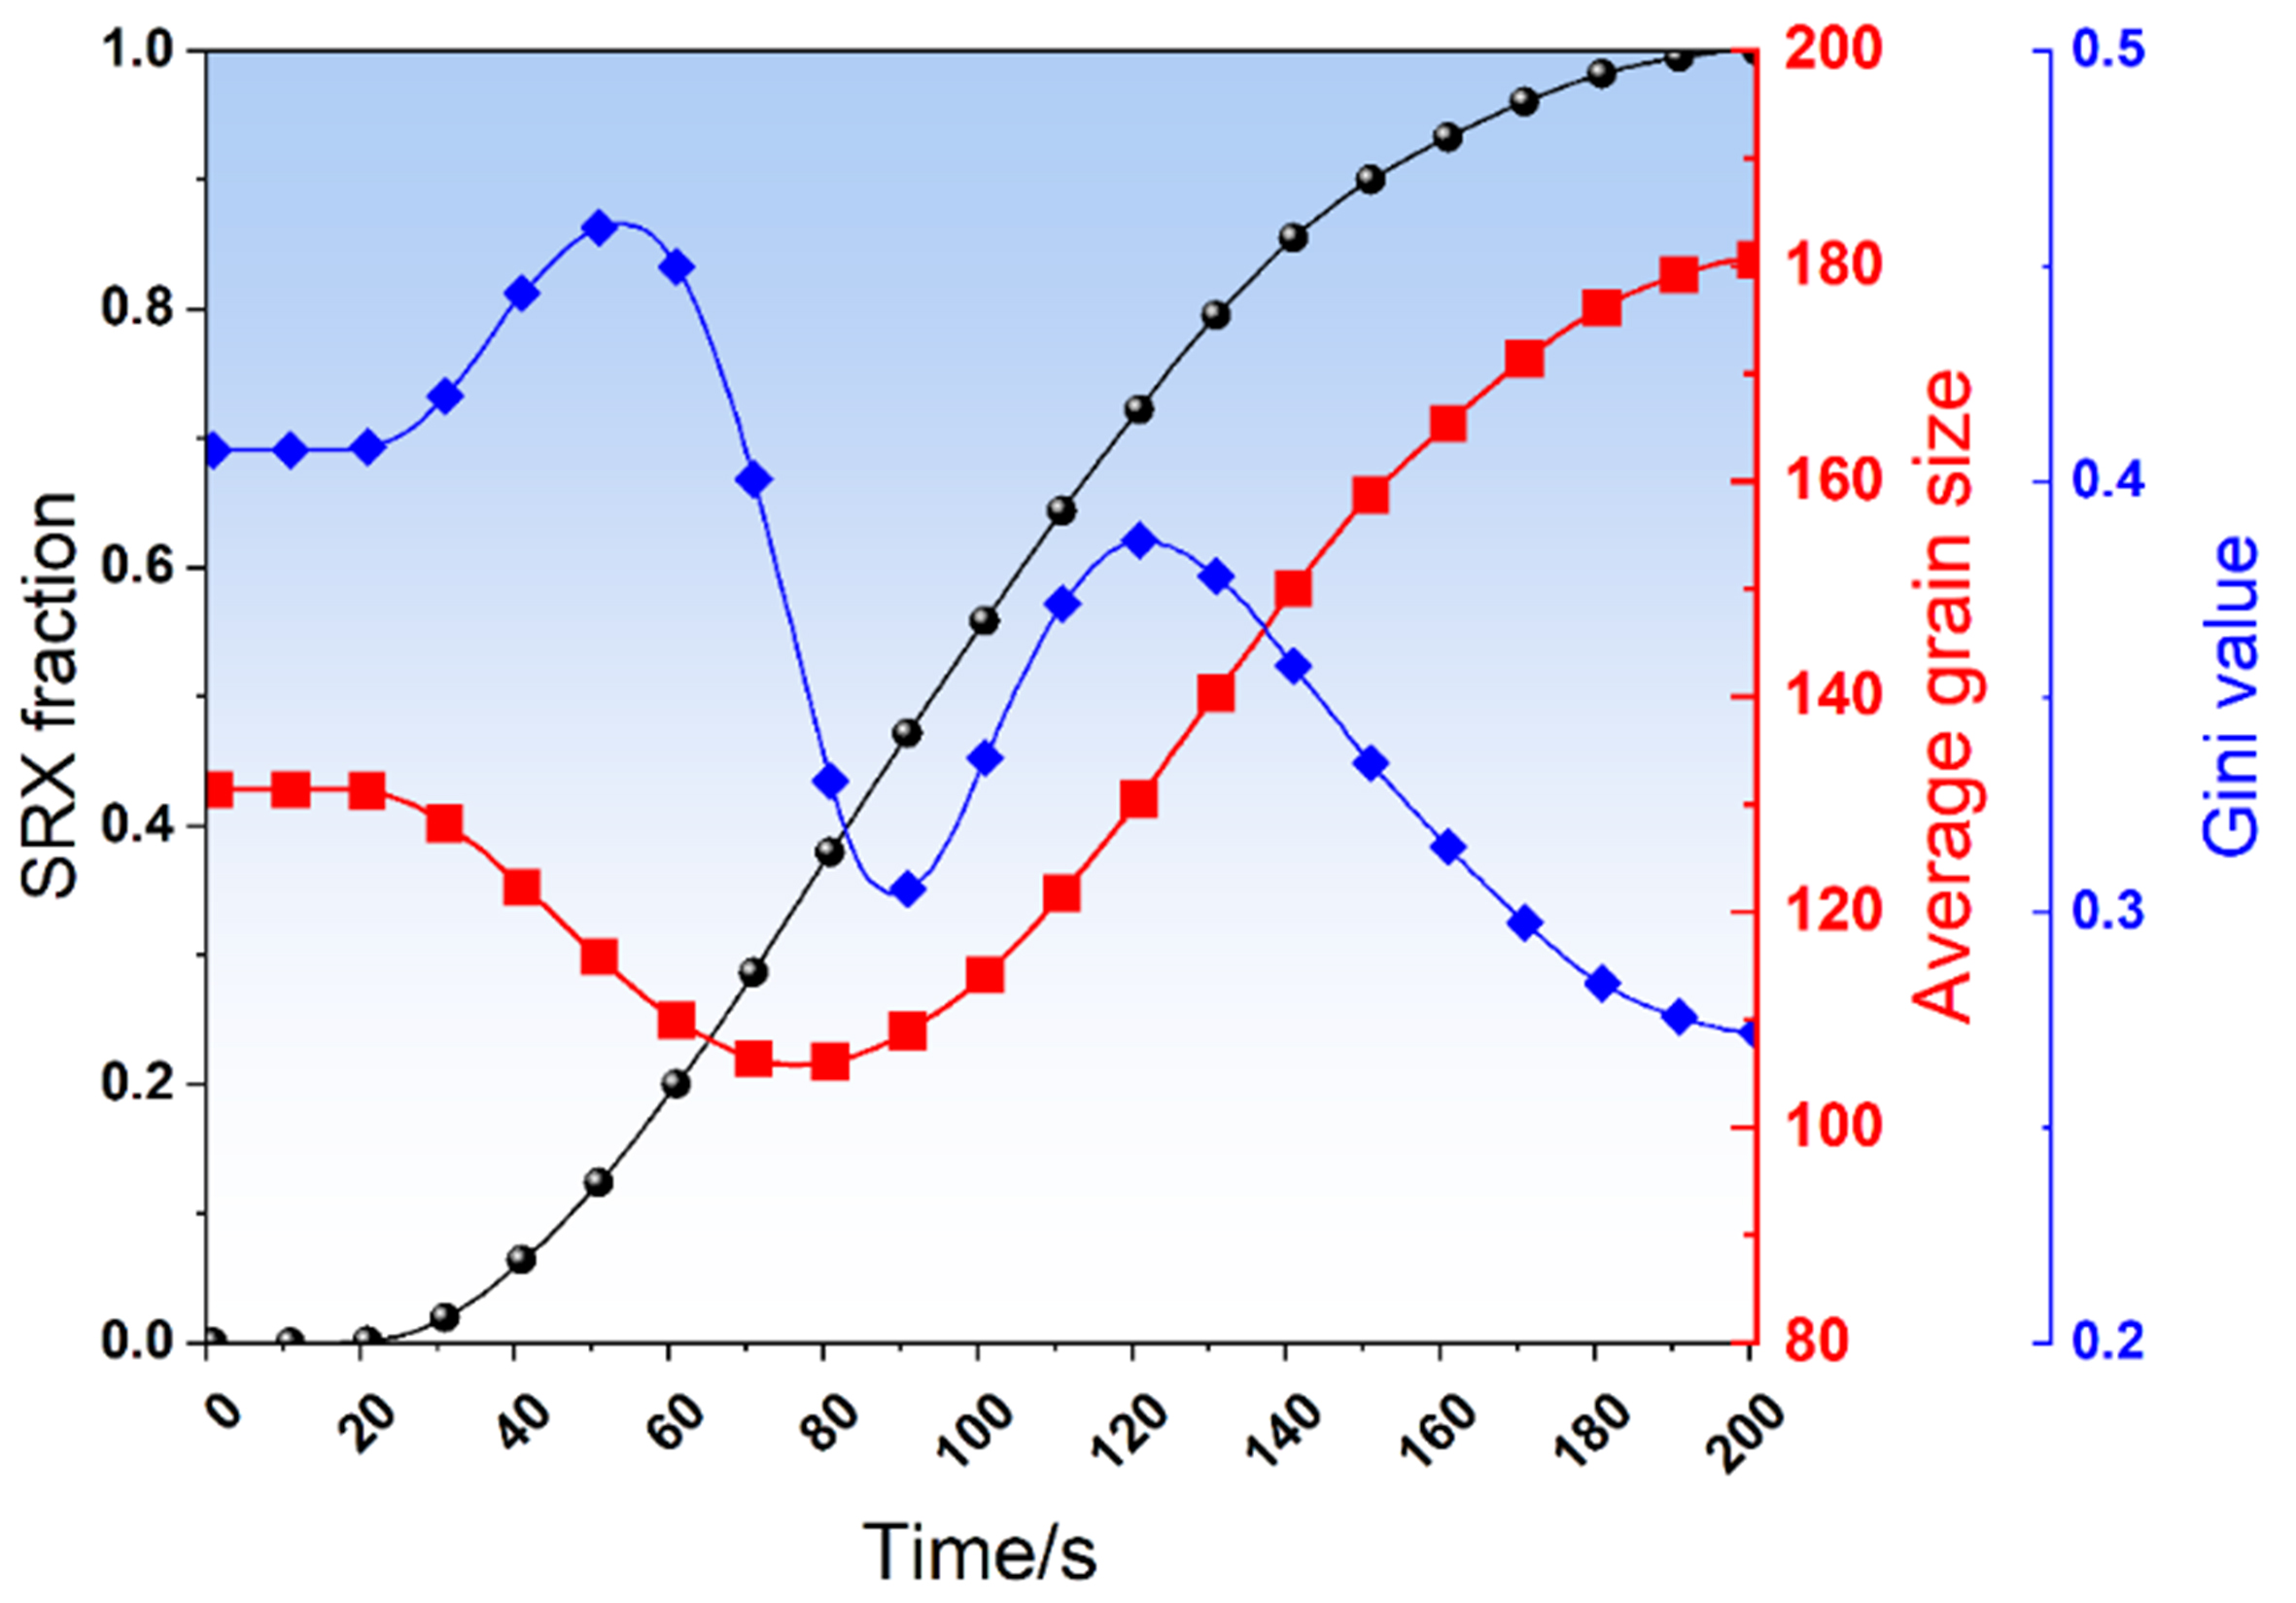
Figure 7. Variation of SRX fraction, average grain size, and homogeneity factor with annealing time in the 10%-1,075 °C sample. SRX: Static recrystallization.
where di corresponds to the area-weighted equivalent grain size of the ith grain after sorting, and Ng is the number of grains. Generally, the G factor ranges between 0 and 1, namely, the “0” value indicates complete uniformity (each grain has the same size), while the “1” value means complete nonuniformity. It can be clearly observed from Figure 7 that, at the initial annealing stage (t < 20 s), although the size of SRX nucleus is much smaller than that of the native grain, its smaller nucleation area has a minor impact on the SRX characteristics value; thus, the overall trend is stable. Besides, the extension of holding time can promote the continuous growth of SRX grains, leading to a steady increase in the recrystallization fraction. Then, we can observe that the average grain size begins to decline continuously, and the homogeneity factor also rises rapidly to the peak value, mainly due to the increasing area ratio of the newly formed SRX grains.
However, as the size difference between the native deformation structures and the SRX grains gradually decreases, the homogeneity factor (G value) drops rapidly after reaching its first peak value, and the decline rate of the average grain size also slows down. When the annealing time reaches 80 s, the average grain size continuously increases after reaching a trough. Meanwhile, the G value also shows an inflection point at
Figure 8 intuitively displays the final microstructure of fully recrystallized samples at an annealing temperature of 1,075 °C with different strains. Figure 8A, C, E and 8B, D, F corresponds to the CA modeling results and the experimental results, respectively. As observed, the SRX grain size decreases with increasing strain. Furthermore, the predicted grain topological structures of all samples are well in agreement with the experimental microstructures. To intuitively present the modeling predictability, Figure 9 displays the comparison between the predicted and measured average grain size. The predicted values obtained from the established CA model basically maintain an error within 8% compared with the experimental results. This implies that the SRX process of experimental alloy can be successfully simulated by using this novel CA method.
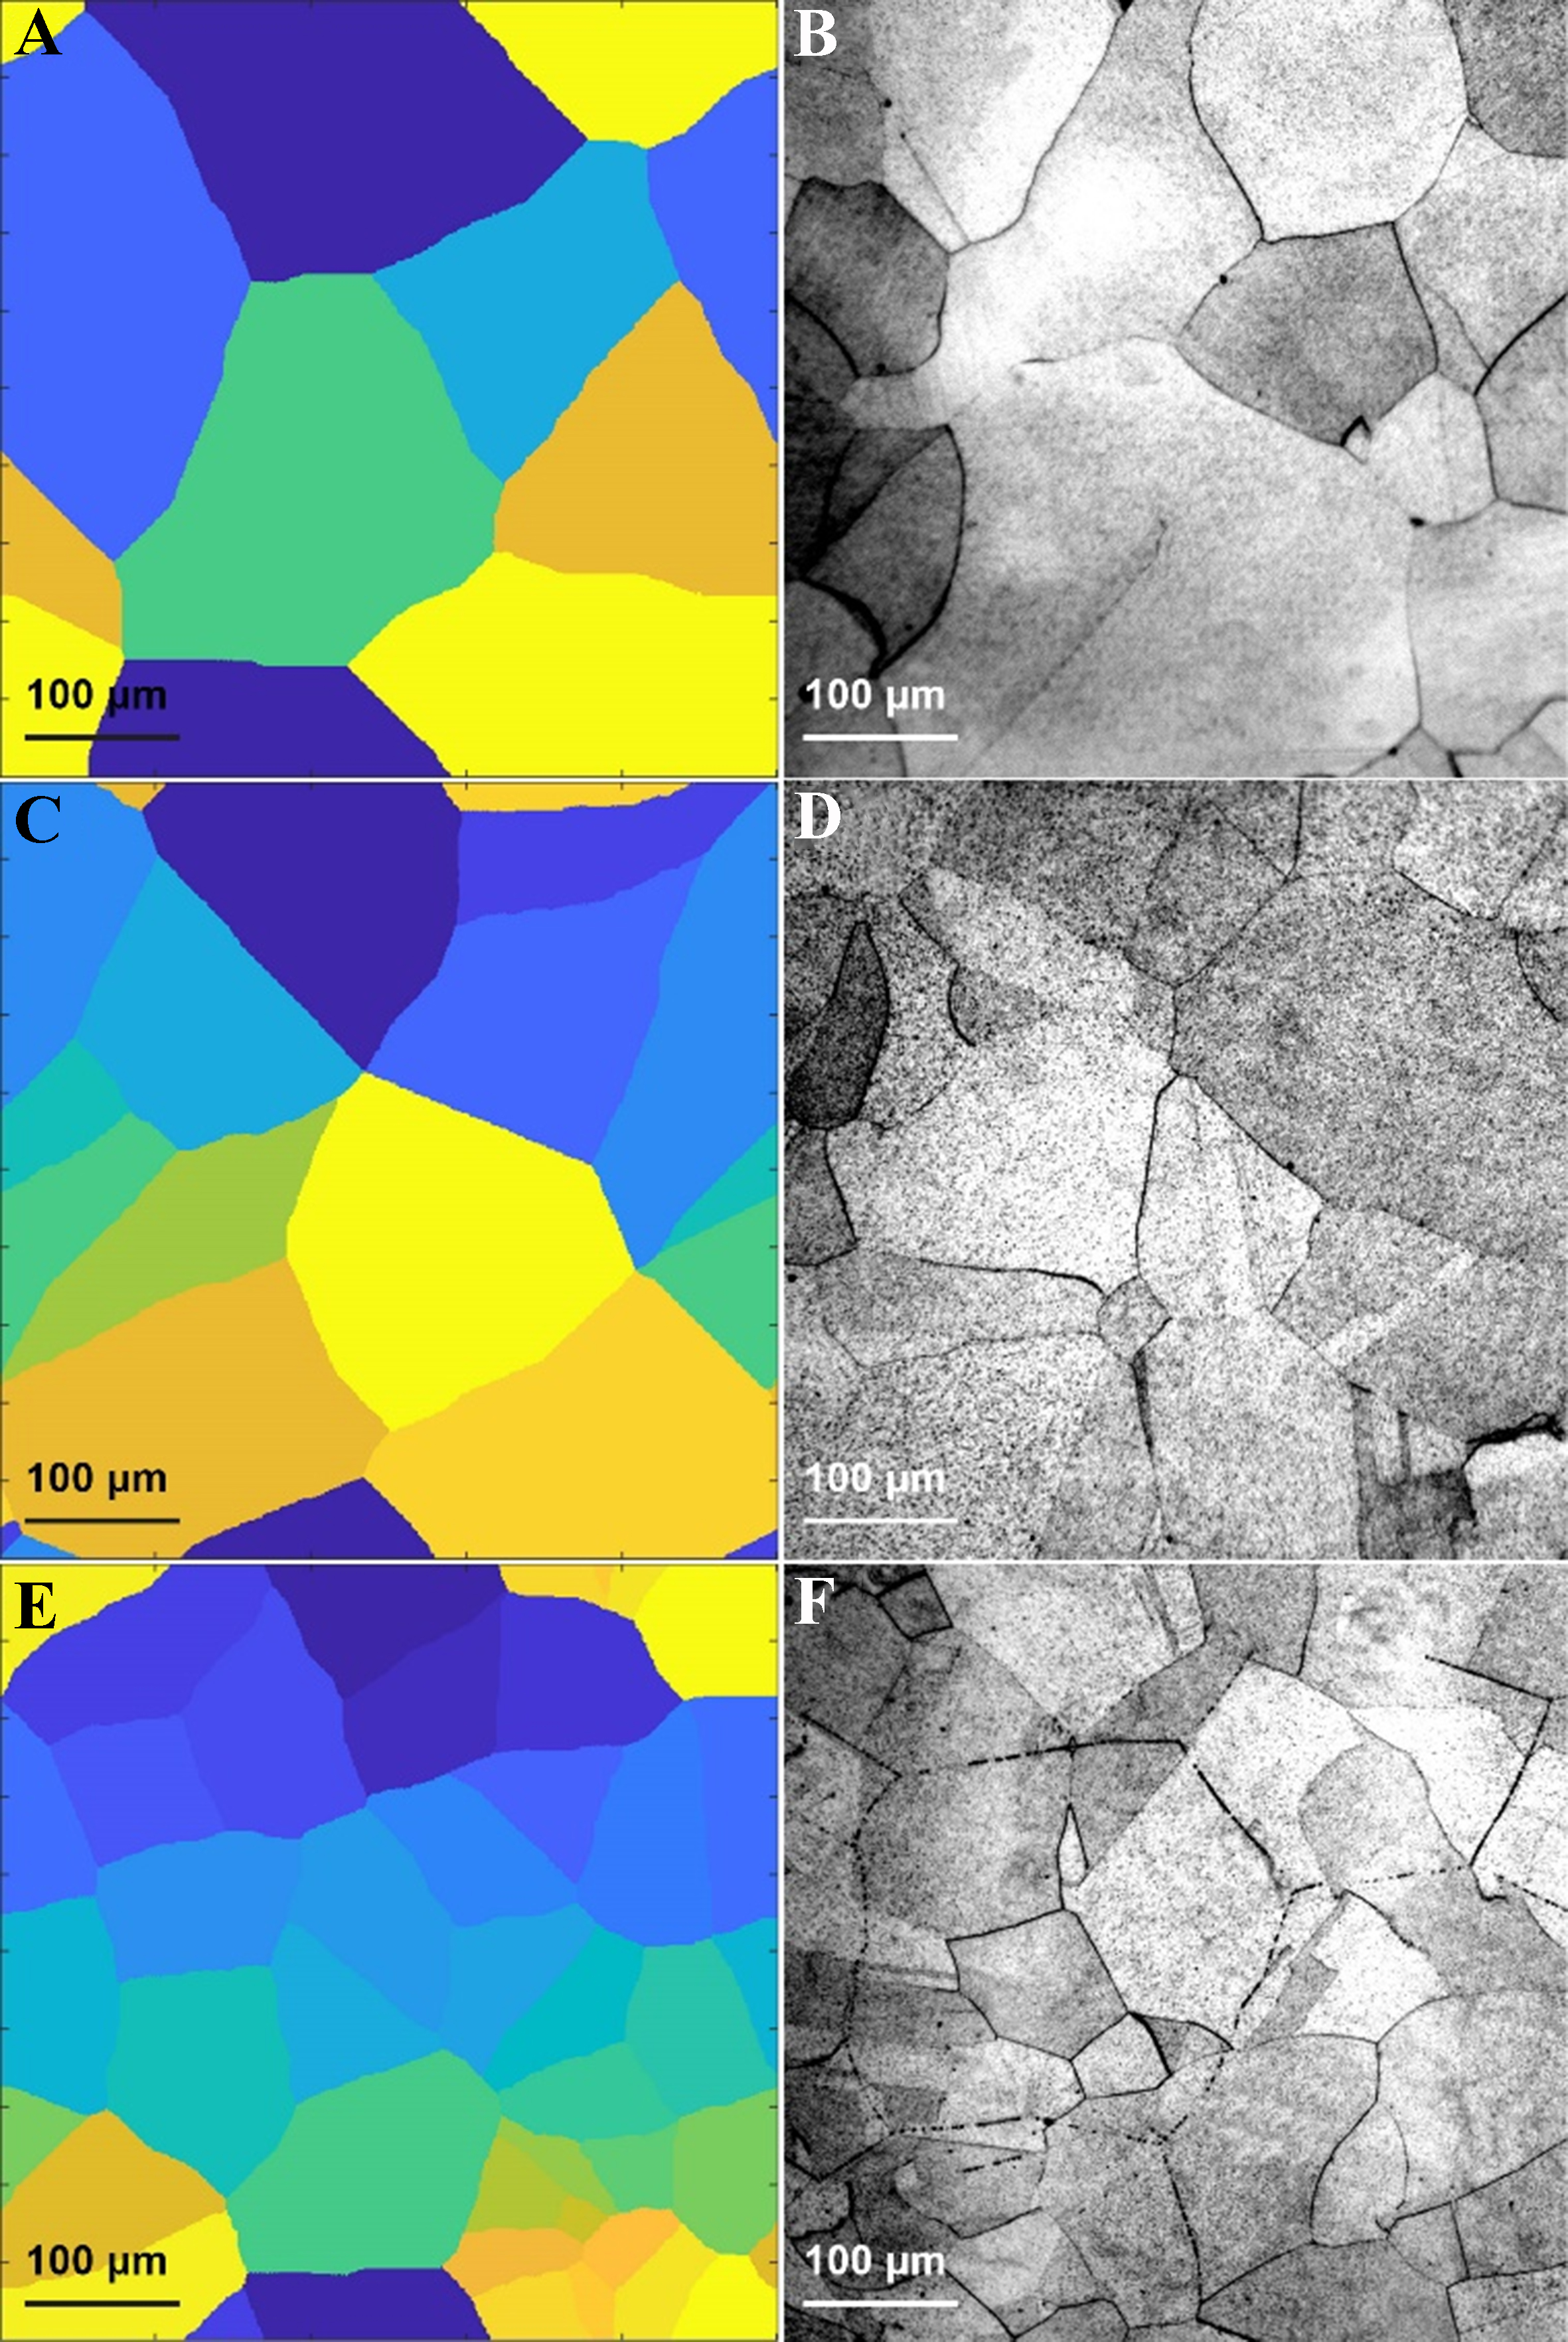
Figure 8. Simulated and experimental microstructure under different conditions: (A and B) 7%/1,075 °C; (C and D) 10%/1,075 °C; (E and F) 15%/1,075 °C.
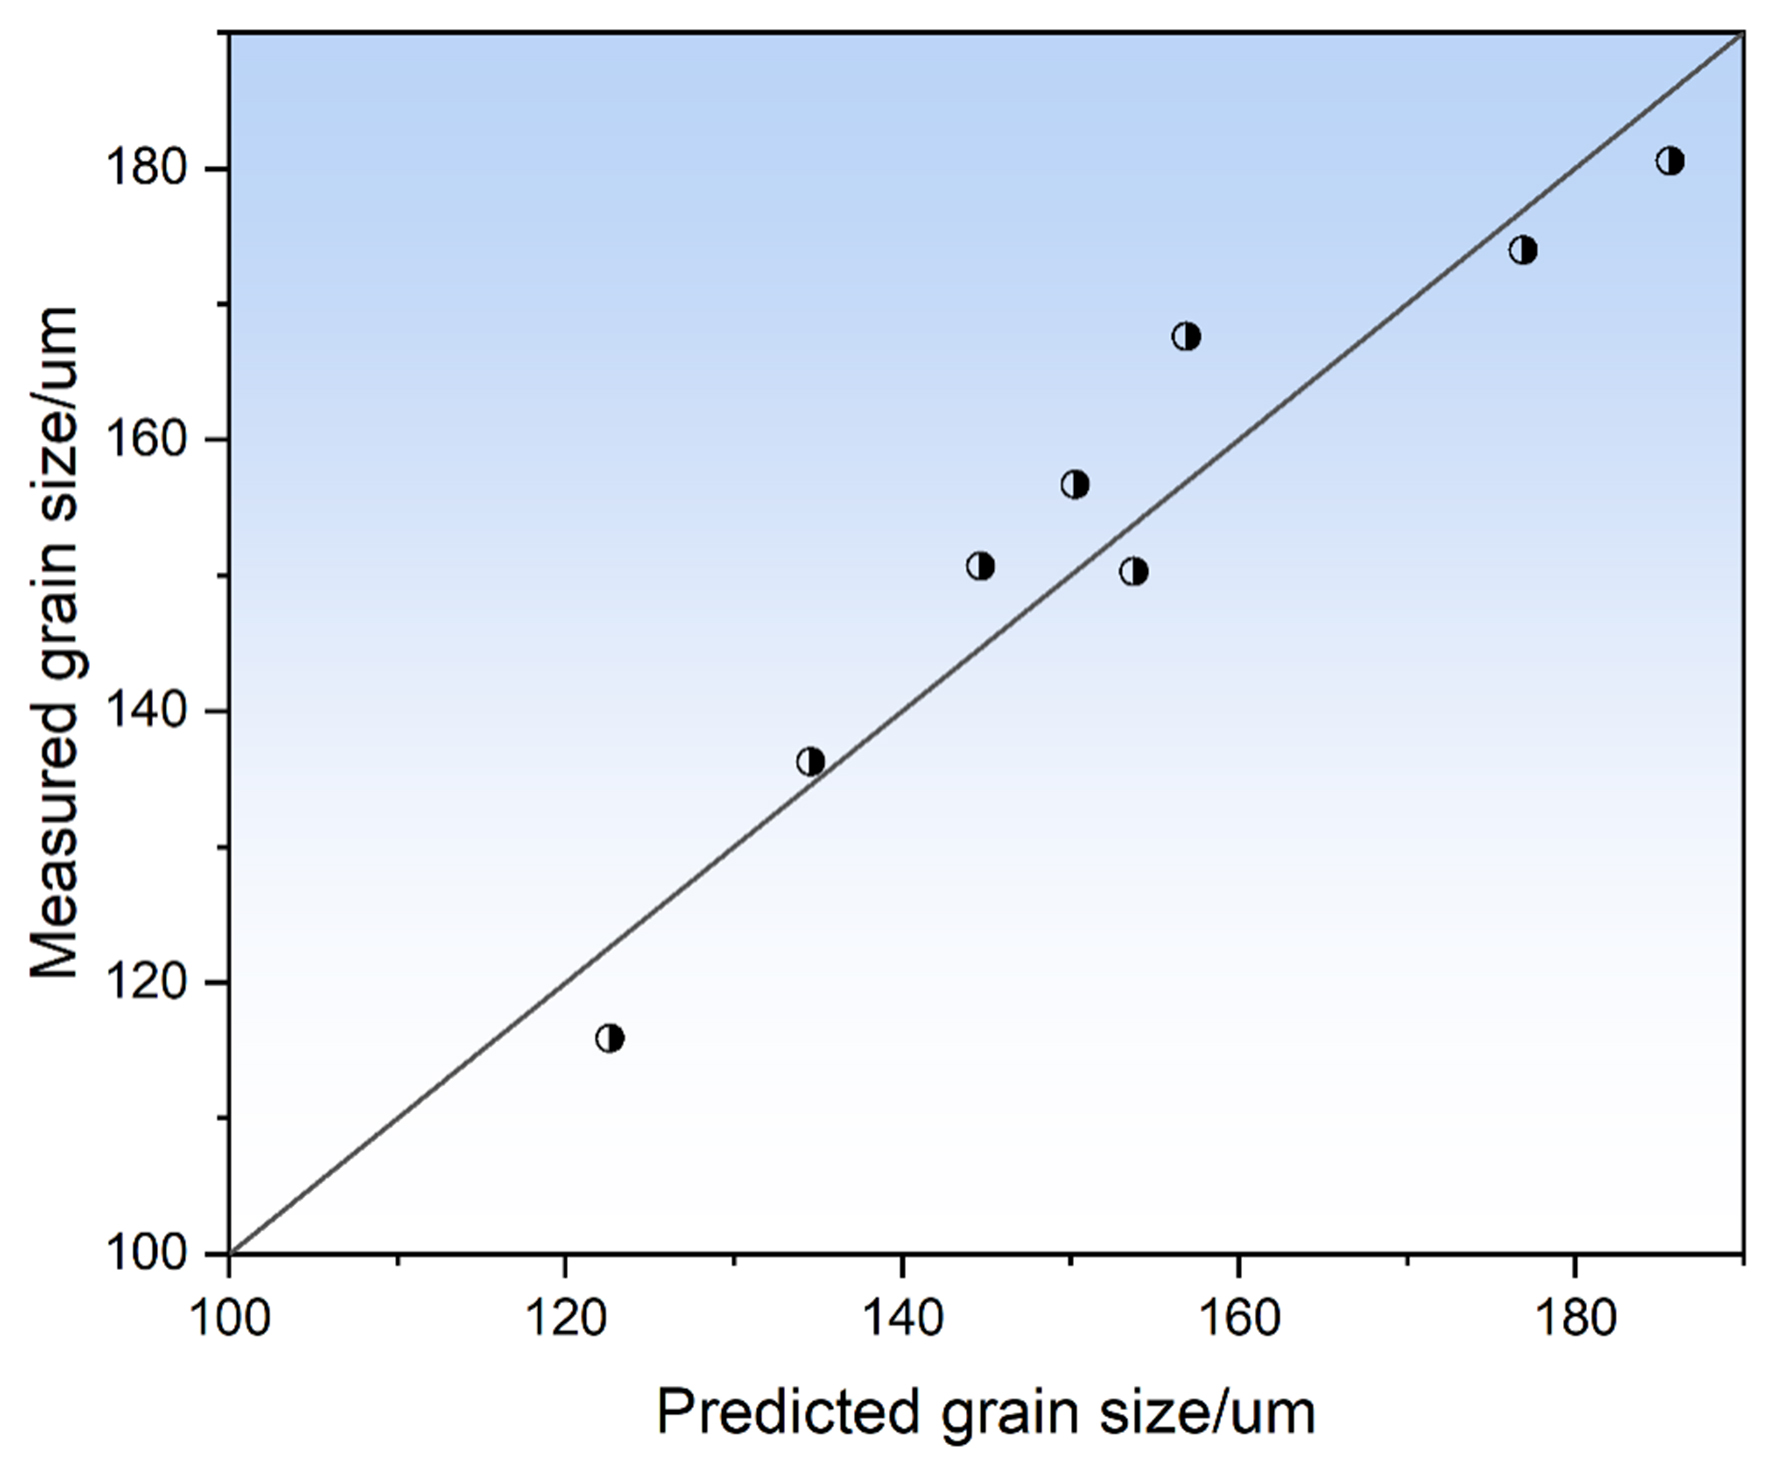
Figure 9. Comparisons between the experimental and the predicted average grain sizes.
Predictions derived from the CA model can offer some significant insights into further investigations on the SRX behavior. Consequently, we derived the Johnson-Mehl-Avrami-Kolmogorov (JMAK) analysis model by extracting the time-correlated recrystallization volume fraction (VSRX) data from CA simulation. Figure 10A displays the correlation between the average VSRX and the annealing duration under different thermomechanical process conditions. It can be observed that, consistent with some previous results, an increasing strain is prone to accelerate the recrystallization rate, causing the VSRX vs. t curves to offset the negative direction of the x-axis. Moreover, these curves portray a characteristic S-curve, aligning its evolution trajectory with the JMAK model and corroborating accounts in the pertinent literature[40].
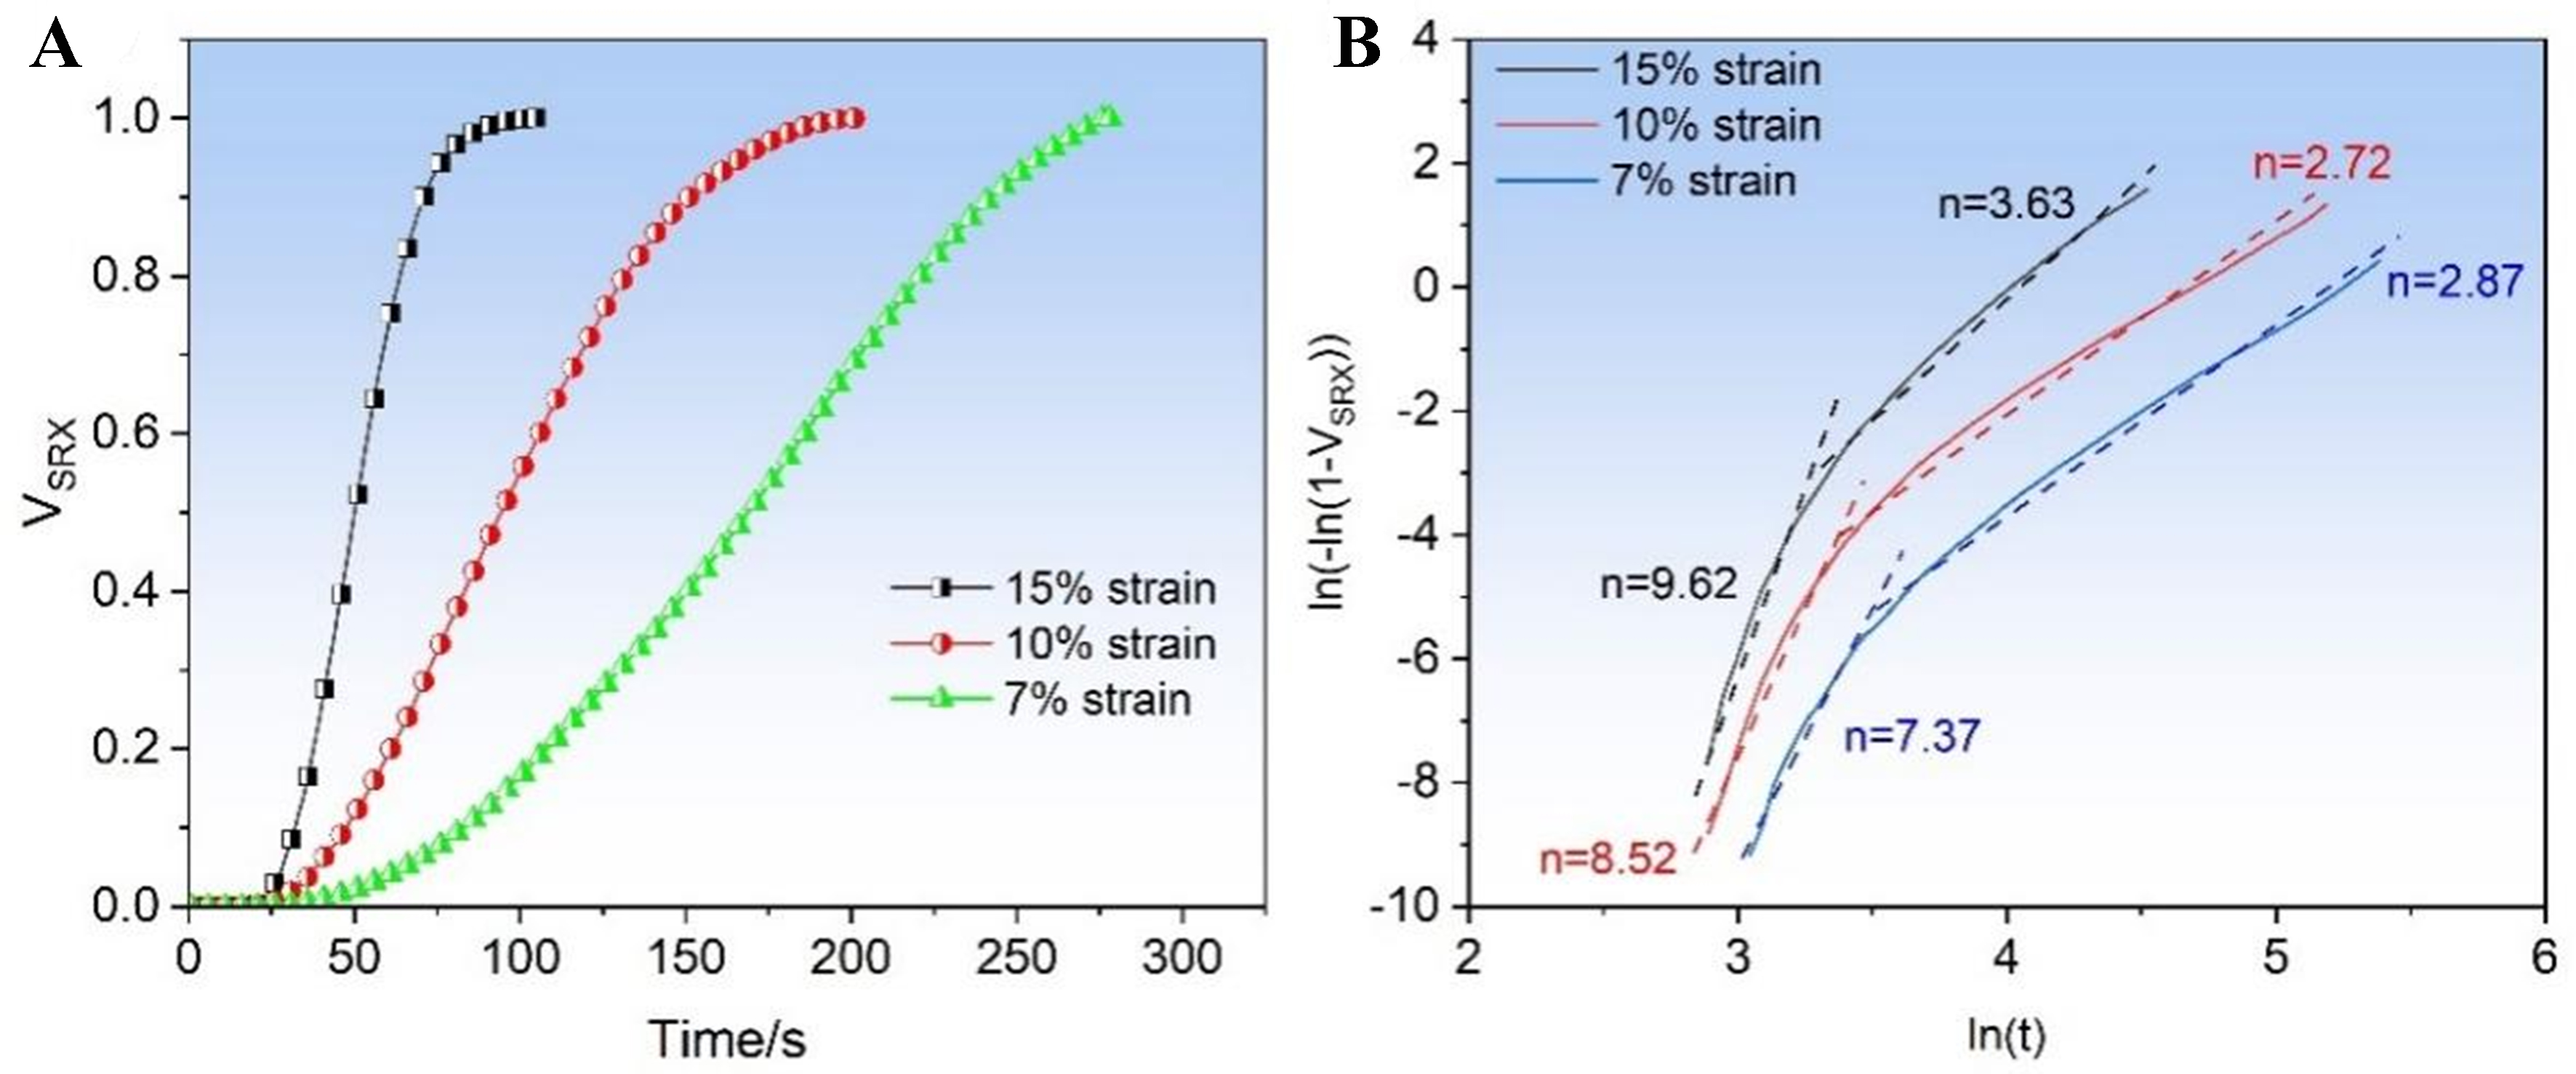
Figure 10. (A) Variation in the simulated recrystallization fraction with time; (B) JMAK plots. JMAK: Johnson-Mehl-Avrami-Kolmogorov.
To further clarify its recrystallization kinetics characteristics, we depicted the time-related functions of recrystallization kinetics under different strains based on the classic JMAK model[41]:
where d is a constant related to the grain shape. n is the Avrami exponent, which can be determined based on the slope of ln[-ln(1-VSRX)] vs. ln(t). Figure 10B plots the ln[-ln(1-VSRX)] vs. ln(t) curve with the VSRX value ranging from 0.05 to 0.95. The recrystallization kinetics behavior can be divided into two distinct parts. At the early stage of SRX, the kinetics seem to exhibit some linear characteristics. Through linear fitting of the ln[-ln(1-VSRX)] vs. ln(t) curves at the strains of 7%, 10%, and 15%, the n values were calculated as 9.62, 8.52, and 7.37, respectively. The given n values generally surpass the corresponding ideal theoretical mark of 3.0[37], attesting to an enhanced overall SRX rate at the commencement of recrystallization. Furthermore, a larger strain corresponds to a higher SRX rate, which might be related to the nucleation density and the migration rate of recrystallized grain boundaries.
Moreover, a noticeable turning point in the Avrami exponent can be observed in all annealed specimens, signifying a diminished SRX rate, which mostly aligns with the findings of some previous related research[42,43]. This is primarily due to the formation of a recrystallization front after mutual collisions of SRX grains at the later stages of annealing treatment. Meanwhile, the driving force for the grain boundary migration is mainly provided by the grain boundary curvature, which is considerably less than the driving force emanating from the energy discrepancy. Therefore, grain growth is significantly restricted, and the advancement speed of the recrystallization front decreases. Additionally, with the sustained strain, there is a marked leftward shift around the transition time-point, primarily owing to the enhanced nucleation density resulting from increased rolling reduction, which not only facilitates earlier intergranular collisions but also amplifies the probability of a nonuniform nucleation distribution.
CONCLUSIONS
In this study, we examined the SRX behavior of INCOLOY alloy 925 under various thermomechanical processing conditions using experiments and CA simulations. The main conclusions are as follows:
1. An innovative computational framework that integrates CA simulations with machine learning was developed to model microstructure evolution during SRX. Rigorous validation studies confirmed that the model accurately reproduces the experimentally observed recrystallization characteristics under different conditions.
2. The SRX-net model was designed to implement a discrete mapping of dislocation structures. This microstructure-based deep learning approach allows for precise and efficient estimation of deformation energy heterogeneity without relying on costly CP simulations. Compared with RF and U-net models, SRX-net not only demonstrates superior accuracy in predicting macroscopic dislocation distributions but also excels at identifying intragranular substructures and localized strain heterogeneity.
3. The dislocation escape assumption in the recovery process is introduced to address the model’s spatial resolution limitations, enabling the capture of mesoscopic dynamics in dislocation evolution. At the beginning of the annealing process, the appearance of numerous nuclei leads to a sharp decline in dislocation density. As the SRX grains grow, variations in dislocation density moderate, although some pronounced local perturbations may occur. However, this localized stress concentration is insufficient to trigger nucleation.
4. Based on the classic JMAK model, we illustrated the recrystallization dynamics under different strains. During the early stages of SRX, nucleation serves as the primary mechanism and exhibits a higher Avrami exponent. Subsequently, mutual collisions among SRX grains lead to a sudden change in the Avrami exponent. During this phase, grain boundary migration plays a dominant role in microstructure evolution.
DECLARATIONS
Authors’ contributions
Investigation, data curation, visualization, writing - original draft: Zhu, Y.
Methodology, project administration, supervision, writing - review and editing, funding acquisition: Cao, Y.
Data curation, visualization, writing - review and editing: Xu, B.
Investigation, writing - review and editing: Zhang, J.
Investigation, data curation: He, Q.
Supervision, writing - review and editing: Luo, R.
Writing - review and editing, funding acquisition: Jia, X.; Liu, Q.
Supervision, writing - review and editing: Hou, Z.
Availability of data and materials
Raw data that support the findings are available from the corresponding author upon reasonable request.
Financial support and sponsorship
The authors greatly appreciate the funding support of the National Key Research and Development Program of China (No. 2021YFB3703000), Open Research Fund from Chongqing Materials Research Institute Co., Ltd. (No. CMRI-KFJJ-202405), Achievement Transformation and Innovation Fund Project (CZKY2023075), State Key Laboratory of Mechanical Transmission for Advanced Equipment Project (SKLMT-MSKFKT-202219), National Natural Science Foundation of China (No. 2033206), Sichuan Natural Science Foundation (No. 2022NSFSC0302), and Sichuan Civil Aircraft Fire Science and Safety Engineering Key Laboratory Project (MZ2023JB01), and Doctoral Program of CAAC Flight Academy (PHD2023-063).
Conflicts of interest
He, Q. is affiliated with Chongqing Materials Research Institute Co., Ltd, while the other authors have declared that they have no conflicts of interest.
Ethical approval and consent to participate
Not applicable.
Consent for publication
Not applicable.
Copyright
© The Author(s) 2025.
Supplementary Materials
REFERENCES
1. Zhang, F.; Chen, P.; Du, J. H.; Wang, P. F.; Li, X. W. Optimizing the microstructure and mechanical properties of Fe-30.5Mn–8Al-1.0C lightweight austenitic steel through thermomechanical treatment. Mater. Sci. Eng. A. 2024, 903, 146674.
2. Lin, F.; Sitko, M.; Madej, L.; Delannay, L. Non-uniform grain boundary migration during static recrystallization: a cellular automaton study. Metall. Mater. Trans. A. 2022, 53, 1630-44.
3. Liu, R.; Zhang, Z.; Zhou, G.; Jia, Z.; Li, D.; Wu, P. A polycrystal plasticity-cellular automaton integrated modeling method for continuous dynamic recrystallization and its application to AA2196 alloy. Int. J. Plast. 2024, 182, 104127.
4. Hesselbarth, H. W.; Göbel, I. R. Simulation of recrystallization by cellular automata. Acta. Metall. Mater. 1991, 39, 2135-43.
5. Zhi, Y.; Jiang, Y.; Ke, D.; Hu, X.; Liu, X. Review on cellular automata for microstructure simulation of metallic materials. Materials 2024, 17, 1370.
6. Du, J.; Liu, Y.; Zhao, C.; et al. Towards mechanical performance paradox and behind thermo-kinetic origins of aluminum alloys with additional solutes (X = Mg, Cu and Si) from atomistic simulations. J. Mater. Inf. 2025, 5, 10.
7. Papanikolaou, S.; Tzimas, M.; Reid, A. C. E.; Langer, S. A. Spatial strain correlations, machine learning, and deformation history in crystal plasticity. Phys. Rev. E. 2019, 99, 053003.
8. Eghtesad, A.; Luo, Q.; Shang, S.; et al. Machine learning-enabled identification of micromechanical stress and strain hotspots predicted via dislocation density-based crystal plasticity simulations. Int. J. Plast. 2023, 166, 103646.
9. Jiang, M.; Hu, X.; Xing, C.; et al. Fast parameter optimization for high-fidelity crystal plasticity simulation using active learning. J. Mater. Inf. 2024, 4, 22.
10. Muhammad, W.; Brahme, A. P.; Ibragimova, O.; Kang, J.; Inal, K. A machine learning framework to predict local strain distribution and the evolution of plastic anisotropy & fracture in additively manufactured alloys. Int. J. Plast. 2021, 136, 102867.
11. Riyad, I. A.; Clausen, B.; Savage, D. J.; Jeong, Y.; Brown, D. W.; Knezevic, M. Modeling deformation, recovery, and recrystallization of tantalum using a higher order elasto-viscoplastic self-consistent model. J. Mech. Phys. Solids. 2025, 194, 105925.
12. Iguchi, K.; Ogawa, T.; Sun, F.; Adachi, Y. Simulation-aided analysis of ferrite recrystallization behavior of pure iron with different dislocation characters. J. Mater. Res. Technol. 2023, 24, 6558-66.
13. Raabe, D.; Becker, R. C. Coupling of a crystal plasticity finite-element model with a probabilistic cellular automaton for simulating primary static recrystallization in aluminium. Modelling. Simul. Mater. Sci. Eng. 2000, 8, 445.
14. Li, H.; Sun, X.; Yang, H. A three-dimensional cellular automata-crystal plasticity finite element model for predicting the multiscale interaction among heterogeneous deformation, DRX microstructural evolution and mechanical responses in titanium alloys. Int. J. Plast. 2016, 87, 154-80.
15. Sitko, M.; Chao, Q.; Wang, J.; Perzynski, K.; Muszka, K.; Madej, L. A parallel version of the cellular automata static recrystallization model dedicated for high performance computing platforms - development and verification. Comput. Mater. Sci. 2020, 172, 109283.
16. Hashemi, S.; Kalidindi, S. R. A machine learning framework for the temporal evolution of microstructure during static recrystallization of polycrystalline materials simulated by cellular automaton. Comput. Mater. Sci. 2021, 188, 110132.
17. Chen, F.; Zhu, H.; Zhang, H.; Cui, Z. Mesoscale modeling of dynamic recrystallization: multilevel cellular automaton simulation framework. Metall. Mater. Trans. A. 2020, 51, 1286-303.
18. Xu, J.; He, Q.; Jin, X.; et al. A 3D cellular automaton with inhomogeneous nucleation for simulating dynamic recrystallization of low-alloy steel with mixed-grain microstructure. J. Mater. Process. Technol. 2023, 322, 118171.
19. Zecevic, M.; Knezevic, M.; Mcwilliams, B.; Lebensohn, R. A. Modeling of the thermo-mechanical response and texture evolution of WE43 Mg alloy in the dynamic recrystallization regime using a viscoplastic self-consistent formulation. Int. J. Plast. 2020, 130, 102705.
20. Dantin, M. J. Thermomechanical modeling predictions of the directed energy deposition process using a dislocation mechanics based internal state variable model. Mississippi State University, 2021. https://scholarsjunction.msstate.edu/cgi/viewcontent.cgi?article=6244&context=td. (accessed 2025-11-24).
21. Zhu, Y.; Cao, Y.; Ma, J.; et al. Cryogenic deformation tailors the dislocation accumulation mode to modify grain boundary character distribution of Incoloy 925. Mater. Charact. 2023, 202, 112995.
22. Zhang, L.; Liu, L.; Guo, S.; Pan, Q.; Lu, L. Microstructure and evolution of gradient dislocation cells in multi-principal element alloy subjected to cyclic torsion. Acta. Mater. 2024, 275, 120059.
23. Zhang, X.; Zhao, J.; Kang, G.; Zaiser, M. Geometrically necessary dislocations and related kinematic hardening in gradient grained materials: a nonlocal crystal plasticity study. Int. J. Plast. 2023, 163, 103553.
24. Abuzaid, W. Z.; Sangid, M. D.; Carroll, J. D.; Sehitoglu, H.; Lambros, J. Slip transfer and plastic strain accumulation across grain boundaries in Hastelloy X. J. Mech. Phys. Solids. 2012, 60, 1201-20.
25. Ma, X.; Huang, C.; Moering, J.; et al. Mechanical properties of copper/bronze laminates: role of interfaces. Acta. Mater. 2016, 116, 43-52.
26. Zaitsev, D. A. A generalized neighborhood for cellular automata. Theor. Comput. Sci. 2017, 666, 21-35.
27. Goetz, R.; Seetharaman, V. Modeling dynamic recrystallization using cellular automata. Scr. Mater. 1998, 38, 405-13.
28. Li, J.; Wu, Y.; Zhang, H.; Zhang, X. Study on the dynamic recrystallization mechanisms tailored by dislocation substructures of a coarse grained Co-free nickel-based superalloy. Mater. Charact. 2023, 201, 112961.
29. Verdier, M.; Brechet, Y.; Guyot, P. Recovery of AlMg alloys: flow stress and strain-hardening properties. Acta. Mater. 1998, 47, 127-34.
30. Asgharzadeh, A.; Nazari Tiji, S. A.; Park, T.; Pourboghrat, F. Prediction of softening kinetics and recrystallization texture in non-isothermally annealed bulged tubes using CPFEM and CA models. Mater. Sci. Eng. A. 2022, 832, 142308.
31. Yoshie, A.; Fujita, T.; Fujioka, M.; Okamoto, K.; Morikawa, H. Formulation of the decrease in dislocation density of deformed austenite due to static recovery and recrystallization. ISIJ. Int. 1996, 36, 474-80.
32. Alaneme, K. K.; Okotete, E. A. Recrystallization mechanisms and microstructure development in emerging metallic materials: a review. J. Sci. Adv. Mater. Devices. 2019, 4, 19-33.
33. Asgharzadeh, A.; Nazari Tiji, S. A.; Park, T.; Kim, J. H.; Pourboghrat, F. Cellular automata modeling of the kinetics of static recrystallization during the post-hydroforming annealing of steel tube. J. Mater. Sci. 2020, 55, 7938-57.
34. Zhu, Y.; Cao, Y.; Yuan, F.; et al. On the modified kinetics model describing the dynamic recrystallization behavior during hot deformation of Incoloy 925. J. Mater. Res. Technol. 2023, 24, 5702-12.
35. Wan, Z.; Shen, J.; Wang, T.; et al. Effect of hot deformation parameters on the dissolution of γ′ precipitates for As-cast Ni-based superalloys. J. Mater. Eng. Perform. 2022, 31, 1594-606.
36. Chen, Y.; Han, J.; Deng, H.; et al. Revealing grain boundary kinetics in three-dimensional space. Acta. Mater. 2024, 268, 119717.
37. Zheng, C.; Xiao, N.; Li, D.; Li, Y. Mesoscopic modeling of austenite static recrystallization in a low carbon steel using a coupled simulation method. Comput. Mater. Sci. 2009, 45, 568-75.
38. Kremeyer, K. Cellular automata investigations of binary solidification. J. Comput. Phys. 1998, 142, 243-63.
39. Liu, F.; Liu, Z.; Pei, X.; Hu, J.; Zhuang, Z. Modeling high temperature anneal hardening in Au submicron pillar by developing coupled dislocation glide-climb model. Int. J. Plast. 2017, 99, 102-19.
40. Hart-Rawung, T.; Buhl, J.; Horn, A.; Bambach, M.; Merklein, M. A unified model for isothermal and non-isothermal phase transformation in hot stamping of 22MnB5 steel. J. Mater. Process. Technol. 2023, 313, 117856.
41. Tutcuoglu, A.; Vidyasagar, A.; Bhattacharya, K.; Kochmann, D. Stochastic modeling of discontinuous dynamic recrystallization at finite strains in hcp metals. J. Mech. Phys. Solids. 2019, 122, 590-612.
42. Houria, M.; Matougui, N.; Mehdi, B.; Kherrouba, N.; Jahazi, M. Effect of plastic anisotropy on the kinetics of static softening in AA2024–T3 aluminum alloy. Met. Mater. Int. 2022, 28, 2042-58.
Cite This Article
How to Cite
Download Citation
Export Citation File:
Type of Import
Tips on Downloading Citation
Citation Manager File Format
Type of Import
Direct Import: When the Direct Import option is selected (the default state), a dialogue box will give you the option to Save or Open the downloaded citation data. Choosing Open will either launch your citation manager or give you a choice of applications with which to use the metadata. The Save option saves the file locally for later use.
Indirect Import: When the Indirect Import option is selected, the metadata is displayed and may be copied and pasted as needed.
About This Article
Special Topic
Copyright

Data & Comments
Data
0


Comments
Comments must be written in English. Spam, offensive content, impersonation, and private information will not be permitted. If any comment is reported and identified as inappropriate content by OAE staff, the comment will be removed without notice. If you have any queries or need any help, please contact us at [email protected].