Figure3

Simple formula learned via machine learning for creep rupture life prediction of high-temperature titanium alloys

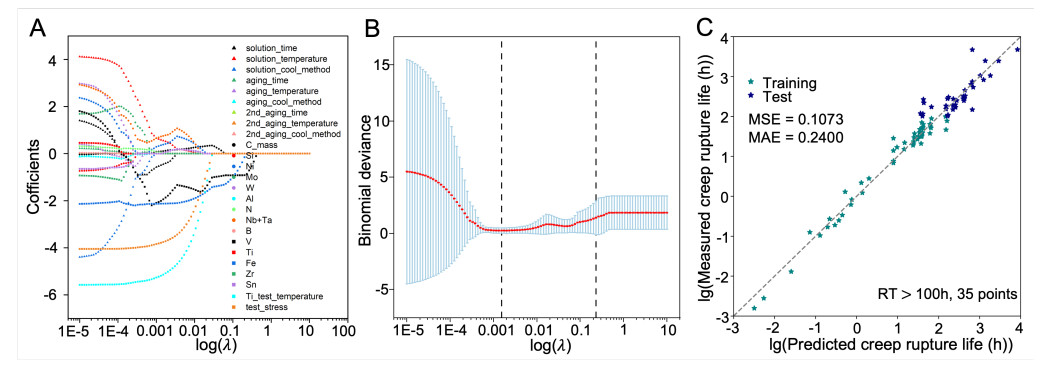
Figure 3. Feature selection via Lasso and model performance with reduced features, the data division with RT > 100 h is presented as an example. (A) Coefficient change of each of the 25 features with λ; (B) Model bias (binomial deviance) as a function of λ, the red points represent the mean value and the associated error bars are the standard deviation from multiple cross-validations; (C) The performance of the Lasso model with reduced features (11). Lasso: Least absolute shrinkage and selection pperator; RT: creep rupture life.

Cancer Drug Resistance
ISSN 2578-532X (Online)

Portico

All published articles will preserved here permanently:

https://www.portico.org/publishers/oae/

Portico

All published articles will preserved here permanently:

https://www.portico.org/publishers/oae/