


fig2
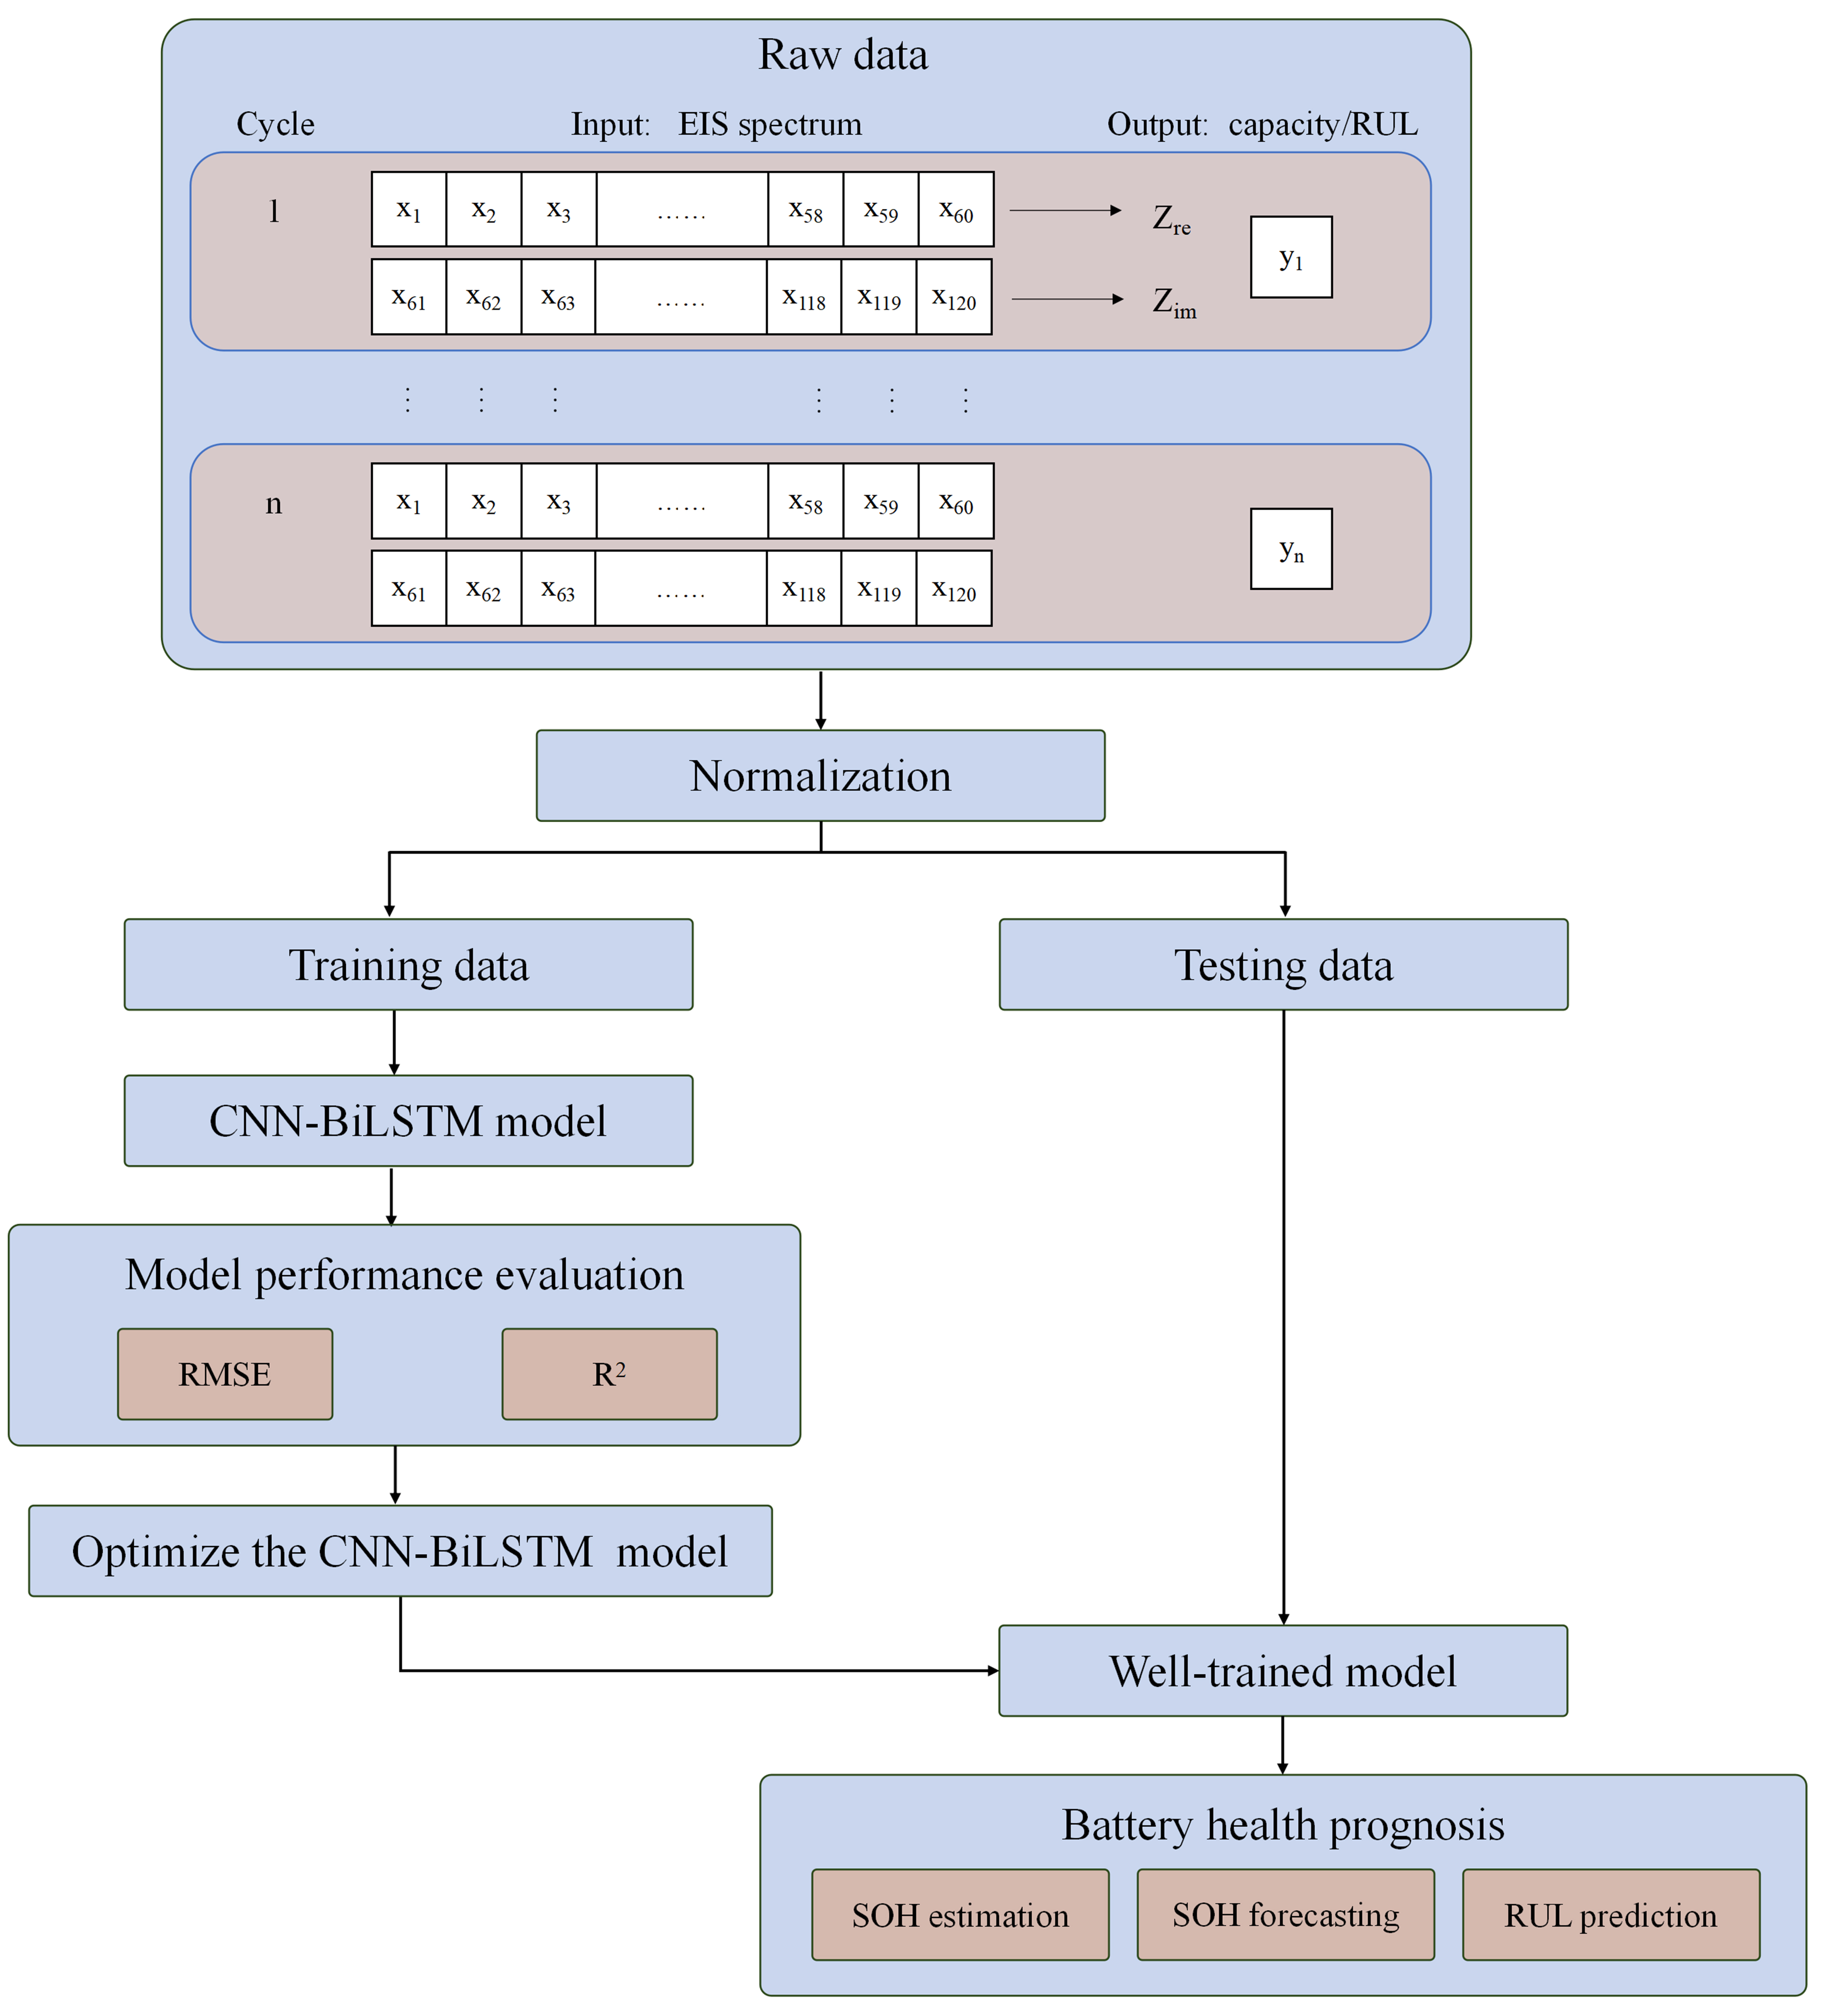
Figure 2. The flowchart of battery health prognosis via EIS using the CNN-BiLSTM model. The inputs to our model include both the real
Figure 2. The flowchart of battery health prognosis via EIS using the CNN-BiLSTM model. The inputs to our model include both the real


All published articles are preserved here permanently:
https://www.portico.org/publishers/oae/

