
fig1
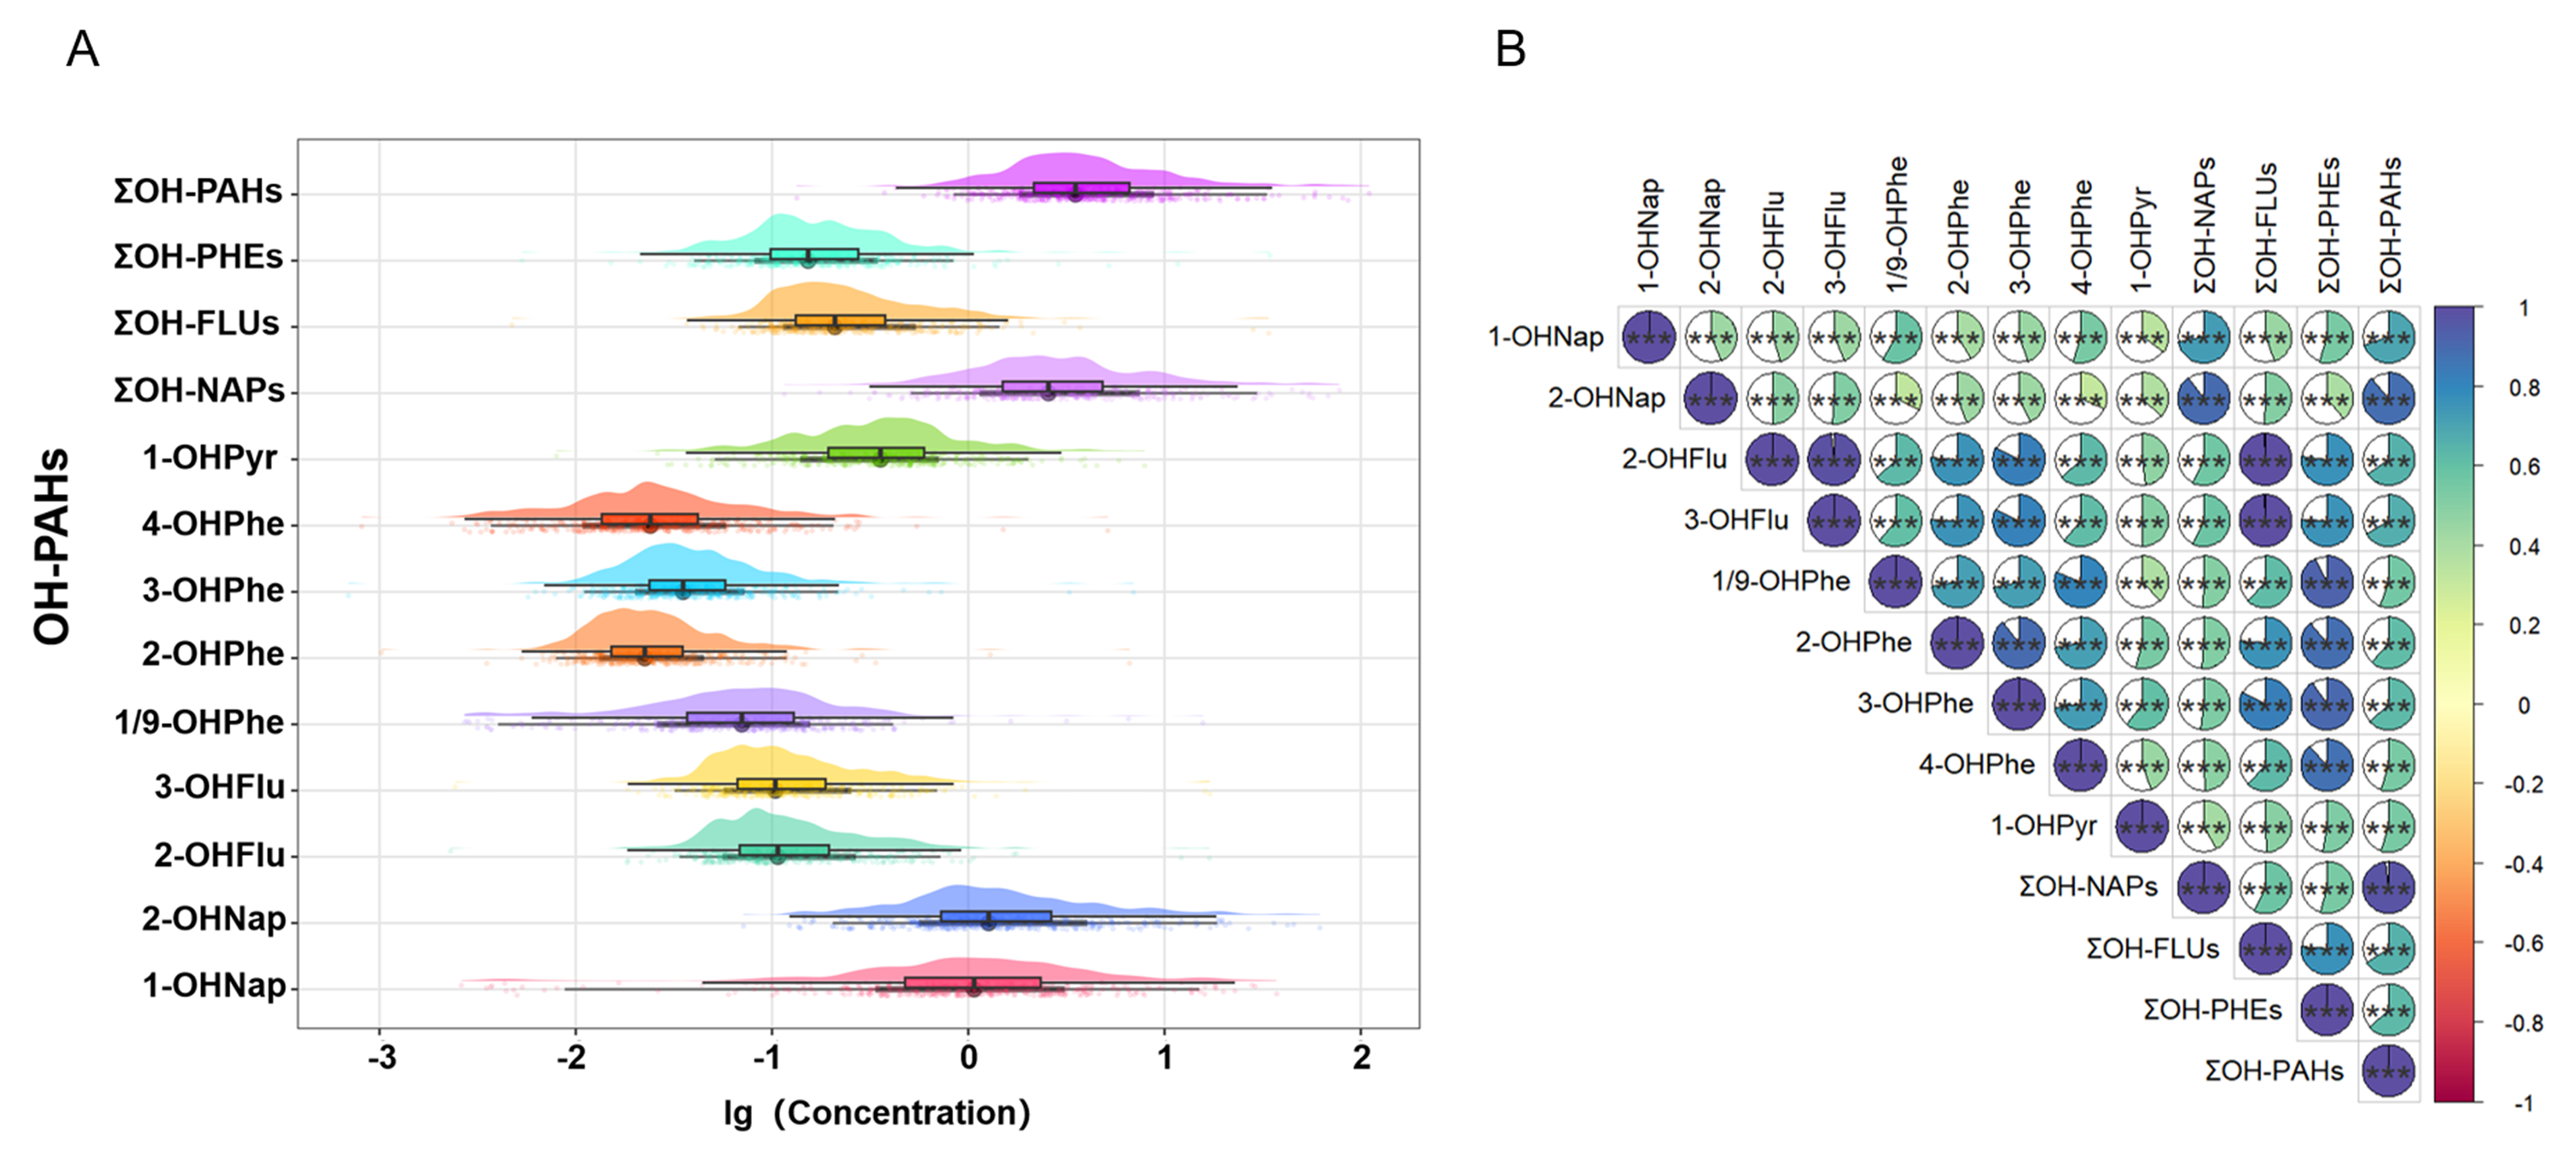
Figure 1. Distribution of different OH-PAH concentrations. (A) Raincloud plots, the left boundary denotes the 25th percentile (Q1), the right boundary denotes the 75th percentile (Q3), and the central solid line denotes the median (50th percentile); (B) Correlation matrix of OH-PAHs. Statistical significance is marked by asterisks based on two-tailed tests: *P < 0.05, **P < 0.01, ***P < 0.001. OH-PAH: Hydroxylated polycyclic aromatic hydrocarbon; ΣOH-PAHs: total sum of all nine urinary OH-PAH metabolites; ΣOH-PHEs: sum of 1/9-OHPhe, 2-OHPhe, 3-OHPhe, and 4-OHPhe; ΣOH-FLUs: sum of 2-OHFlu and 3-OHFlu; ΣOH-NAPs: sum of 1-OHNap and 2-OHNap; 1-OHPyr: 1-hydroxypyrene; 4-OHPhe: 4-hydroxyphenanthrene; 3-OHPhe: 3-hydroxyphenanthrene; 2-OHPhe: 2-hydroxyphenanthrene; 1/9-OHPhe: 1/9-hydroxyphenanthrene; 3-OHFlu: 3-hydroxyfluorene; 2-OHFlu: 2-hydroxyfluorene; 2-OHNap: 2-hydroxynaphthalene; 1-OHNap: 1-hydroxynaphthalene.