
fig5
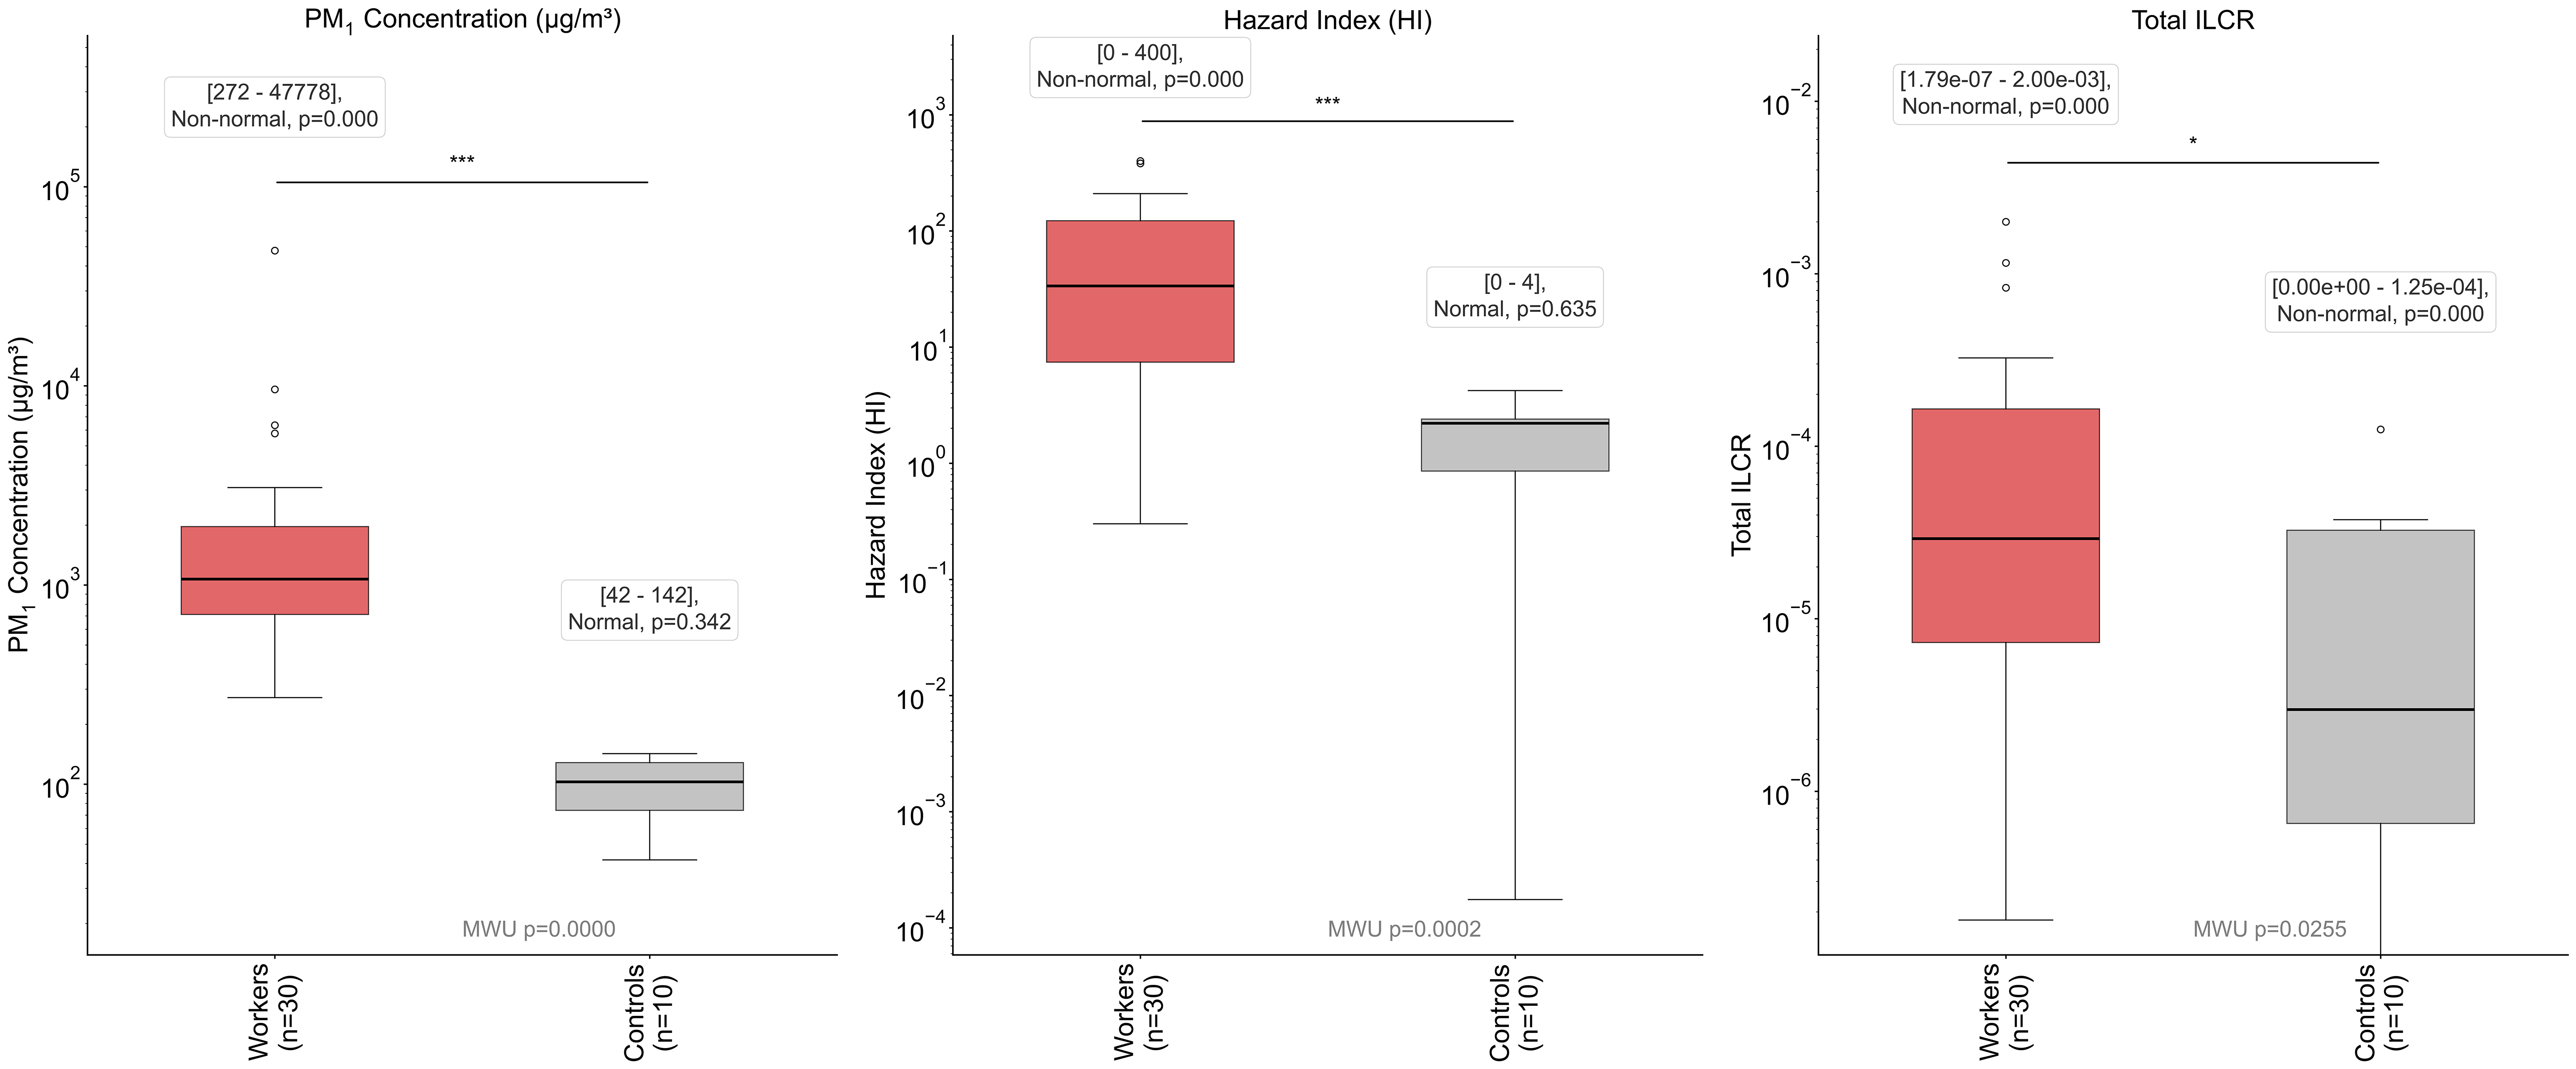
Figure 5. Box plots comparing Workers (n = 30) vs. Controls (n = 10) for total PM, HI, and ILCR_total. *P < 0.05; ***P < 0.001 (Mann-Whitney U, two-sided). PM: Particulate matter; HI: hazard index; ILCR: incremental lifetime cancer risk.
Figure 5. Box plots comparing Workers (n = 30) vs. Controls (n = 10) for total PM, HI, and ILCR_total. *P < 0.05; ***P < 0.001 (Mann-Whitney U, two-sided). PM: Particulate matter; HI: hazard index; ILCR: incremental lifetime cancer risk.


All published articles are preserved here permanently:
https://www.portico.org/publishers/oae/