
fig1
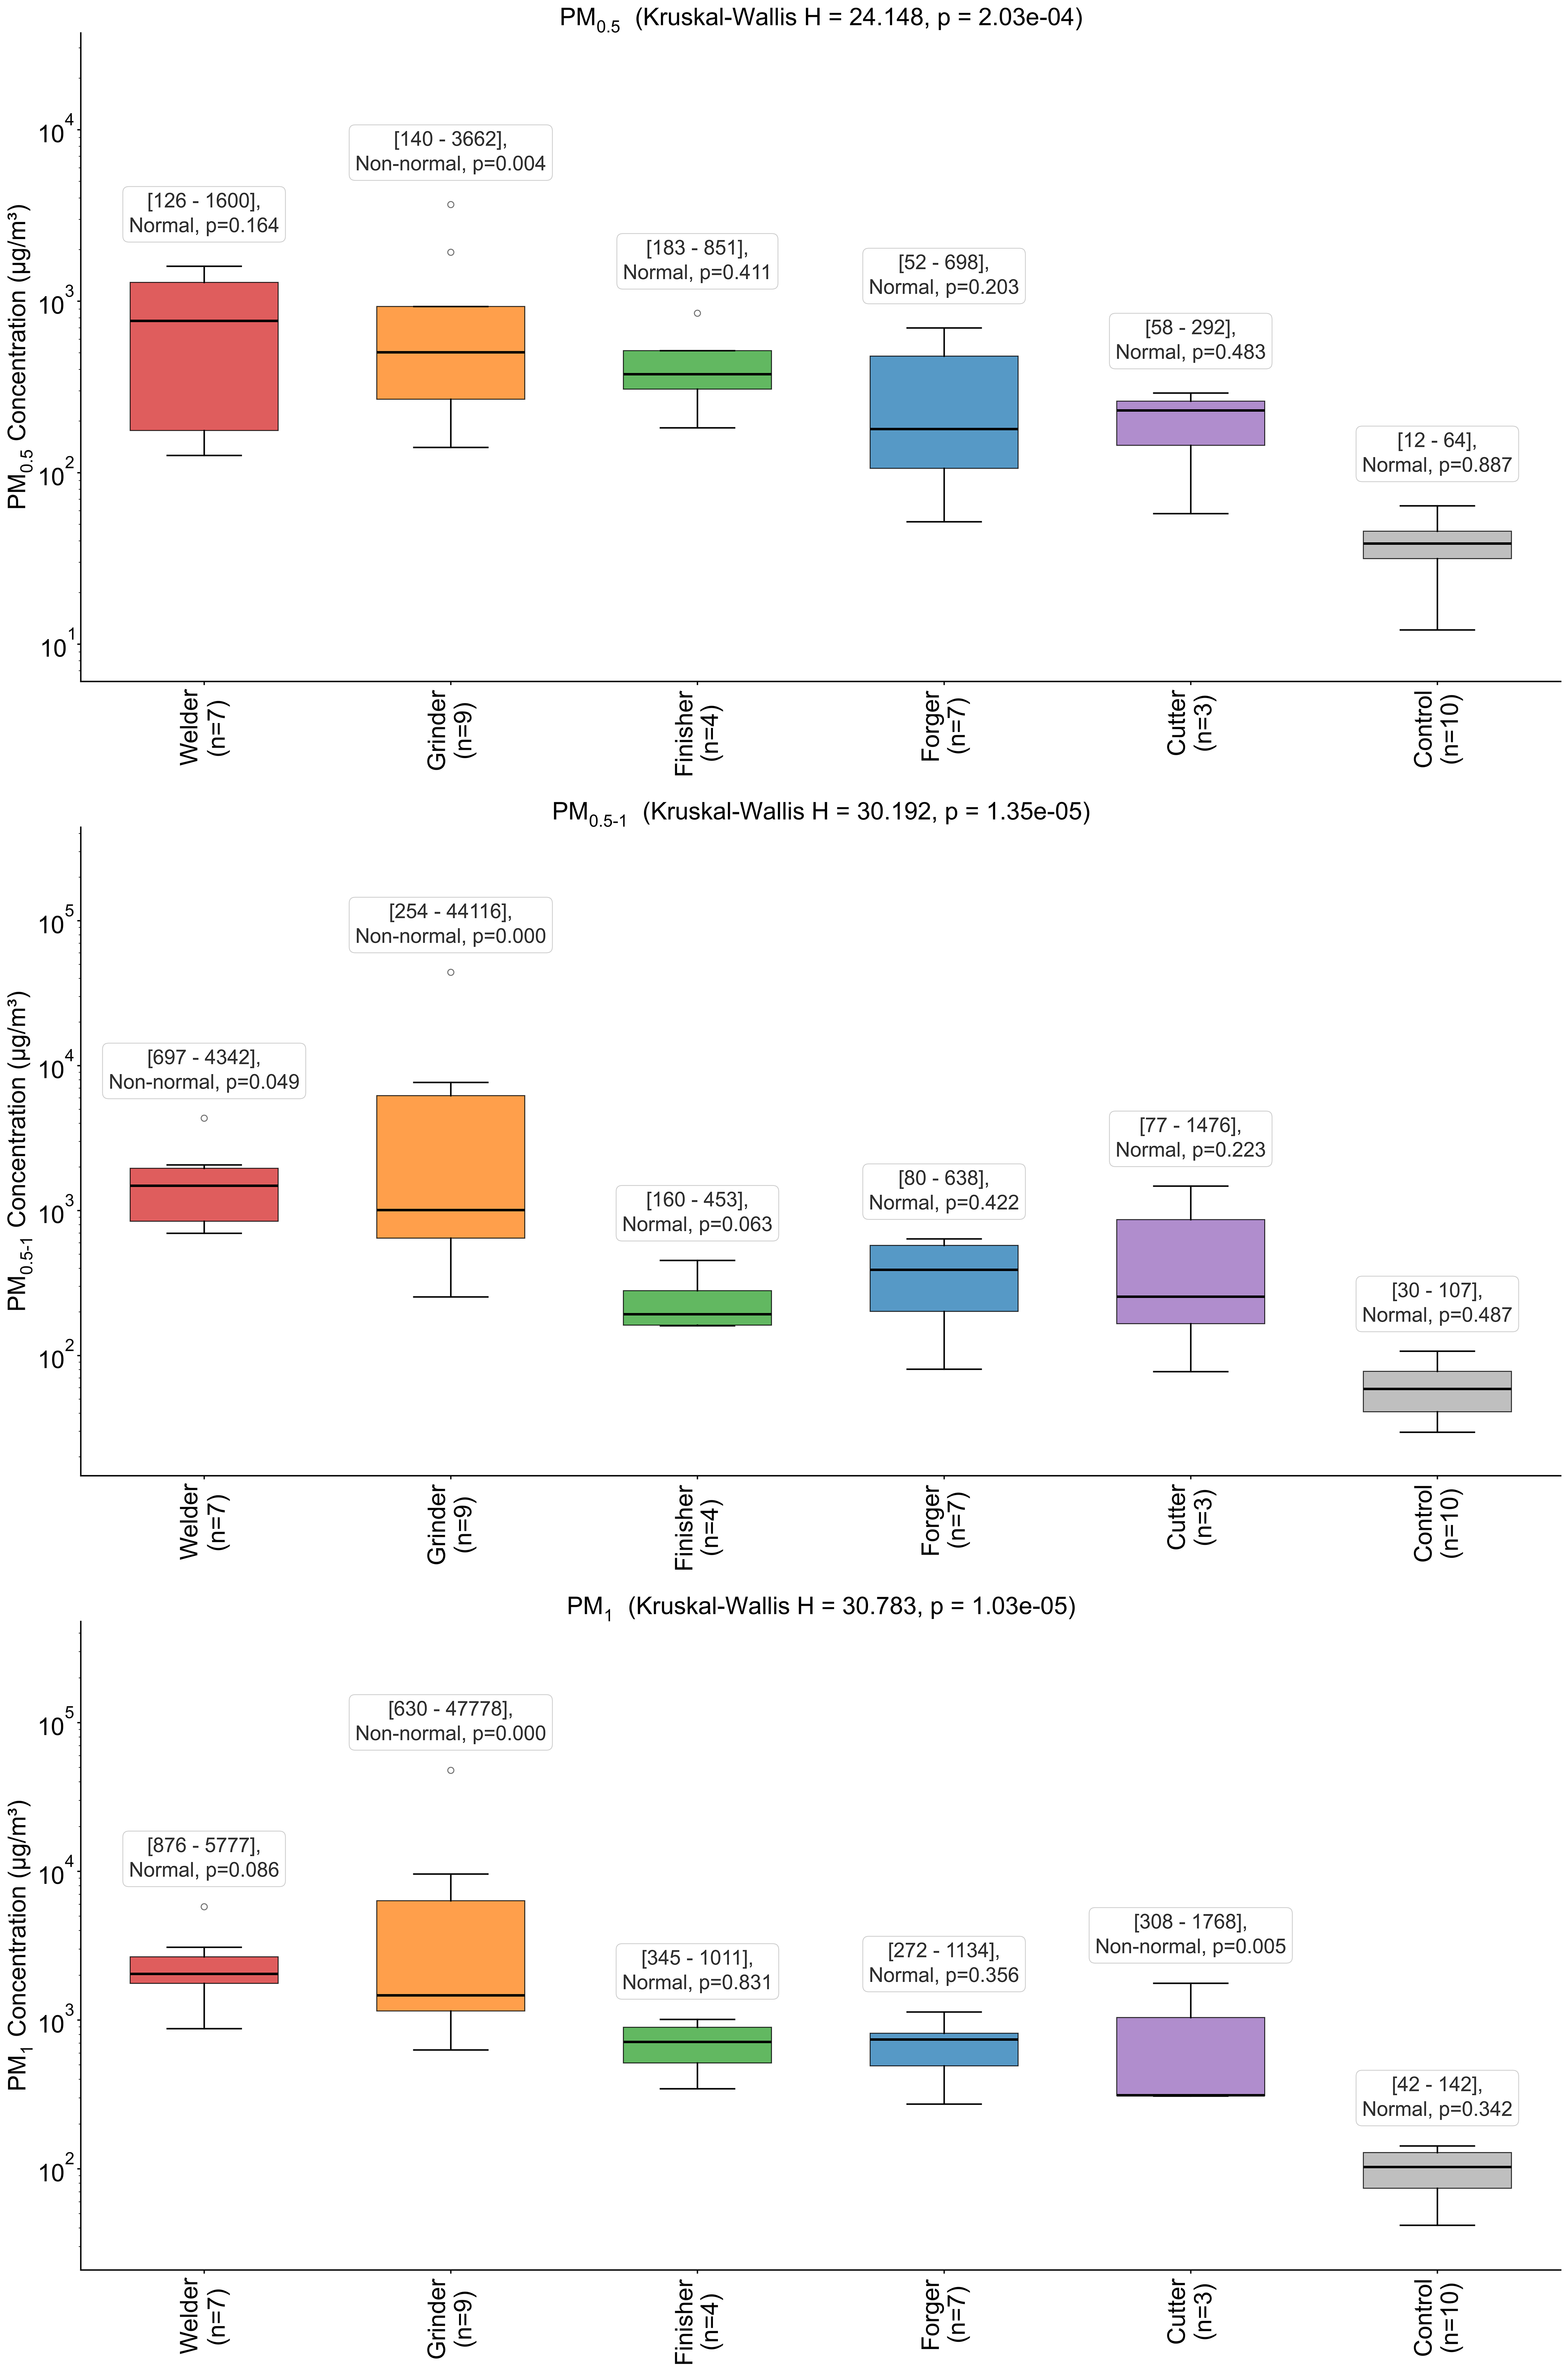
Figure 1. Box plots of PM concentration by occupation and size fraction (log scale). Boxes: 25th-75th percentile; horizontal line: median; whiskers: 1.5× IQR; circles: outliers. PM: Particulate matter; IQR: interquartile range.
Figure 1. Box plots of PM concentration by occupation and size fraction (log scale). Boxes: 25th-75th percentile; horizontal line: median; whiskers: 1.5× IQR; circles: outliers. PM: Particulate matter; IQR: interquartile range.


All published articles are preserved here permanently:
https://www.portico.org/publishers/oae/