
fig3
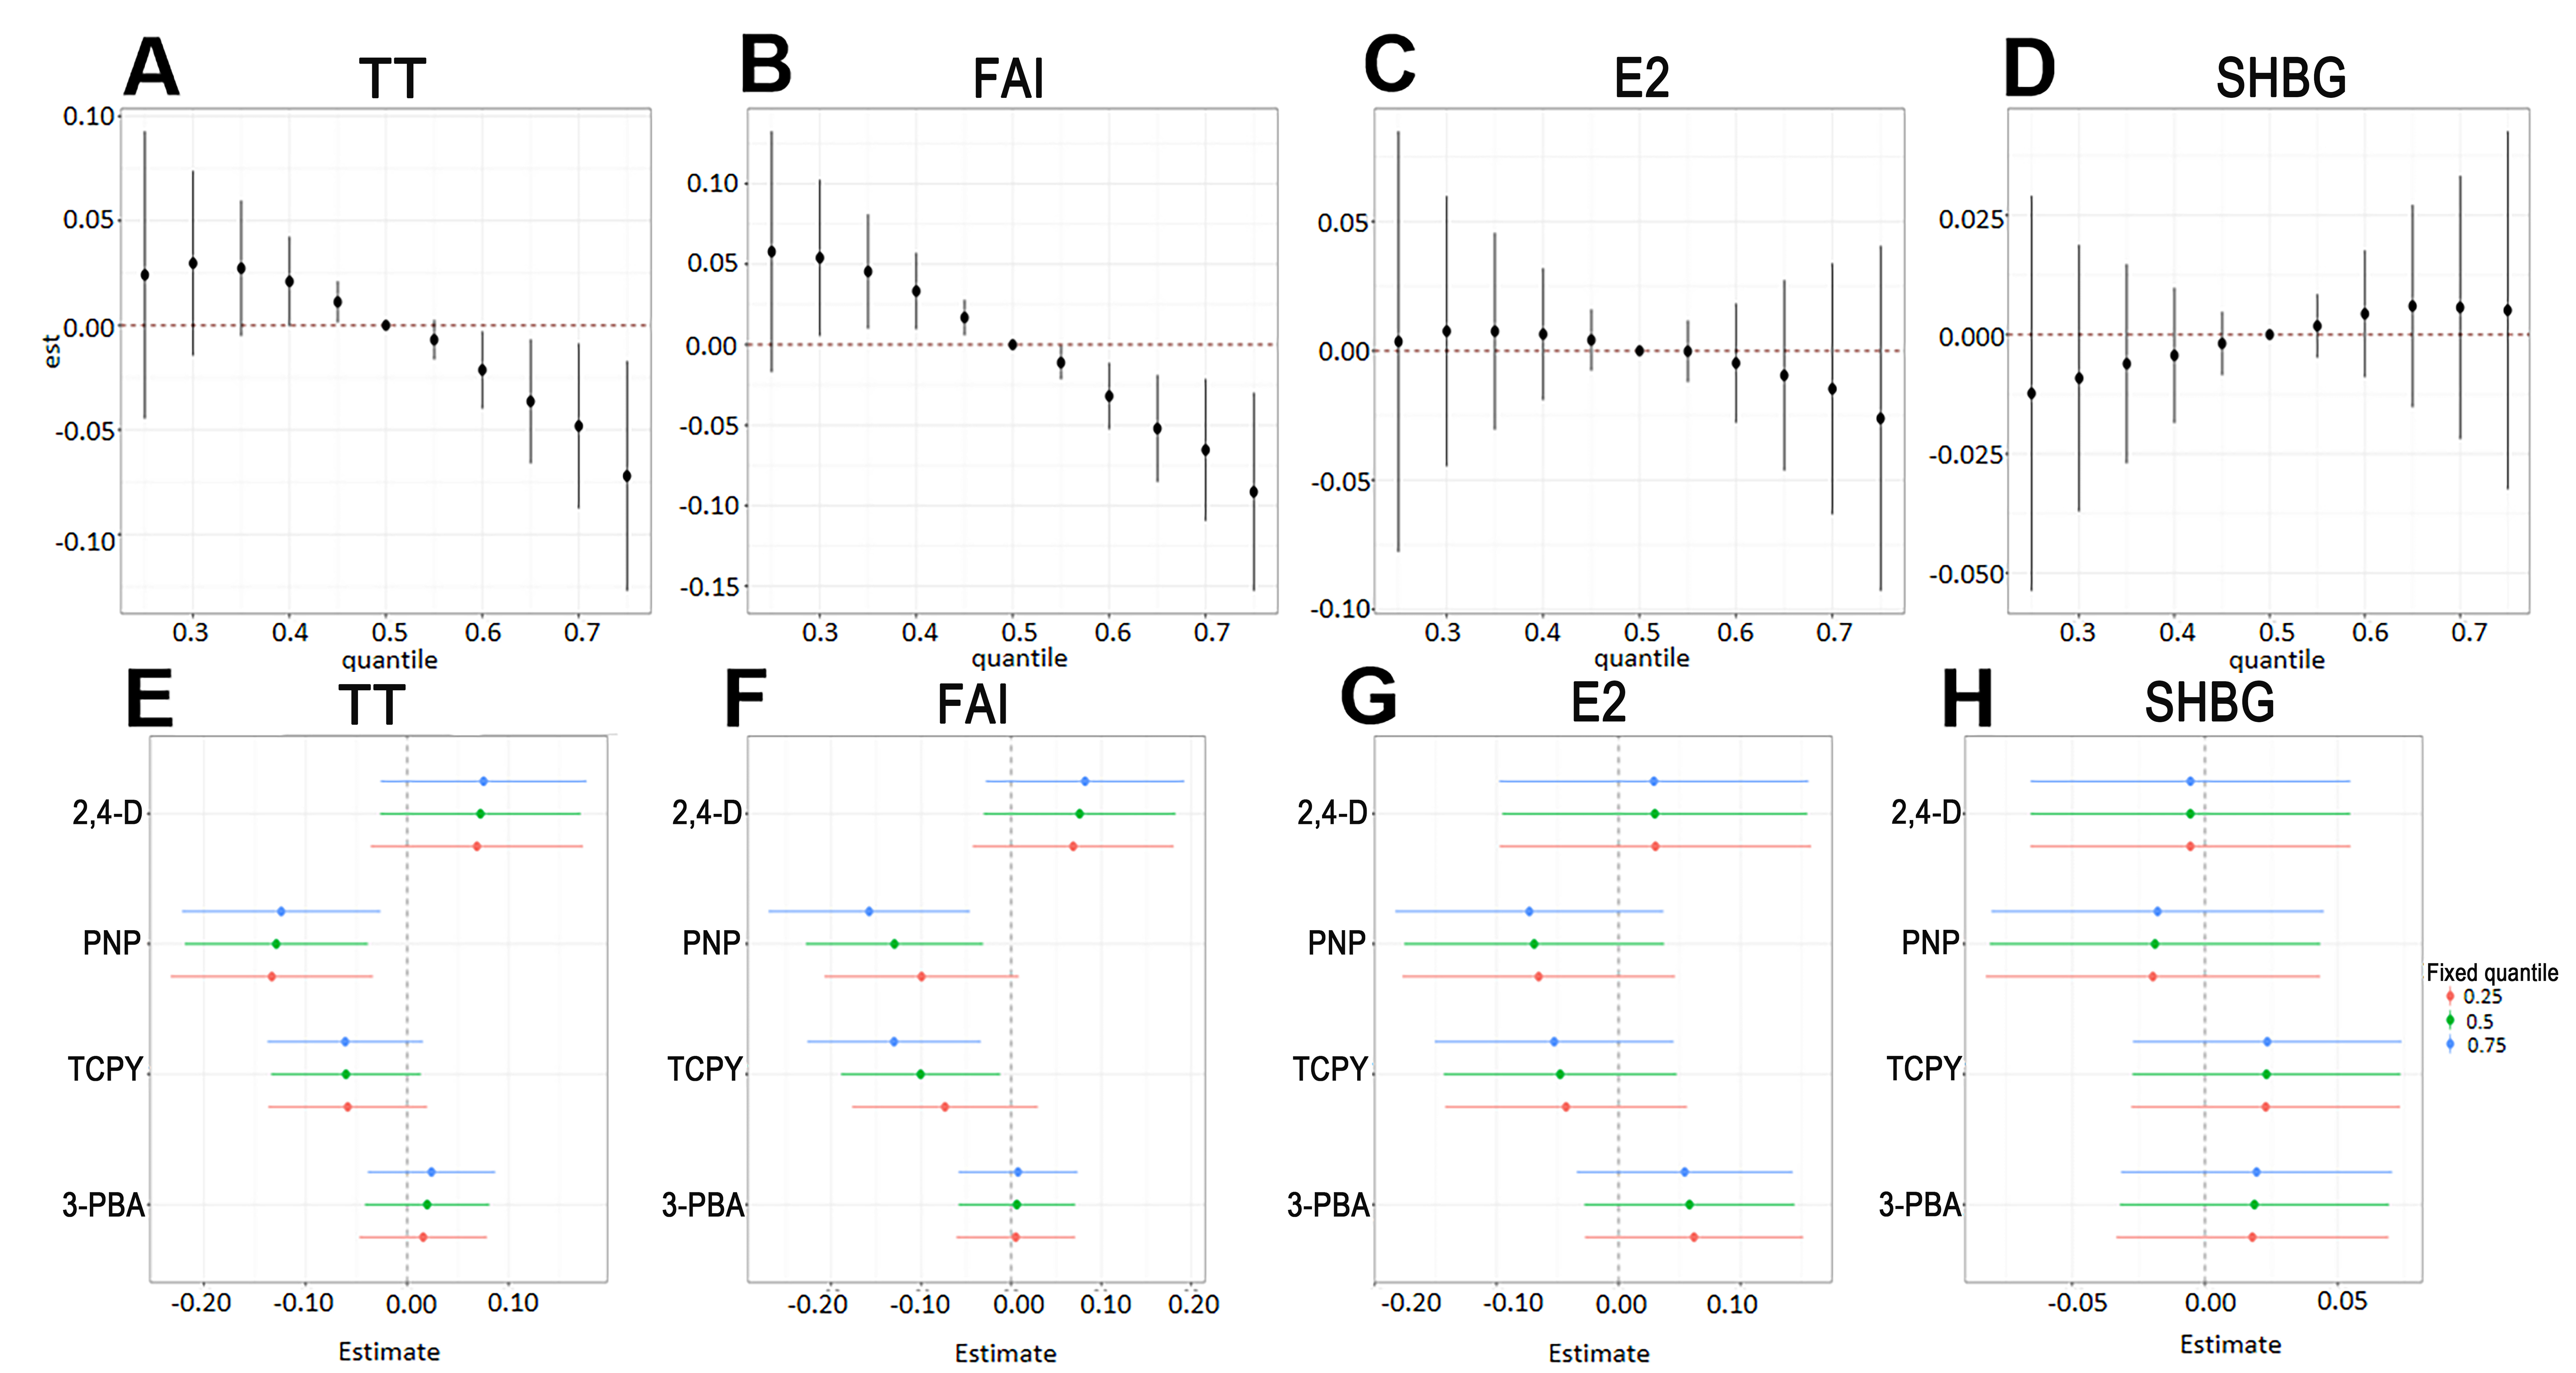
Figure 3. Association analysis between non-persistent pesticide mixtures and sex hormone levels in postmenopausal women based on the BKMR model. (A-D) Overall mixture associations with TT, FAI, E2, and SHBG, respectively. The y-axis represents the estimated overall association when all biomarker concentrations are set at selected percentiles (25th-75th) relative to the 50th percentile; (E-H) Single-biomarker estimates for TT, FAI, E2, and SHBG, respectively, with the other biomarkers fixed at the 25th, 50th, or 75th percentiles. Error bars represent 95% posterior credible intervals. BKMR: Bayesian kernel machine regression; TT: total testosterone; FAI: free androgen index; E2: estradiol; SHBG: sex hormone-binding globulin; 2,4-D: 2,4-dichlorophenoxyacetic acid; PNP: para-nitrophenol; TCPY: 3,5,6-trichloro-2-pyridinol; 3-PBA: 3-phenoxybenzoic acid.