



Exposure and risk assessment of organophosphate flame retardants in Egyptian, Bangladeshi, Thai, Indonesian and South Korean children
 0
0 Abstract
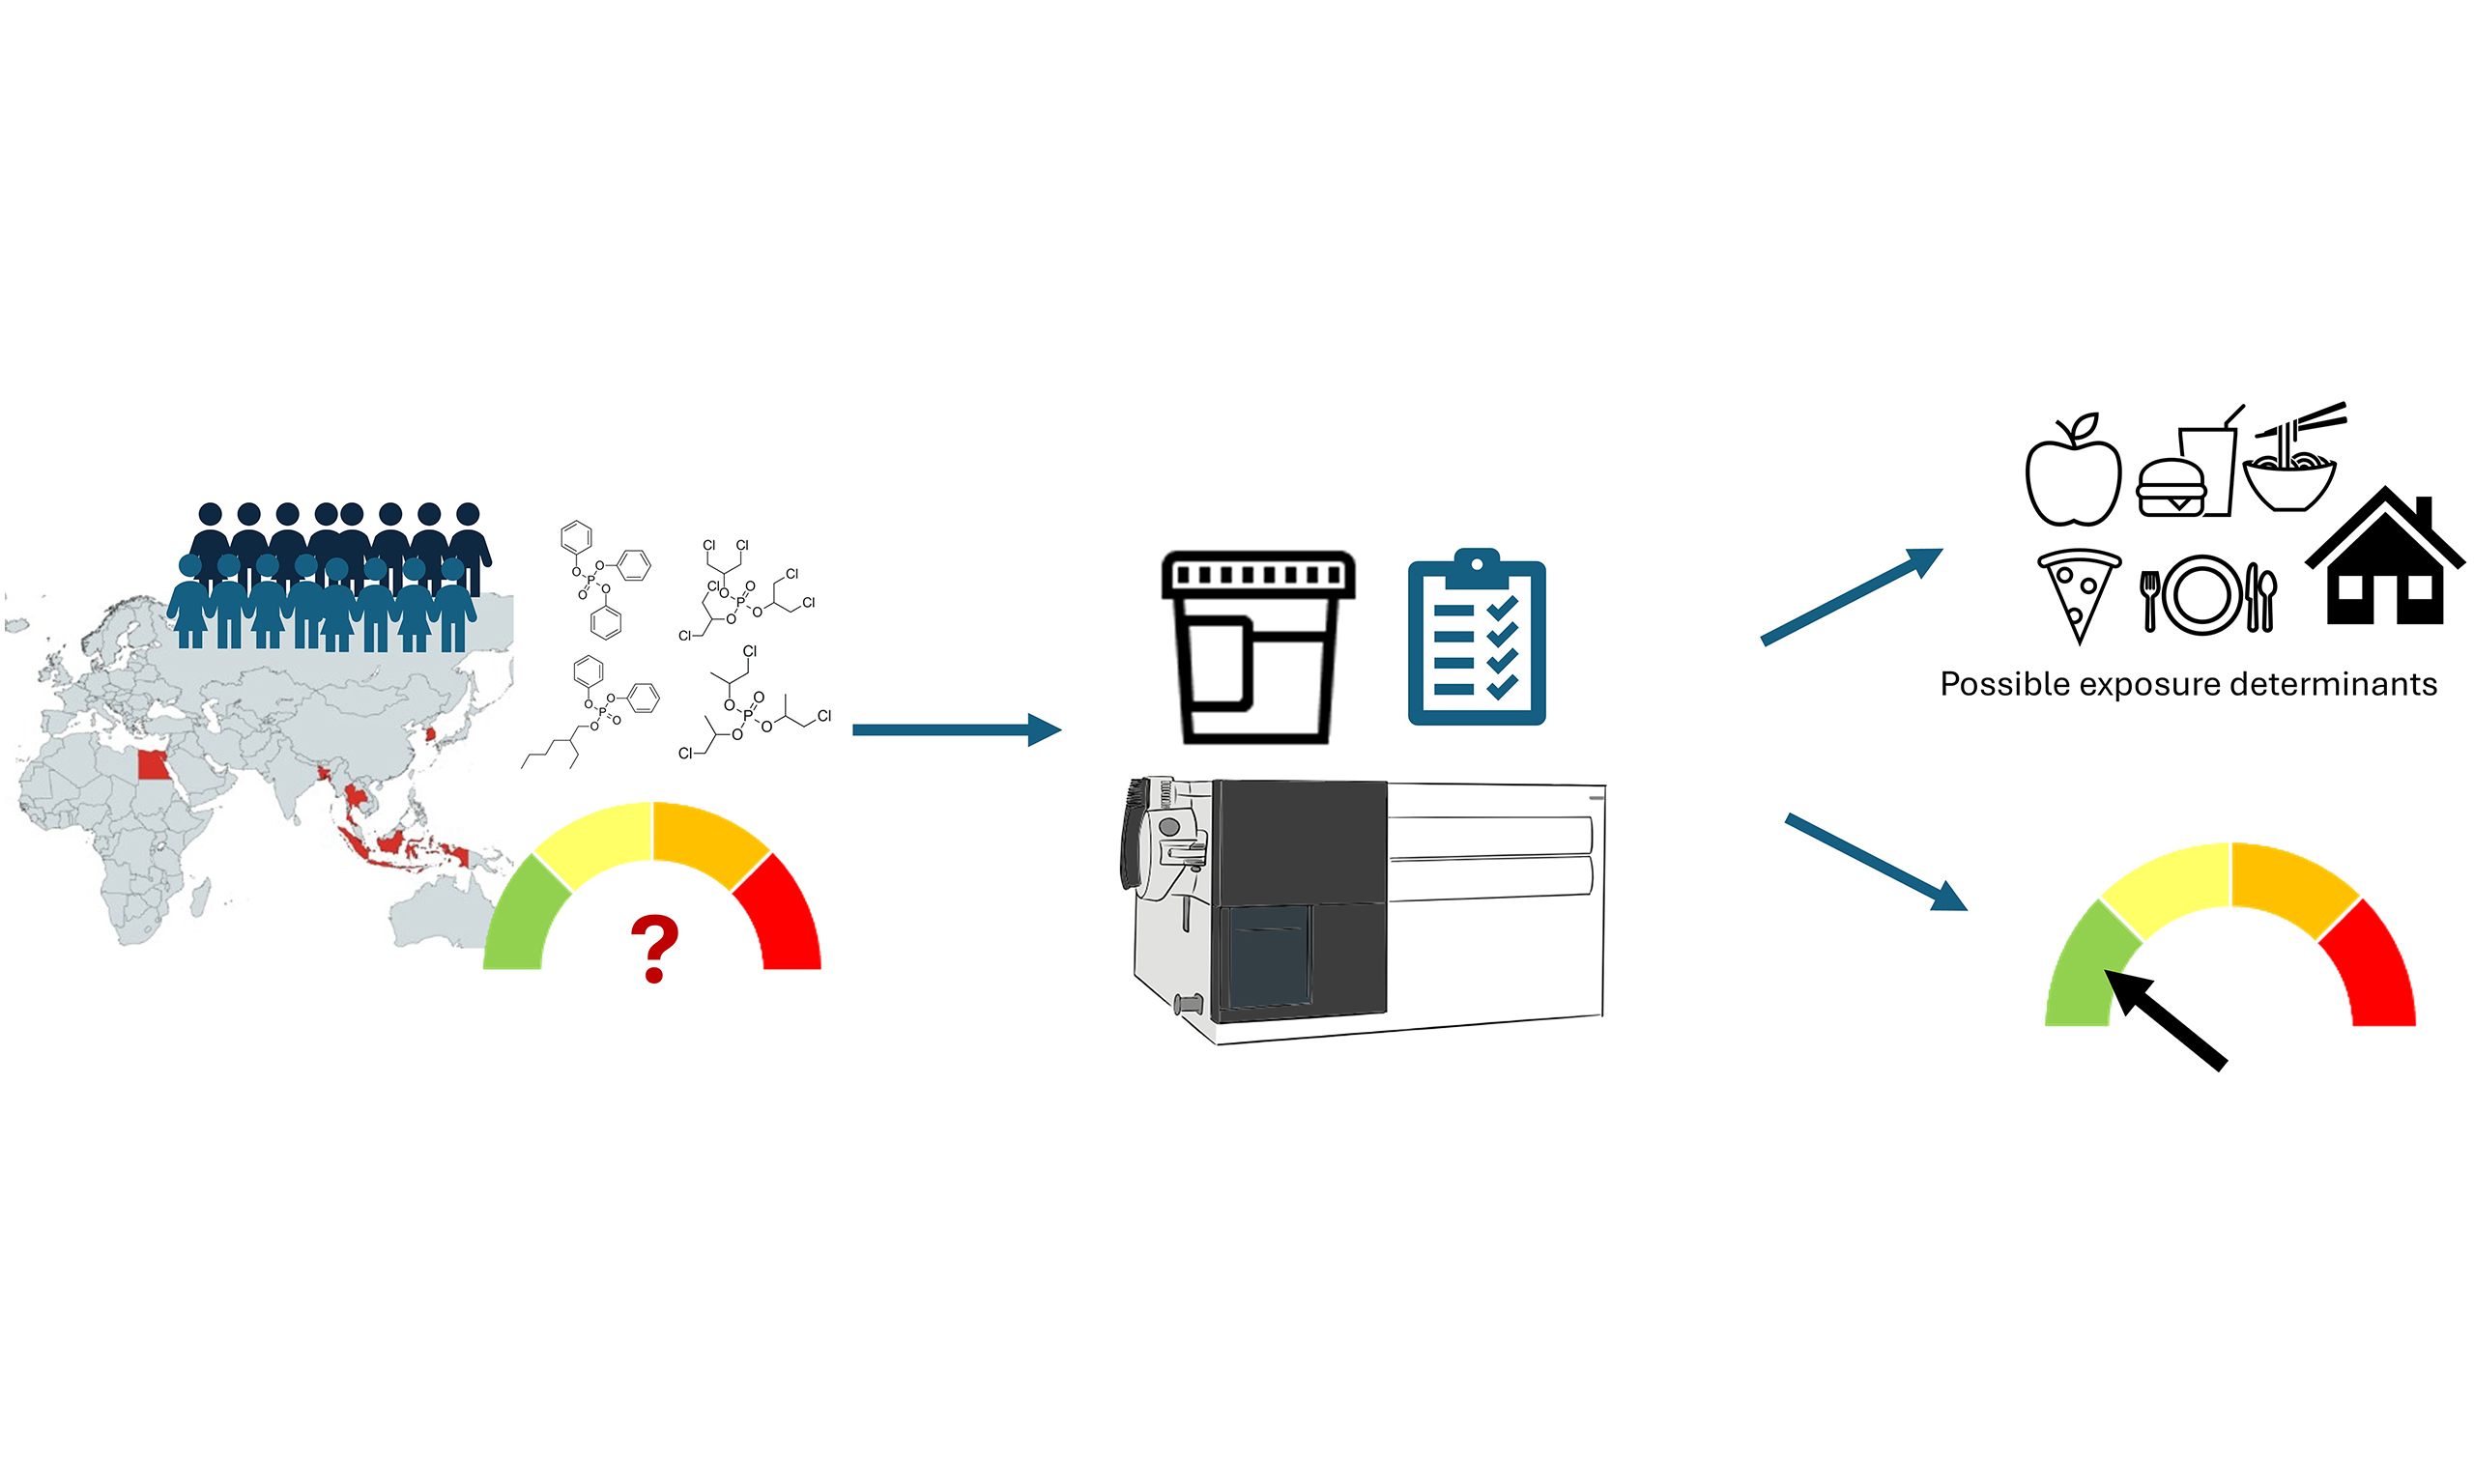
Children are considered a vulnerable subpopulation for exposure to emerging contaminants such as organophosphate flame retardants (PFRs). However, in some countries, only limited data on PFR exposure in children are available. Therefore, this study investigated exposure to 8 PFRs by analysis of urinary levels of 13 PFR metabolites in children (n = 502, 6-14 years) from specific regions in Egypt, Bangladesh, Thailand, Indonesia, and South Korea. Overall, more than half of the children showed exposure to triphenyl phosphate (TPHP), tris (1,3-dichloro-2-propyl) phosphate (TDCIPP), tris (1-chloro-2-propyl) phosphate (TCIPP), and 2-ethylhexyldiphenyl phosphate (EHDPHP), with South Korean children showing the highest urinary levels for diphenyl phosphate (DPHP, 0.78 ng/mL), bis (1,3-dichloro-2-propyl) phosphate (BDCIPP, 0.27 ng/mL), and 1-hydroxy-2-propyl bis (1-chloro-2-propyl) phosphate (BCIPHIPP, 0.74 ng/mL). Children in Bangladesh showed the lowest detection frequencies and urinary metabolite levels for DPHP (0.27 ng/mL), 2-ethylhexyl phenyl phosphate (EHPHP, < LOQ), and 2-ethyl-5-hydroxyhexyl diphenyl phosphate (5-HO-EHDPHP, < LOQ). Exposure patterns differed significantly between countries. Differences in exposure patterns might result from differences in lifestyle habits such as consumption of canned food, canned beverages, and microwaved food, and housing characteristics. In addition, country-specific flame-retardant regulations might also explain differences between countries. Risk assessment showed only one child with a risk characterization ratio and hazard index > 1, indicating that the included population was not at acute risk for adverse effects due to exposure to PFRs.
Keywords
INTRODUCTION
Flame retardants (FRs) are chemicals added to consumer products such as plastics, furniture, and electronic devices to decrease the risk of fire spreading[1]. Since the addition of polybrominated diphenyl ethers (PBDEs) to the Stockholm Convention, the use of organophosphate flame retardants (PFRs) has been increasing[1,2]. Halogenated PFRs, such as tris (1-chloro-2-propyl) phosphate (TCIPP), are widely used in polyurethane foam, while non-halogenated PFRs, such as 2-ethylhexyldiphenyl phosphate (EHDPHP), are also applied as FR plasticizers in e.g. polyvinylchloride[1-3]. Since PFRs are additive compounds not chemically bound to the matrix they are in, they can migrate into their surrounding environment through leaching, volatilization, or abrasion[4,5].
Currently, knowledge on toxicity and adverse health effects related to PFR exposure is limited, despite PFRs being marketed as less toxic substitutes for their brominated counterparts[1,3]. For example, the National Toxicology Program (NTP) of the United States has conducted a chronic toxicity study in mice and rats to evaluate the carcinogenicity of TCIPP and concluded that TCIPP causes carcinogenic effects in female mice[6]. In epidemiological studies in children, exposure to PFRs was reported to be associated with allergic symptoms and reduced cognitive abilities[7-9]. Additionally, concerns were raised by the European Chemicals Agency (ECHA) regarding risks in children of exposure to chlorinated PFRs, while triphenyl phosphate (TPHP, an aryl PFR) was added to the candidate list of substances of very great concern by ECHA[10,11].
The presence of PFRs in different environmental and human matrices, such as water, dust, blood, and urine, has already been demonstrated[12-14]. Pathways of PFR exposure include dietary intake, dust ingestion and inhalation, dermal contact and inhalation[15-18]. Quantification of PFR metabolites in urine is an established way to assess internal exposure to PFRs, as these compounds are assumed to be readily metabolized in the human body and mostly excreted through urine[12,19].
Children are especially vulnerable to exposure to emerging contaminants such as PFRs, as they may experience higher exposure relative to body weight than adults due to a greater intake of air, food and water per kg body weight and frequent hand-to-mouth behavior[20-23]. In addition, the ongoing physiological development of children makes them susceptible to possible adverse health effects[20-23]. Although several human biomonitoring studies have previously reported exposure to PFRs in children using urine measurements of PFR metabolites, these studies have mainly focused on Europe and North America, while in Asian children, only reports from Japan, China, and Taiwan are available[24-29]. In addition, most studies on children have focused on a subset of PFR metabolites, including diphenyl phosphate (DPHP) and bis (1,3-dichloro-2-propyl) phosphate (BDCIPP), with limited information on EHDPHP metabolites.
Therefore, in this study, we used children’s urine samples from the International Biobank for Children (IBC) to investigate exposure to a wide range of PFRs in children in countries with scarce PFR exposure data. IBC is a biospecimen bank of children’s urine samples collected every 3-4 years since 2017 in several countries, mostly without nationwide biomonitoring programs, e.g., Egypt, Bangladesh, Thailand, Indonesia and South Korea[30,31]. In addition to the limited availability of human biomonitoring data, these countries represent different climates, lifestyles, socio-economic characteristics and FR regulation frameworks. These factors may influence PFR exposure, and the inclusion of these different countries allows for a first comparison of exposure levels and potential exposure determinants between understudied regions. The archived urine samples were analyzed for 13 PFR metabolites, and levels were compared with studies conducted in other parts of the world. To identify possible sources of exposure that can contribute to differences in PFR concentrations between countries, questionnaire data were used. Lastly, to assess the risk of adverse health effects resulting from exposure to PFRs, estimated daily intakes (EDIs) were calculated and compared with derived no-effect levels (DNELs).
EXPERIMENTAL
Chemicals and materials
An overview of the targeted compounds is presented in Supplementary Table 1, whereas details on used chemicals and materials for sample extraction and analysis are available in Supplementary Text 1.
Study population
Urine was collected from children aged 6-14 years old between October 2022 and October 2023. Samples were obtained from children in Giza, Egypt (urban area, n = 98), Rajshahi, Bangladesh (urban area, n = 100), Suphan Buri, Thailand (rural area, n = 114), Kendari, Indonesia (urban area, n = 100), and Osan, South Korea (urban area, n = 90). Participants were recruited from elementary schools in each city, except in Rajshahi, where children were recruited through home visits within a selected school district. Parents or guardians of the participating children completed a questionnaire on demographics, socioeconomic status, lifestyle, and the children’s food habits. As participants were recruited from a specific region in each country, the study populations reflect regional cohorts rather than nationally representative samples. For readability, country names are used throughout the manuscript to refer to the sampled region from that country. Participating children and their parents received a polypropylene specimen cup and a polypropylene 50 mL tube. First morning urine was collected in the specimen cup, transferred to the 50 mL tube, and brought to school, where collected urine samples were stored in insulated containers with ice packs until delivery to the laboratory on the same day, when they were stored at -20 or -80 °C. Samples were then transported to Seoul National University, South Korea, where they were stored at -80 °C until aliquoted and shipped to the analyzing laboratory (Toxicological Centre, University of Antwerp, Antwerp, Belgium), where they were stored at -20 °C until sample extraction. Ethical approval for the study was given by the Research Ethics Committees of Soonchunhyang University (202204-BR-058-05), Mahidol University (MUTM 2023-017-01, MUTM 2023-017-02), Indonesian Public Health Association (018/ECHR-IPHA/I/2023), University of Rajshahi [249(35)/320/IAMEBBC/IBSc] and the Research Ethics Committee of Egypt National Research Centre (IRB approval No. 03420223).
Measurement of PFR metabolites in urine
Urine samples were analyzed for levels of PFR metabolites using a previously validated extraction and quantification method[32] with instrument-specific parameters optimized for the Agilent 6495 Triple Quadrupole mass spectrometer [Supplementary Tables 2 and 3]. Briefly, 1 mL of urine was extracted by performing solid phase extraction (SPE) on Bond-Elut C18 cartridges, followed by analysis of the extracts on an Agilent 1290 Infinity liquid chromatography system coupled to a Triple Quadrupole Mass Spectrometer (ESI-6495, Agilent). Further methodological details of the method used can be found in Supplementary Text 2.
QA/QC measures
Quality control (QC) involved extraction and analysis of urine spiked with a PFR metabolite standard mixture (10 ng, Supplementary Table 1), while the same urine was extracted without spiking to enable correction for PFR metabolite levels already present in the urine. In addition, samples provided by the external quality assessment scheme for organic substances (OSEQAS), in which BDCIPP and DPHP are included, were extracted and analyzed. Calculated accuracies for spiked urine samples and OSEQAS samples were generally within the acceptable range of 75%-125% [Supplementary Table 1]. To minimize contamination, glassware was cleaned with acetone and heated at 400 °C before use, with sample extraction being carried out in a precleaned flow cabinet. A procedural blank consisting of Milli-Q water was processed with each analytical batch (n = 21) to establish the background contamination originating from extraction and analytical procedures. Levels found in the procedural blanks were subtracted from those measured in the urine samples. Limits of quantification (LOQs) of the investigated compounds ranged from 0.01 to
Data analysis and statistical analysis
Quantification of targeted compounds was done using Agilent Quantitative Software (version 10.0, Agilent Technologies, Inc., Santa Clara, CA, USA). Measured urine levels of PFR metabolites were corrected for specific gravity (SG) and creatinine content [Supplementary Text 3]. In the main text, SG-corrected values are presented and discussed, as SG is thought to be influenced to a lesser extent[33] by individual characteristics such as gender, age, and body mass index (BMI), with the uncorrected and creatinine-corrected values displayed in the Supplementary Materials.
Statistical analysis was performed for metabolites with an overall detection frequency (DF) > 50% (considering all included children from all countries). Metabolite measurements that were < LOQ were substituted by DF*LOQ[34]. The Shapiro-Wilk test was used to test normality. Due to the non-normal distribution of the PFR levels, a natural log transformation was applied to SG-corrected metabolite concentrations to approximate a normal distribution for subsequent statistical analyses[35]. To compare PFR metabolite levels between countries, a Kruskal-Wallis test with adjusted P-values for pairwise comparison was performed.
Multiple linear regression was employed to evaluate associations between PFR metabolite concentrations and possible determinants of exposure. When only one metabolite for a parent compound was detected in more than 50% of all samples, statistical analysis was performed solely based on that metabolite. For parent compounds with multiple metabolites showing an overall DF > 50%, the molar sum of these metabolites was calculated and used in the regression analysis. Determinants of exposure were investigated using variables from the employed questionnaires, which described demographics, cleaning habits, living characteristics, and food habits [Supplementary Table 4]. As a first step, univariate analyses were applied to evaluate associations between each possible exposure determinant and levels of each PFR metabolite or the sum of metabolites. For categorical variables, Mann-Whitney U and Kruskal-Wallis tests were applied, while continuous variables were assessed using Spearman correlation. For each compound, variables identified in the univariate analysis with a P-value ≤ 0.2 and a clear direction of association were retained as candidate predictor variables for the stepwise multiple linear regression model[12,36]. A backward stepwise selection procedure was subsequently applied, starting by addition of all variables identified as candidate predictor variables in the univariate analyses[12,36,37]. Variables with the highest P-value were excluded one by one, until only variables with P-values ≤ 0.05 were left. Lastly, the education level of the parents can be regarded as a proxy variable for underlying variables that were not included in the employed questionnaire and was therefore evaluated as a variable of specific interest in the regression model[12,36,37]. If the education level was not included in the regression analysis based on univariate analysis, it was added to the final model to assess its contribution to the model[12,36,37]. Age and sex were retained in all models as covariates, since they might be possibly associated with both the variables from the questionnaire and the PFR metabolite levels. Likewise, the SG value was included as a covariate in each model to ensure that estimated associations were independent of the SG[12,38,39]. Age, sex and SG were treated as a priori confounders and always kept in the model regardless of the results of the univariate analyses and the stepwise selection procedure. Collinearity among the variables was evaluated by calculation of the variance inflation factor with a cut-off value of 3. Since metabolite concentrations were natural log-transformed, regression coefficients (B) and their 95% confidence intervals [lower bound (LB) and upper bound (UB)] were back-transformed to their original scale (i.e., eB, eLB, eUB). This allowed eB to be interpreted as multiplicative change associated with a one-unit increase of the independent variable. In this context, eB > 1 corresponds to an increase in metabolite concentrations while eB < 1 corresponds to a decrease. The adjusted R-squared reflects the proportion of variance in metabolite concentrations accounted for by the variables retained in the final model. First, multiple linear regression was performed considering all samples from the 5 participating countries. To further investigate possible exposure sources and differences between countries, multiple linear regression was additionally performed for each country separately. Statistical analyses were done using SPSS version 28.0.1.1 (IBM, Armonk, United States), while figures were prepared using GraphPad Prism 10.0.0 for Windows (GraphPad Software, Boston, Massachusetts, USA).
Risk assessment
Risk assessment was conducted by calculating EDIs for PFRs for which at least one metabolite showed an overall DF > 50%, followed by comparison of EDI values with DNELs. When multiple metabolites from the same parent compound showed an overall DF > 50%, their molar concentrations were summed and used in the EDI calculations. The EDI was calculated according to the following equation[13]:
In this equation, EDI represents the estimated daily intake in ng/kg bw/day, cmeta reflects the SG-corrected metabolite concentration in ng/mL, and Vurine represents the daily urinary output, assumed to be 771 mL for children aged 6-12 years[40]. FUE is the urinary excretion factor, bw is the body weight in kg, while MWp and MWm are the molecular weights of the parent compound and metabolite in g/mol, respectively. EDI calculations and risk assessment were performed for children with available information on body weight (n = 462). Due to limited human toxicokinetic data for PFRs, FUE values from in vitro studies were used [Supplementary Table 5]. Used DNELs were retrieved from the ECHA Chem database[41]. For compounds with no DNEL in the ECHA Chem database, the DNEL was taken from the US EPA CompTox database[42] [Supplementary Table 5]. The risk characterization ratio (RCR) for each PFR was obtained by dividing the EDI by the DNEL. An RCR below 1 indicates no expected risk under the assessed exposure conditions, while an RCR above 1 suggests a potential risk for adverse effects of that compound[43]. In addition, a cumulative hazard index (HI) for PFRs for each individual was calculated as the sum of the RCRs of all included parent compounds[44].
RESULTS AND DISCUSSION
Study populations
The study population consisted of 502 children [Table 1]. The median overall age at sample collection was 9.9 years [interquartile range (IQR): 9.0-11.3], with the lowest median age of sample collection in South Korea (8.8 years old) and the highest median age of sample collection in Indonesia (11.8 years). The population consisted of 49.8% boys and 50.2% girls. Half of the participants had parents with an undergraduate degree or higher. Across countries, levels of maternal and paternal education varied substantially. In Indonesia, most parents had a degree below high school, while in South Korea, most parents had an undergraduate degree or higher.
Participant characteristics of children included for analysis of PFR metabolites in urine displayed for all countries together and for each country separately
| All countries | Egypt | Bangladesh | Thailand | Indonesia | South Korea | |||||||
| Sampling year (2022-2023) | 2023 | 2023 | 2023 | 2023 | 2022 | |||||||
| n (%) | Median (IQR) | n (%) | Median (IQR) | n (%) | Median (IQR) | n (%) | Median (IQR) | n (%) | Median (IQR) | n (%) | Median (IQR) | |
| n | 502 | 98 | 100 | 114 | 100 | 90 | ||||||
| Age (years) | 449 | 9.9 (9.0-11.3) | 84 | 9.7 (8.9-10.0) | 85 | 9.2 (9.0-9.5) | 102 | 10.8 (9.7-11.5) | 90 | 11.8 (11.7-12.1) | 88 | 8.8 (8.5-9.2) |
| Sex Boy Girl | 237 (49.8) 239 (50.2) | 43 (48.9) 45 (51.1) | 51 (51) 49 (49) | 53 (49.5) 54 (50.5) | 41 (44.6) 51 (55.4) | 49 (55.1) 40 (44.9) | ||||||
| Height (cm) | 462 | 138.3 (132.0-145.0) | 75 | 134.8 (130.0-140.8) | 100 | 136.3 (131.1-141.0) | 108 | 141.5 (134.1-151.3) | 92 | 146.0 (140.0-151.2) | 87 | 133.1 (128.8-138.3) |
| Body weight (kg) | 462 | 33.6 (28.1-42.2) | 75 | 32.0 (28.2-39.0) | 100 | 29.8 (25.5-38.8) | 108 | 39.5 (29.1-39.5) | 92 | 37.8 (32.6-47.5) | 87 | 31.4 (26.7-39.0) |
| BMI | 462 | 17.3 (15.4-21.0) | 75 | 17.2 (15.2-20.8) | 100 | 16.2 (14.7-19.3) | 108 | 18.5 (16.0-24.4) | 92 | 17.9 (15.7-21.5) | 87 | 17.5 (15.7-20.5) |
| Maternal education Below high school High school diploma Undergraduate degree Graduate degree or higher | 125 (29.0) 82 (19.0) 165 (38.3) 59 (13.7) | 4 (6.3) 19 (30.2) 38 (60.3) 2 (3.2) | 35 (36.1) 3 (3.1) 15 (15.5) 44 (45.4) | 39 (43.3) 32 (35.6) 16 (17.8) 3 (3.3) | 47 (51.1) 9 (9.8) 34 (37.0) 2 (2.2) | 19 (21.3) 62 (69.7) 8 (9.0) | ||||||
| Paternal education Below high school High school diploma Undergraduate degree Graduate degree or higher | 148 (34.7) 72 (16.9) 141 (33.1) 65 (15.3) | 7 (10.9) 15 (23.4) 38 (59.4) 4 (6.3) | 50 (51.5) 1 (1.0) 16 (16.5) 30 (30.9) | 38 (45.2) 39 (46.4) 6 (7.1) 1 (1.2) | 52 (56.5) 4 (4.3) 25 (27.2) 11 (12.0) | 1 (1.1) 13 (14.6) 56 (62.9) 19 (21.3) | ||||||
Urinary levels of PFR metabolites
Among all samples from the five different countries, DPHP, BDCIPP, 1-hydroxy-2-propyl bis (1-chloro-2-propyl) phosphate (BCIPHIPP), 2-ethylhexyl phenyl phosphate (EHPHP) and 2-ethyl-5-hydroxyhexyl diphenyl phosphate (5-HO-EHDPHP) were detected in > 50% of samples [Supplementary Tables 6-8]. For other metabolites, DFs varied across countries. 4-Hydroxyphenyl phosphate (4-HO-DPHP) and tris (chloroethyl) phosphate (TCEP) showed DFs of > 50% in South Korean samples, and similar DFs were observed for 4-HO-DPHP and hydroxyphenyl diphenyl phosphate (HO-TPHP) in Egyptian samples [Table 2, Supplementary Tables 9 and 10]. In other countries, these compounds were detected in < 50% of the samples.
Detection frequencies and descriptive statistics of PFR metabolites [geometric mean, median (IQR) and 95th percentile in ng/mL, SG corrected] in children from 5 different countries, displayed for each country
| Egypt | Bangladesh | Thailand | Indonesia | South Korea | |||||||||||||||||
| Parent compound | Metabolite | DF (%) | GM | median (IQR) | 95th | DF (%) | GM | median (IQR) | 95th | DF (%) | GM | median (IQR) | 95th | DF (%) | GM | median (IQR) | 95th | DF (%) | GM | median (IQR) | 95th |
| TCIPP | BCIPP | 2 | < LOQ | < LOQ | 1 | < LOQ | < LOQ | 2 | < LOQ | < LOQ | 1 | < LOQ | < LOQ | 7 | < LOQ | 0.71 | |||||
| BCIPHIPP | 82 | 0.12 | 0.11 (0.06-0.24) | 0.46 | 79 | 0.14 | 0.13 (0.08-0.24) | 0.49 | 92 | 0.29 | 0.22 (0.11-0.56) | 2.16 | 96 | 0.50 | 0.48 (0.25-0.82) | 2.44 | 100 | 0.92 | 0.74 (0.59-1.24) | 5.14 | |
| TPHP | 4-HO-DPHP | 74 | 1.11 | 1.18 (< LOQ-2.26) | 9.56 | 41 | < LOQ (< LOQ-0.92) | 2.02 | 42 | < LOQ (< LOQ-0.87) | 2.12 | 19 | < LOQ | 1.07 | 64 | 0.84 | 1.01 (< LOQ-2.30) | 15.42 | |||
| DPHP | 99 | 0.61 | 0.61 (0.40-0.84) | 1.77 | 71 | 0.31 | 0.27 (< LOQ-0.54) | 1.2 | 95 | 0.53 | 0.52 (0.32-0.84) | 1.57 | 87 | 0.37 | 0.34 (0.22-0.60) | 1.44 | 98 | 0.92 | 0.78 (0.53-1.67) | 4.89 | |
| HO-TPHP | 65 | 0.01 | 0.01 (< LOQ-0.02) | 0.04 | 17 | < LOQ (< LOQ-0.01) | 0.05 | 26 | < LOQ | 0.03 | 15 | < LOQ | 0.03 | 21 | < LOQ | 0.02 | |||||
| TDCIPP | BDCIPP | 86 | 0.13 | 0.12 (0.08-0.18) | 0.48 | 91 | 0.19 | 0.16 (0.11-0.25) | 0.62 | 94 | 0.18 | 0.18 (0.12-0.24) | 0.81 | 80 | 0.11 | 0.11 (0.08-0.16) | 0.3 | 99 | 0.25 | 0.27 (0.19-0.36) | 0.55 |
| EHDPHP | EHPHP | 75 | 0.05 | 0.05 (< LOQ-0.08) | 0.14 | 22 | < LOQ | 0.24 | 55 | 0.05 | 0.05 (< LOQ-0.08) | 0.16 | 52 | 0.05 | 0.05 (< LOQ-0.07) | 0.17 | 76 | 0.06 | 0.05 (0.03-0.09) | 0.25 | |
| 5-HO-EHDPHP | 90 | 0.04 | 0.03 (0.02-0.05) | 0.16 | 29 | < LOQ (< LOQ-0.02) | 0.03 | 91 | 0.04 | 0.04 (0.02-0.06) | 0.11 | 74 | 0.02 | 0.02 (< LOQ-0.03) | 0.09 | 94 | 0.03 | 0.03 (0.02-0.05) | 0.14 | ||
| TBOEP | BBOEP | 0 | < LOQ | < LOQ | 14 | < LOQ | 0.09 | 2 | < LOQ | < LOQ | 2 | < LOQ | < LOQ | 2 | < LOQ | < LOQ | |||||
| TBOEP-OH | 0 | < LOQ | < LOQ | 0 | < LOQ | < LOQ | 15 | < LOQ | 0.6 | 0 | < LOQ | < LOQ | 2 | < LOQ | < LOQ | ||||||
| TNBP | DNBP | 11 | < LOQ | 0.19 | 38 | < LOQ (< LOQ-0.26) | 0.43 | 19 | < LOQ | 0.21 | 14 | < LOQ | 0.48 | 24 | < LOQ | 0.43 | |||||
| TEHP | BEHP | 0 | < LOQ | < LOQ | 1 | < LOQ | < LOQ | 1 | < LOQ | < LOQ | 2 | < LOQ | < LOQ | 3 | < LOQ | < LOQ | |||||
| TCEP | TCEP | 5 | < LOQ | 0.03 | 2 | < LOQ | < LOQ | 17 | < LOQ | 0.14 | 9 | < LOQ | 0.08 | 54 | 0.03 | 0.04 (< LOQ-0.09) | 0.16 | ||||
Including samples from all countries, DPHP showed the highest median concentration (0.49 ng/mL), followed by BCIPHIPP (0.26 ng/mL) and BDCIPP (0.15 ng/mL) [Supplementary Tables 6-8 and Supplementary Figure 1]. From the included countries, the highest median concentrations for DPHP (0.78 ng/mL), BDCIPP (0.27 ng/mL) and BCIPHIPP (0.74 ng/mL) were detected in South Korea, while for 5-HO-EHDPHP the highest median level was found in Thailand (0.04 ng/mL) and EHPHP showed similar concentrations in Egypt, Thailand, Indonesia and South Korea (0.05 ng/mL) [Figures 1 and 2, Table 2, Supplementary Tables 9 and 10]. In Bangladesh, lower DFs and PFR metabolite concentrations were observed compared to the other included countries, with DFs < 50% for EHPHP and 5-HO-EHDPHP [Figures 1 and 2, Table 2, Supplementary Tables 9 and 10].
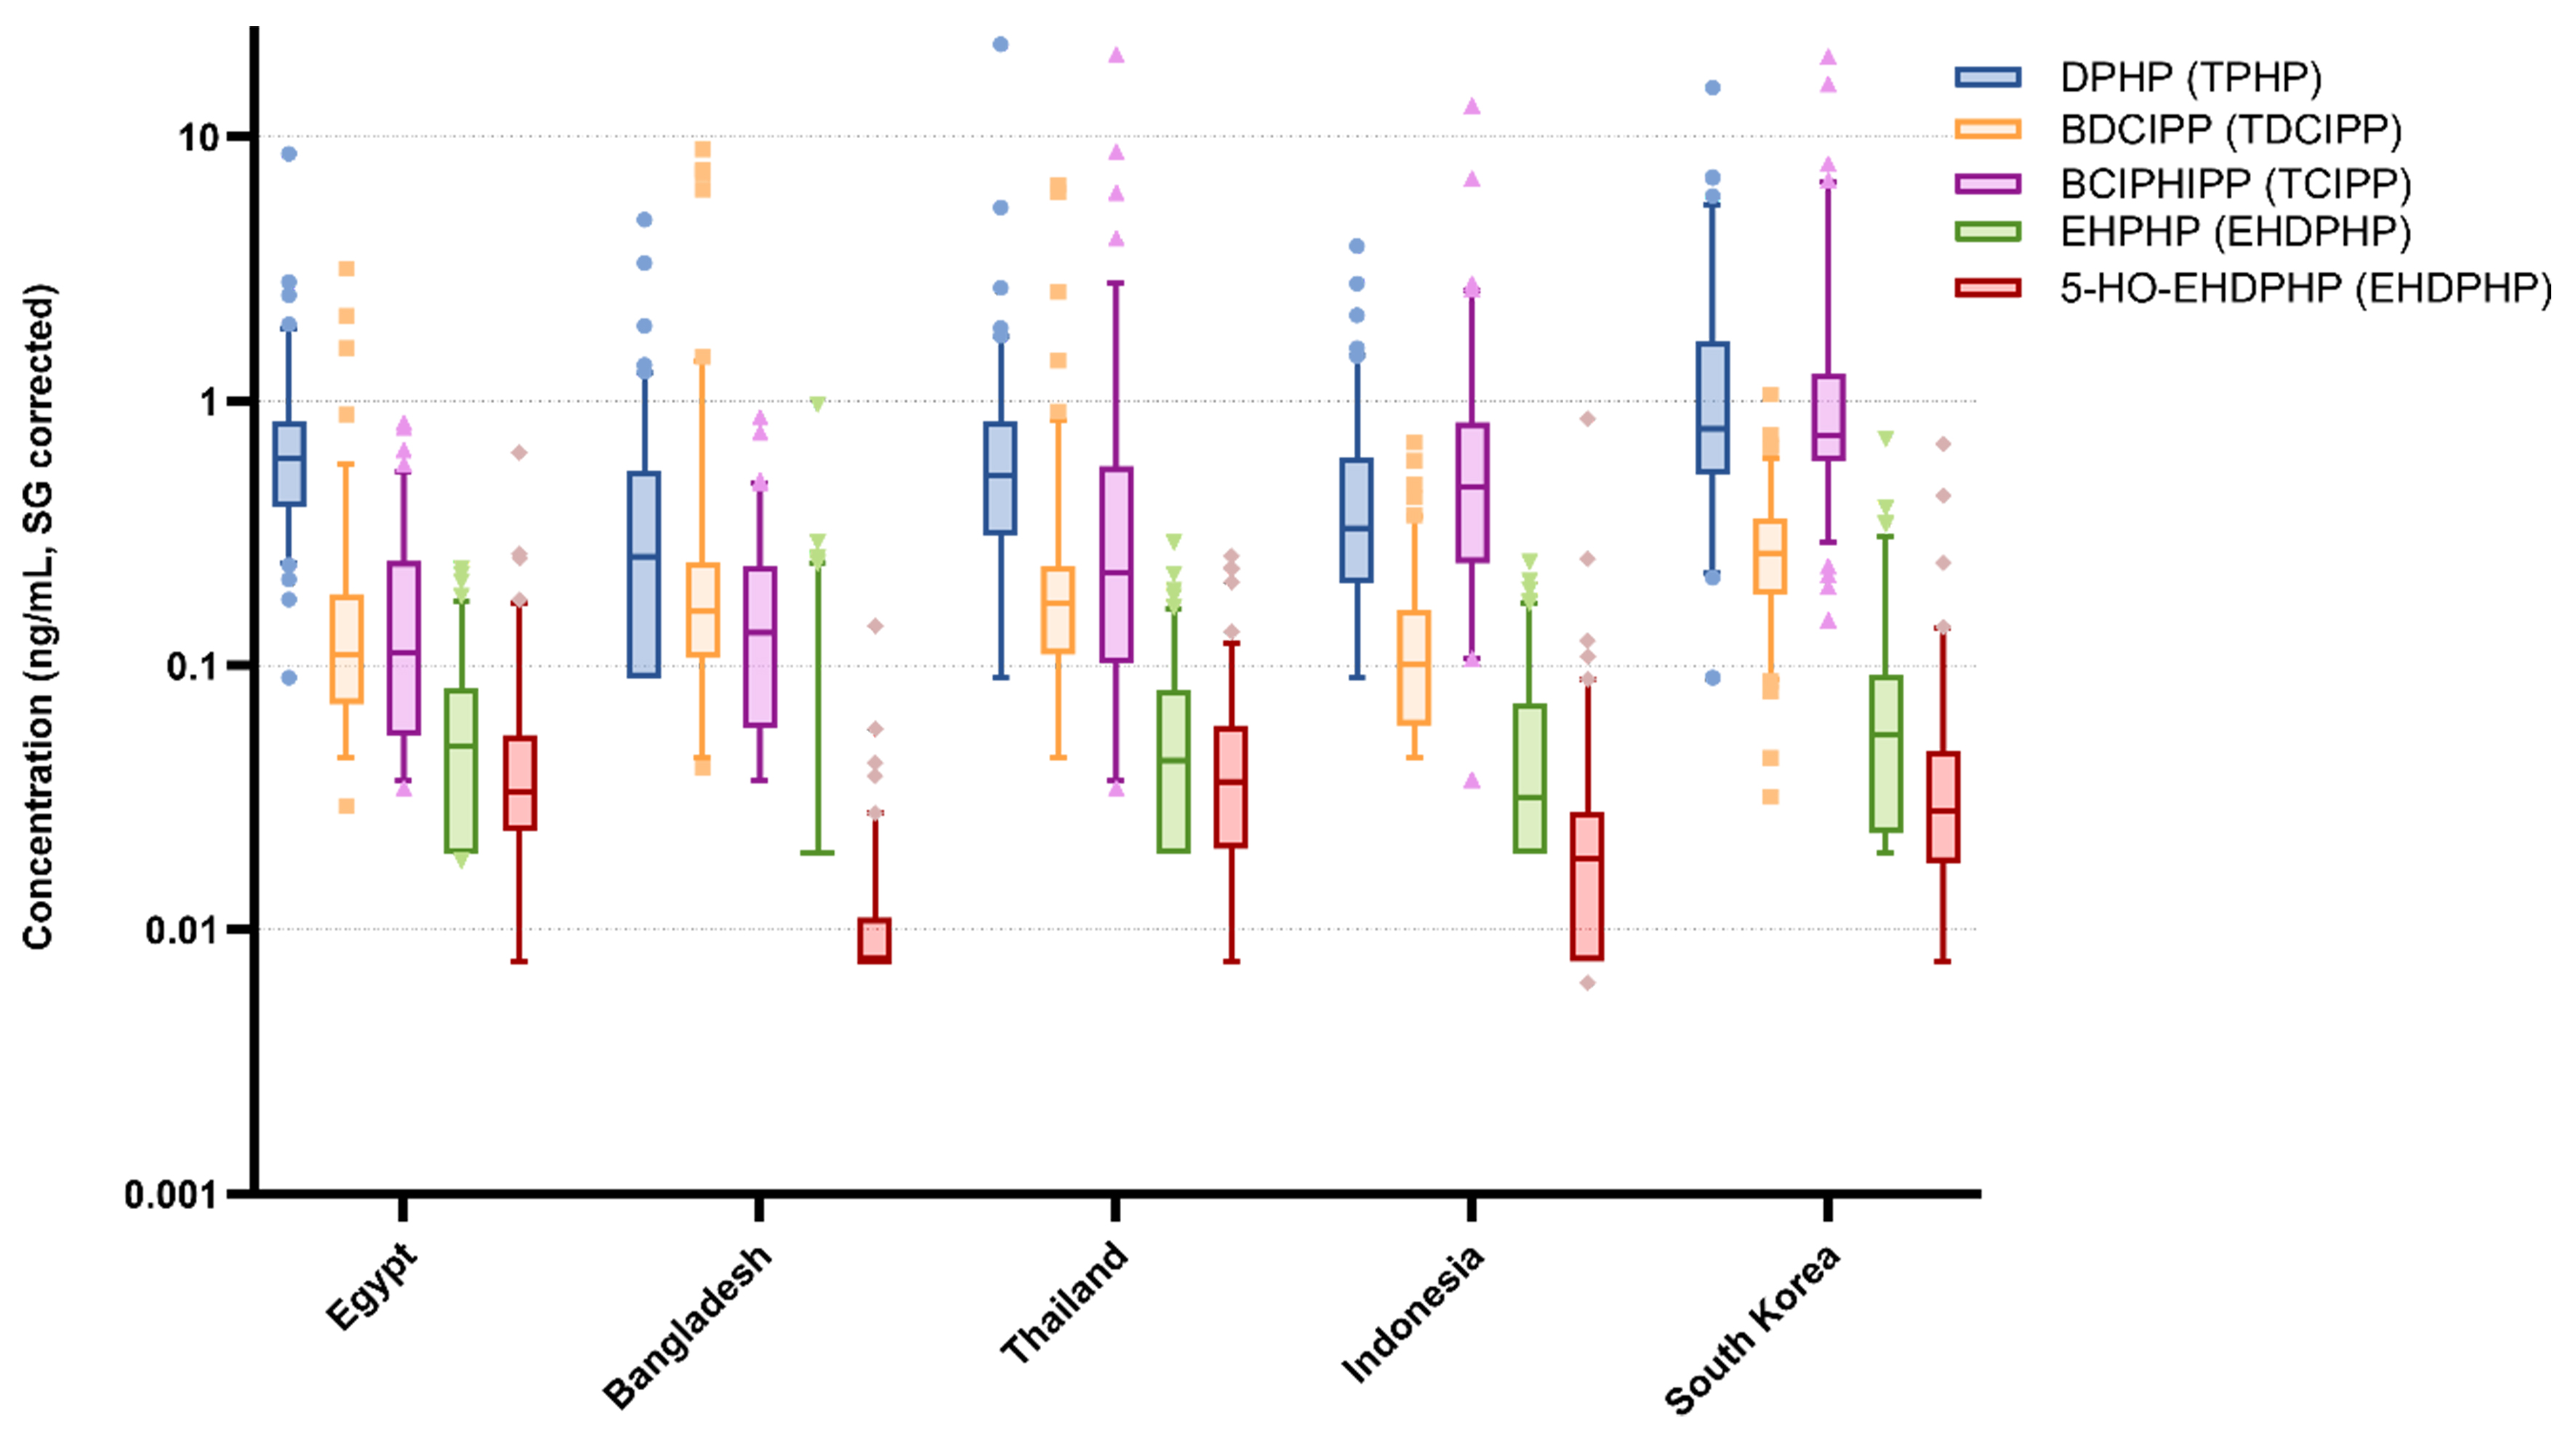
Figure 1. Median concentrations of PFR metabolites displayed per country (ng/mL, SG-corrected). Metabolites detected in more than 50% of urine samples across all 5 countries are shown, with the parent compound in brackets. The y-axis is shown on a logarithmic scale. The box represents the median and IQR, with the whiskers representing the 5th and 95th percentiles. Data points outside the 5%-95% range are plotted as individual points. Metabolite concentrations arranged per metabolite rather than per country to show differences across countries for each metabolite are displayed in Figure 2. PFR: Organophosphate flame retardant; SG: specific gravity; IQR: interquartile range; DPHP: diphenyl phosphate; TPHP: triphenyl phosphate; BDCIPP: bis (1,3-dichloro-2-propyl) phosphate; TDCIPP: tris (1,3-dichloro-2-propyl) phosphate; BCIPHIPP: 1-hydroxy-2-propyl bis (1-chloro-2-propyl) phosphate; TCIPP: tris (1-chloro-2-propyl) phosphate; EHPHP: 2-ethylhexyl phenyl phosphate; EHDPHP: 2-ethylhexyldiphenyl phosphate; 5-HO-EHDPHP: 2-ethyl-5-hydroxyhexyl diphenyl phosphate.
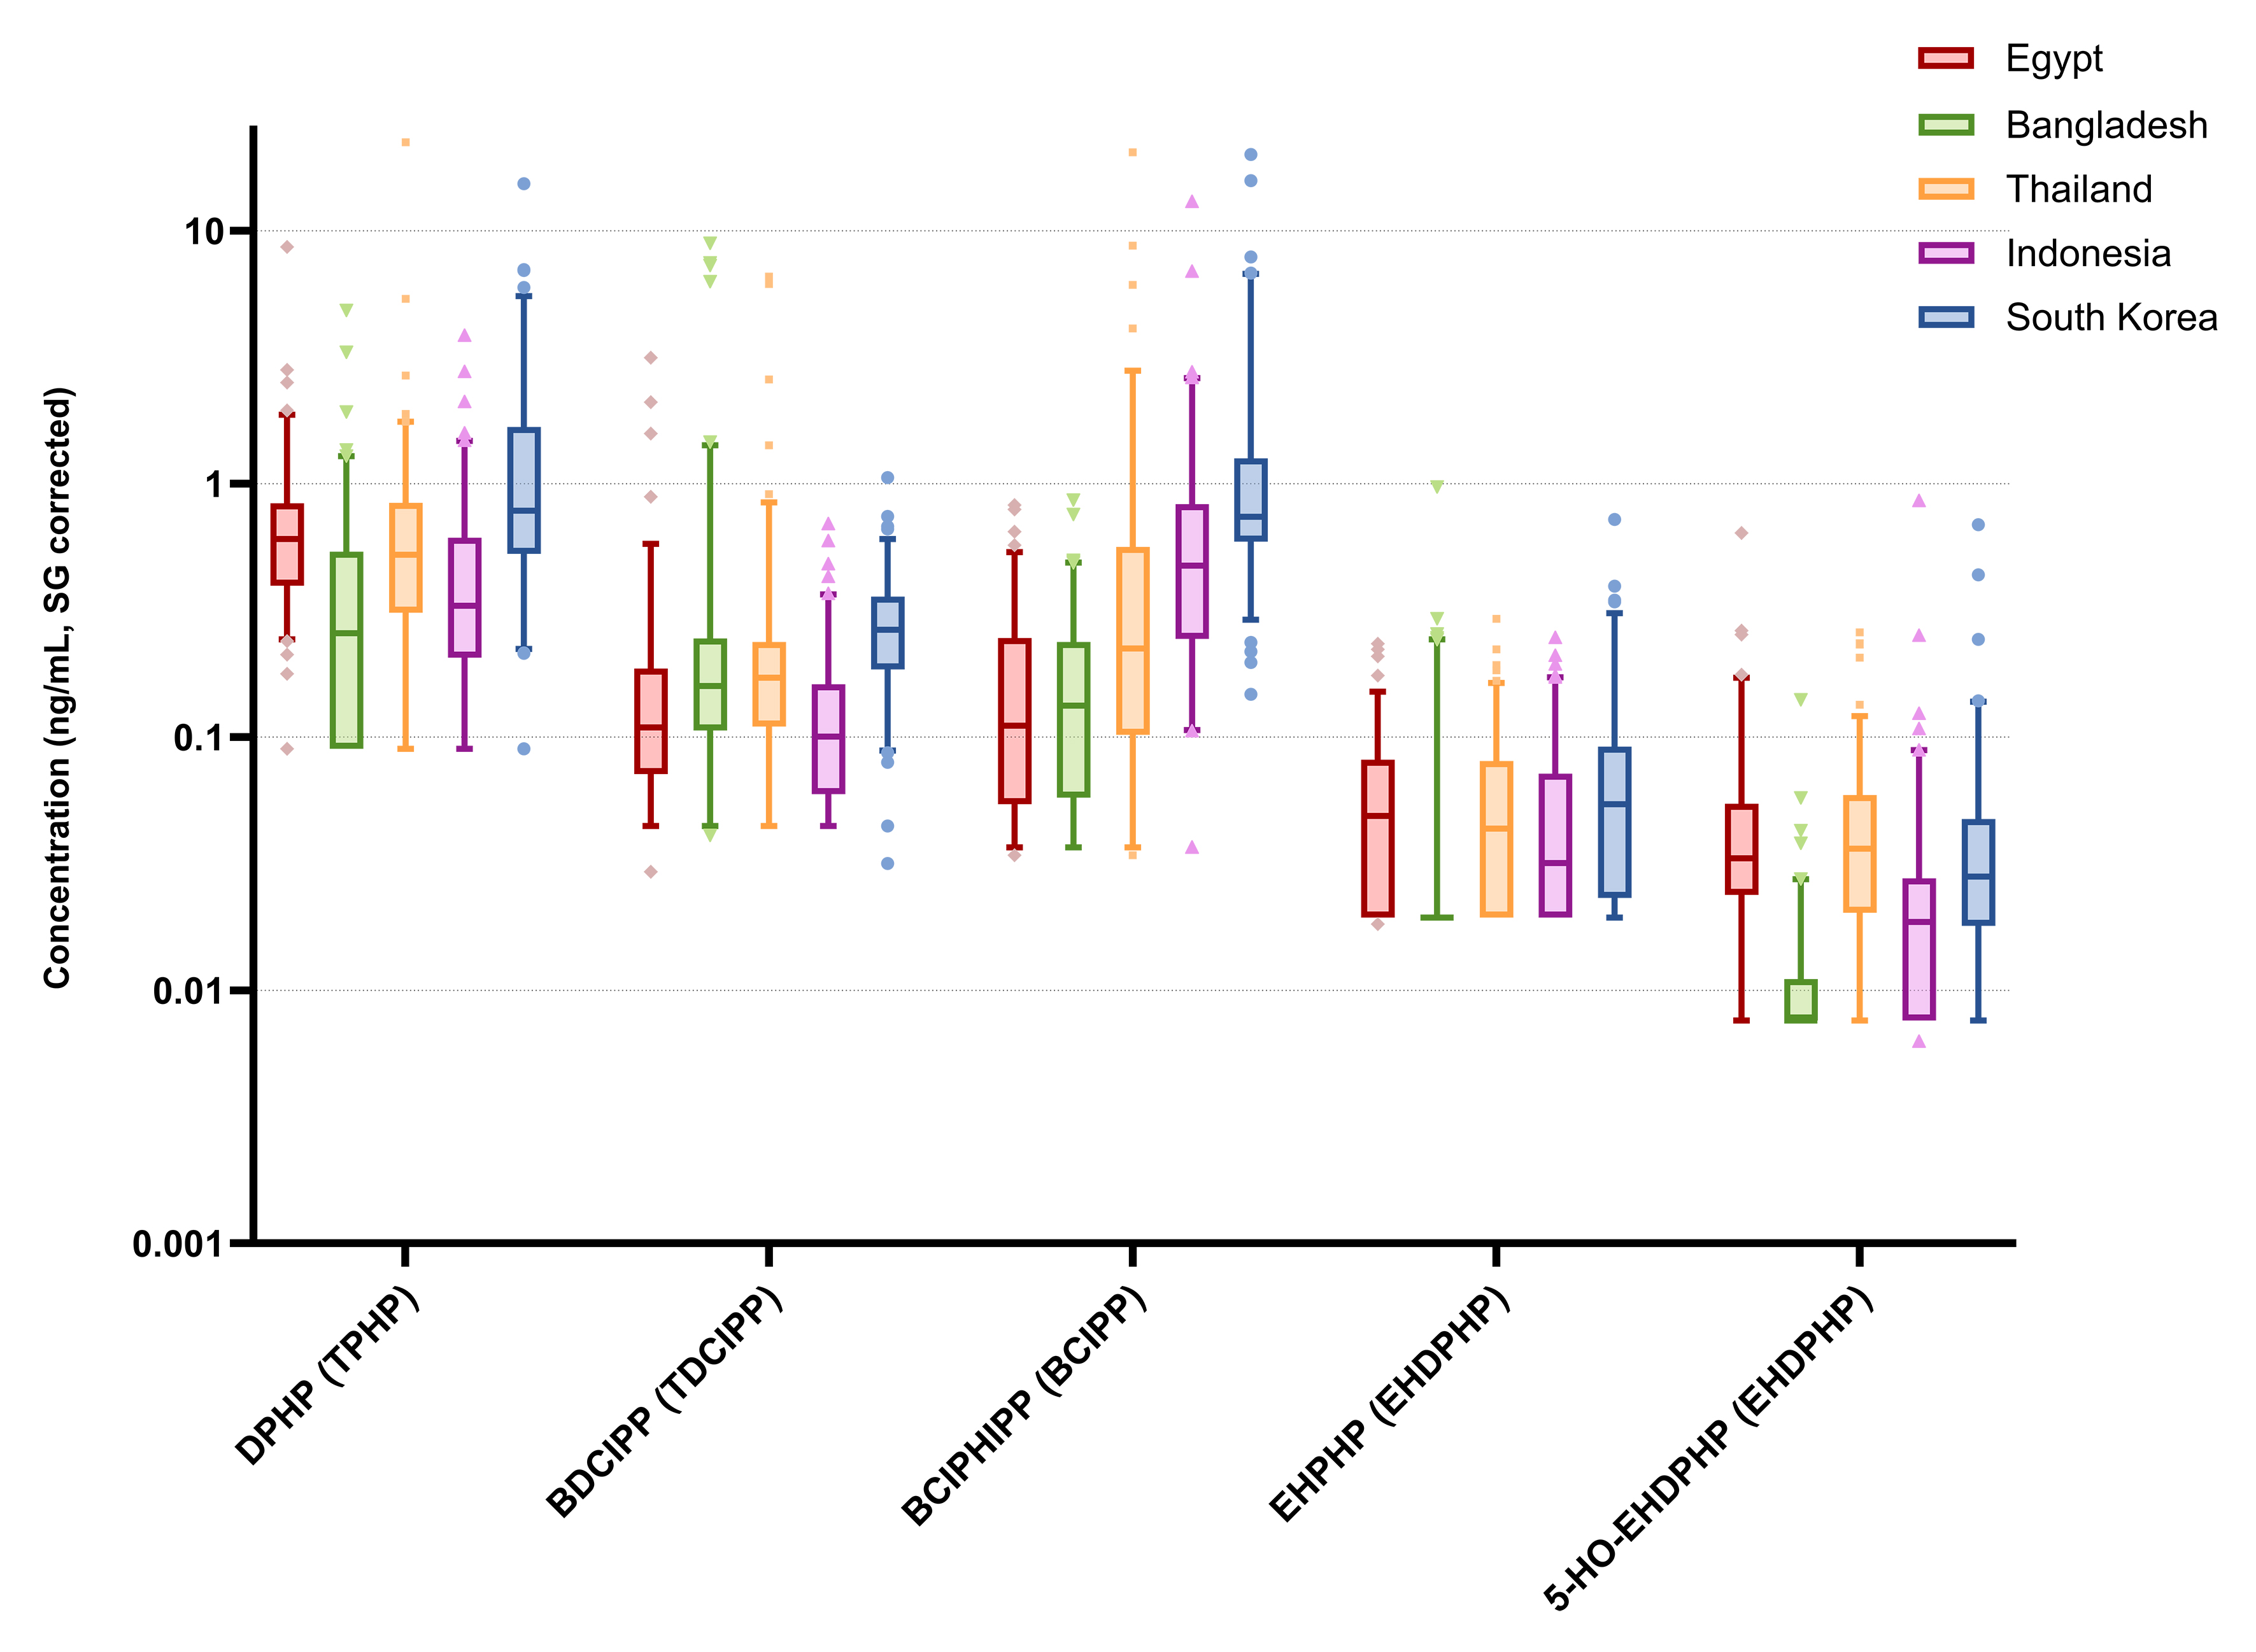
Figure 2. Median PFR metabolite concentrations (ng/mL, SG corrected) for each metabolite displayed separately for each country and the parent compound in brackets. The y-axis is shown on a logarithmic scale. The box represents the median and IQR, with the whiskers representing the 5% and 95% percentiles. Data points outside the 5%-95% range are plotted as individual points. PFR: Organophosphate flame retardant; SG: specific gravity; IQR: interquartile range; DPHP: diphenyl phosphate; TPHP: triphenyl phosphate; BDCIPP: bis (1,3-dichloro-2-propyl) phosphate; TDCIPP: tris (1,3-dichloro-2-propyl) phosphate; BCIPHIPP: 1-hydroxy-2-propyl bis (1-chloro-2-propyl) phosphate; BCIPP: bis (1-chloro-2-propyl) phosphate; EHPHP: 2-ethylhexyl phenyl phosphate; EHDPHP: 2-ethylhexyldiphenyl phosphate; 5-HO-EHDPHP: 2-ethyl-5-hydroxyhexyl diphenyl phosphate.
Exposure patterns for PFR metabolites that were detected in more than 50% of all samples, differed between countries [Figure 1]. In South Korea and Thailand, DPHP was the predominant metabolite (median concentrations of 0.78 and 0.52 ng/mL, respectively) followed by BCIPHIPP (0.74 and 0.22 ng/mL, respectively) [Figure 1, Table 2, Supplementary Tables 9 and 10]. Similarly, DPHP was the predominant metabolite in Bangladesh and Egypt (median concentrations of 0.27 and 0.61 ng/mL, respectively), while BDCIPP had the second-highest median concentrations (0.16 and 0.12 ng/mL, respectively). In Indonesia, the predominant metabolite was BCIPHIPP (median concentration of 0.48 ng/mL) followed by DPHP (0.34 ng/mL). Statistical analysis revealed significant differences in concentrations for all compounds between countries [Supplementary Tables 11-15].
The comparison of levels reported in the current study with previously reported concentrations (ng/mL, uncorrected for dilution) of PFR metabolite, showed variation across countries and metabolites. In general, EHDPHP metabolite levels in the present study in all countries were generally lower than reported in Asia, Australia, and Europe [Table 3][12,24,29,45,46]. For other metabolites, no consistent geographic trend was observed, with exposure patterns varying by country and metabolite, and each country showing a distinct exposure profile compared to previously reported data from Asia, Australia, Europe, and the United States. Therefore, results are compared for each included country individually with previously reported concentrations in other regions.
Comparison of PFR metabolites in the current study with levels reported in literature
| n | Country | Period of sample collection | Age of children included | TCIPP | TPHP | TNBP | TDCIPP | EHDPHP | TBOEP | TEHP | TCEP | ||||||
| BCIPP | BCIPHIPP | DPHP | 4-HO-DPHP | HO-TPHP | DNBP | BDCIPP | EHPHP | 5-HO-EHDPHP | BBOEP | TBOEP-OH | BEHP | ||||||
| Current study | 98 | Egypt | 2023 | 8-10 years | < LOQ | 0.11 | 0.62 | 1.05 | 0.01 | < LOQ | 0.11 | 0.05 | 0.03 | < LOQ | < LOQ | < LOQ | < LOQ |
| Current study | 100 | Bangladesh | 2023 | 7-10 years | < LOQ | 0.11 | 0.17 | < LOQ | < LOQ | < LOQ | 0.11 | < LOQ | < LOQ | < LOQ | < LOQ | < LOQ | < LOQ |
| Current study | 114 | Thailand | 2023 | 6-12 years | < LOQ | 0.25 | 0.52 | < LOQ | < LOQ | < LOQ | 0.16 | 0.05 | 0.04 | < LOQ | < LOQ | < LOQ | < LOQ |
| Current study | 100 | Indonesia | 2023 | 10-14 years | < LOQ | 0.48 | 0.33 | < LOQ | < LOQ | < LOQ | 0.1 | 0.04 | 0.02 | < LOQ | < LOQ | < LOQ | < LOQ |
| Current study | 90 | South Korea | 2022 | 7-10 years | < LOQ | 1.03 | 1.01 | 1.15 | < LOQ | < LOQ | 0.31 | 0.07 | 0.03 | < LOQ | < LOQ | < LOQ | 0.06 |
| Bastiaensen et al., 2019[24] | 128 | Japan | 2009-2010 | 7-12 years | < LOQ | 0.18 | 0.32 | 0.22 | < LOQ | < LOQ | 0.07 | < LOQ | 0.04 | 0.2 | < LOQ | 0.05 | |
| Zeng et al., 2023[29] | 427 | Japan | 2017-2020 | 9-12 years | < LOQ | 0.2 | 0.27 | < LOQ | < LOQ | < LOQ | 0.11 | 0.24 | < LOQ | 0.07 | < LOQ | < LOQ | |
| Chen et al., 2023^[26] | 30 | Taiwan | 2020-2022 | 6-10 years | 0.461 | 0.00333 | 0.165 | 0.182 | |||||||||
| Hu et al., 2022*[27] | 1,194 | China | 2018 | 6-18 years | 0.36 | 0.23 | 0.2 | 0.17 | |||||||||
| Yu et al., 2022*[28] | 929 | China | 2018 | 6-18 years | 0.37 | 0.22 | < LOQ | 0.19 | 0.16 | 0.27 | |||||||
| Que et al., 2025#[46] | Pooled | Australia | 2022-2023 | 6-15 years | < LOQ | 2.61 | < LOQ | < LOQ | 1.68 | 0.24 | 0.09 | < LOQ | < LOQ | < LOQ | |||
| den Ouden et al., 2026[45] | 655 | Belgium | 2014-2023 | 4-12 years | < LOQ | 0.45 | 1.57 | < LOQ | < LOQ | 0.18 | 0.41 | 0.17 | 0.22 | < LOQ | < LOQ | < LOQ | < LOQ |
| Bastiaensen et al., 2021[12] | 582 | Belgium | 2017-2018 | 14-15 years | < LOQ | 0.61 | 1.22 | < LOQ | < LOQ | < LOQ | 0.29 | 3.77 | 0.08 | < LOQ | < LOQ | < LOQ | |
| Rosolen et al., 2023[49] | 264 | Denmark | 2017-2019 | 7 years | 1.02 | 0.35 | |||||||||||
| Rosolen et al., 2023[49] | 296 | Slovakia | 2013-2015 | 11 years | < LOQ | 3.01 | 0.21 | ||||||||||
| CDC, 2019[25] | 331 | USA | 2017-2018 | 6-11 years | 0.118 | 1.8 | 3.28 | ||||||||||
In Egypt, DPHP levels were higher than those reported in other Asian studies but lower than those reported in Europe and the United States. BDCIPP concentrations were comparable to those reported in other Asian studies but lower than those reported in Australia, Europe and the United States, while BCIPHIPP levels were lower than those reported in Australia, Asia and Belgium. Bangladeshi children showed lower DPHP and BCIPHIPP levels than previously reported in Asia, Australia and Europe, with BDCIPP levels comparable to those in Asian studies but lower than those in Australia, Europe and the United States. Thai children showed higher DPHP levels than those reported in other Asian studies, but lower than observed in Europe and the United States. BDCIPP and BCIPHIPP were similar to those reported in other Asian countries but lower than those reported in Australia and Europe. In Indonesia, DPHP and BDCIPP levels were comparable to those reported in other Asian studies but lower than those reported in Australia, Europe, and the United States, whereas BCIPHIPP levels were higher than previously reported in Asian countries, similar to levels in Belgian children and lower than reported in Australia. Lastly, South Korean children showed higher DPHP and BDCIPP levels than those reported in other Asian countries, comparable levels to European studies and lower than reported in Australian children, whereas BCIPHIPP levels were higher than previously reported levels in Asia and Europe but lower than in Australia.
Determinants of PFR exposure
Results of the univariate analyses of potential PFR exposure determinants are displayed in Supplementary Table 4. In the multivariate models, country was the only variable that showed a significant contribution to the variation in concentrations for DPHP, ∑EHDPHP and ∑PFRs [Supplementary Table 16]. For BDCIPP and BCIPHIPP, country and hip circumference were revealed to be significant exposure determinants. Interestingly, hip circumference was negatively associated with BDCIPP concentrations [eB = 0.99 (0.98-1.00), P = 0.003], while it was positively associated with BCIPHIPP levels [eB = 1.02 (1.01-1.03), P < 0.001]. The fact that the country was identified as an exposure determinant for each metabolite indicates that the exposure sources might be specific for each country. Results from the statistical analysis for each separate country, including R-squared values, eB values (with 95% confidence intervals), and P-values are displayed in Supplementary Tables 17-21.
Housing characteristics were associated with DPHP concentrations in Bangladesh and South Korea. In Bangladesh, children living in a house that had not been renovated within the last year showed 35% lower DPHP concentrations than children living in recently renovated houses [eB = 0.65 (0.47-0.89), P = 0.008, Supplementary Table 18]. In contrast, in South Korea, children living in a house built longer than 3 years ago showed concentrations more than 2 times higher than children living in a recently built house [eB =2.45 (1.29-4.64), P = 0.007, Supplementary Table 21]. In addition, consumption of microwaved food with plasticware [South Korea, P = 0.027, Supplementary Table 21], canned food (Indonesia, P = 0.043, Supplementary Table 20), and fermented sauce (Thailand, P = 0.007, Supplementary Table 19) was positively associated with DPHP concentrations.
In Egypt, a positive association was found between the frequency of consuming Koshary, a traditional local street food dish (consisting of a mixture of pasta, fried rice, vermicelli, brown lentils, chickpeas, tomato sauce, garlic vinegar and crispy fried onions) and BDCIPP concentrations (P = 0.011, Supplementary Table 17). In Indonesia and South Korea, the frequency of eating ready-made meals was identified as a significant exposure variable with positive associations for BDCIPP (P = 0.050 and P = 0.013, Supplementary Tables 20 and 21, respectively). In Thailand, children who did not microwave their food with plasticware showed 33% lower BDCIPP concentrations than children who ate food microwaved with plasticware [eB = 0.67 (0.48-0.96), P = 0.027, Supplementary Table 19].
Consumption of canned beverages (Indonesia, P = 0.039, Supplementary Table 20), eggs (South Korea, P = 0.011, Supplementary Table 21), and microwaved food with a plastic wrap (Thailand, P = 0.013, Supplementary Table 19) was positively associated with BCIPHIPP concentrations. Additionally, more frequent use of humidifiers resulted in lower BCIPHIPP urinary concentrations in South Korea (P = 0.034, Supplementary Table 21).
For ∑EHDPHP, children living in a house that was built more than 3 years ago showed higher ∑EHDPHP concentrations in Indonesia [eB = 1.43 (1.02-2.01), P = 0.015, Supplementary Table 20] while in South Korea, the use of an air conditioner (P = 0.039, Supplementary Table 21) was positively associated with ∑EHDPHP concentrations. Eating food that was stored in the refrigerator with plasticware (South Korea, P = 0.015, Supplementary Table 21) or with a plastic wrap (Thailand, P = 0.013, Supplementary Table 19) was positively associated with higher ∑EHDPHP metabolites.
For ∑PFRs, positive associations were observed for the consumption of canned beverages (Indonesia, P = 0.014, Supplementary Table 20), eggs (South Korea, P = 0.005, Supplementary Table 21), food microwaved with plasticware (South Korea, P = 0.028, Supplementary Table 21), paper packed beverages (Thailand, P = 0.016, Supplementary Table 19) and plastic packaged food (Thailand, P = 0.024, Supplementary Table 19). Additionally, in South Korea, the use of a humidifier resulted in lower ∑PFR levels (P = 0.020, Supplementary Table 21), while children living in a house that was built more than 3 years ago had 1.6 times higher ∑PFR concentrations [eB = 1.58 (1.03-2.45), P = 0.039, Supplementary Table 21].
In the present study, consumption of different food groups, or of food stored or prepared in specific ways, was associated with higher PFR concentrations. Different food groups or storage and preparation conditions were identified as exposure variables across countries. Several studies have investigated the relationship between food consumption and PFR concentrations. However, results between studies differed, with some studies not identifying any associations while others found certain food products to be associated only with concentrations of certain individual PFRs[12,22,45,47,48]. Among the included countries in this study, different exposure variables were retained as significant determinants of exposure to different PFRs. The variation in PFR concentrations and exposure sources may be attributed to the differences in climate, food consumption, and lifestyle habits across countries. In addition, differences in age of included children between countries might explain the observed differences in metabolite concentrations, with median ages ranging from 8.8 years (South Korea) to 11.8 years (Indonesia). Remarkably, the included children in South Korea were the youngest, while the reported metabolite concentrations in this country were the highest. Moreover, different socioeconomic factors might also play a role. According to the United Nations, South Korea is a developed country, whereas the other included countries are classified as developing countries[48]. This may explain the higher concentrations of PFRs in South Korea compared to the other countries included in this study. However, in comparison with other similarly developed Asian and European countries, South Korea showed higher PFR concentrations than reported in Japan, and higher BCIPHIPP concentrations than both Japan and Europe[12,24,29,45,49]. Another explanation for differences in PFR concentrations between the included countries might be the different regulations of FRs in the different countries. Restriction of BFRs may lead to an increased use of PFRs. In Egypt, PBDEs are banned in line with the Stockholm Convention, while some PFRs have also been restricted in use. TCEP is prohibited in children’s electrical products, while the use of PFRs in food containers is restricted based on migration limits derived from EU benchmarks[50,51]. In Bangladesh, a restriction on PBDEs in electronics, based on international guidelines, has been proposed but has not yet been implemented, which may explain the lower concentrations of PFR metabolites detected in Bangladesh[52]. In Thailand, PBDEs are also restricted in use with certain limits[53]. In Indonesia, the PBDE content of safety glass cannot exceed 0.1%, while for other sectors regulations regarding PBDE use have not yet been developed[54]. In South Korea, there are strict regulations banning the use of BFRs or restricting their use in specific items to a limited amount[55]. When the use of BFRs is restricted, it might be necessary to use other compounds, such as PFRs, to adhere to flammability standards. This could lead to increased use of PFRs and the higher levels of PFR metabolites observed in South Korea compared to the other included countries in this study. In addition, the lower age of the South Korean children included might contribute to the higher concentrations of PFRs in these children, as younger age groups are generally considered to have a higher exposure to environmental contaminants due to behavioral and physiological factors such as increased hand-to-mouth activity.
Risk assessment
The highest median EDI was reported for TPHP (74.1 ng/kg bw/day) [Supplementary Figure 2A], while for TCIPP the highest median RCR was observed (0.0021) [Supplementary Figure 2B].
For all compounds, median RCR values were more than 2 orders of magnitude below the critical value of 1. For TCIPP, one child expressed an RCR > 1 (individual from Thailand, value of 2.3). The median HI was 0.003, with only one individual showing an HI above 1 (same individual from Thailand, value of 2.3)
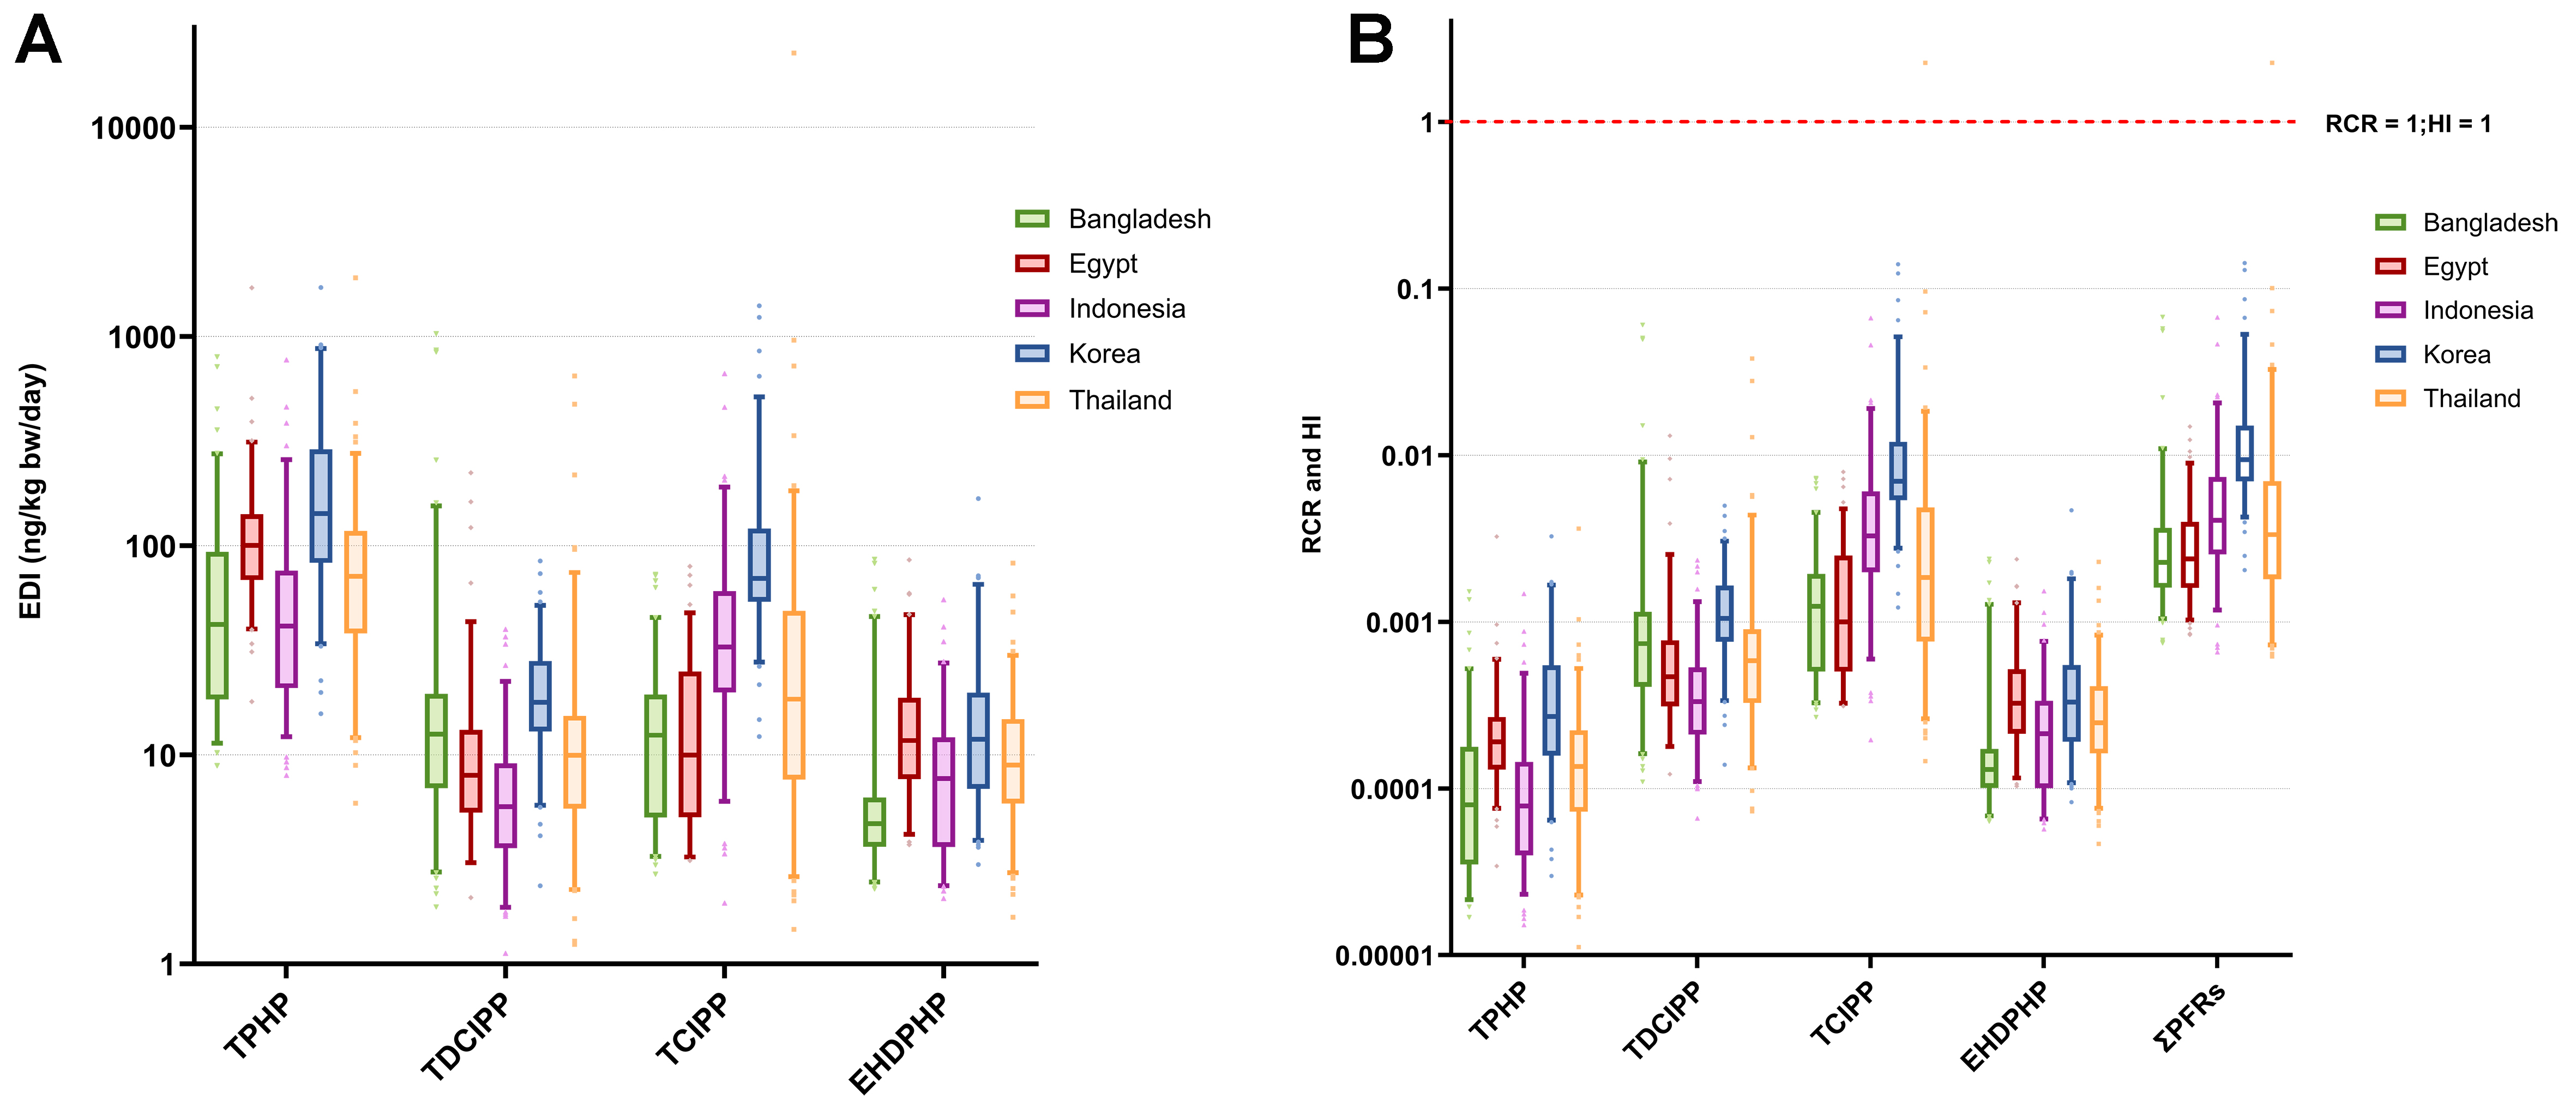
Figure 3. EDIs (in ng/kg bw/day) of PFR parent compounds for the different countries (A); RCRs and the HI for PFR parent compounds for children from different countries (B). The y-axis is shown on a logarithmic scale. The box represents the median and IQR, with the whiskers representing the 5% and 95% percentiles. Data points outside the 5%-95% range are plotted as individual points. EDIs: Estimated daily intakes; PFR: organophosphate flame retardant; RCRs: risk characterization ratios; HI: hazard index; IQR: interquartile range; TPHP: triphenyl phosphate; TDCIPP: tris (1,3-dichloro-2-propyl) phosphate; TCIPP: tris (1-chloro-2-propyl) phosphate; EHDPHP: 2-ethylhexyldiphenyl phosphate.
Study limitations
Even though extensive questionnaires were used, resulting R-squared values of the regression models were relatively low (0.010-0.338), indicating some exposure sources, including specific food products and specific consumer products, are being missed. Future studies are advised to include specific variables of exposure to PFRs in their questionnaires when exploring possible exposure determinants for PFRs. In addition, the current study did not include external exposure measurements (e.g., dust, food) as this was not within the scope of the current study. External exposure measurements are of high value in future studies assessing the exposure pathways of PFRs. One limitation of the current study is the relatively small sample size (approximately 100 per country), which reduced statistical power. Therefore, statistical results should be interpreted with caution to avoid overinterpretation. However, results from the statistical analysis may indicate potential sources of exposure and suggest which variables should be included in future studies with a larger sample size. Sampling was performed only in one specific location in each country; therefore, the results reflect exposure in the investigated regions, which may not always be generalizable to the national population.
As toxicity and toxicokinetic data for PFRs are scarce, the risk assessment was performed using DNEL values from ECHA and US EPA, which are based on animal studies that did not always assess chronic exposure. In addition, urinary excretion factors used were derived from in vitro studies. The use of animal and in vitro data adds uncertainty to the risk assessment. Moreover, some PFRs can be present in the environment as metabolites rather than as parent compounds (e.g., in food products). When calculating the estimated daily exposure based on urinary levels, this fact is not accounted for, and therefore the calculated EDI and RCR might be an overestimation. Another limitation is the cross-sectional design of the study using single-spot urine samples, collected at a single time point, which might not adequately reflect temporal variability and therefore might not reflect long-term exposure patterns. Therefore, the EDIs and risk assessment should be interpreted as indicators of potential acute exposure and risks rather than precise estimations of chronic risk. To investigate chronic risks of PFR exposure, future studies should consider a longitudinal design with multiple sampling moments to reflect variability and long-term exposure.
CONCLUSIONS
This study assessed children’s exposure to PFRs in five countries in which data on PFRs are scarce. Concentrations of PFR metabolites were measured using validated analytical methods supported by internal and external QC samples to ensure reliable performance. A total of 13 PFR metabolites were analyzed, including BCIPHIPP, EHPHP, and 5-HO-EHDPHP, for which data are still scarce. This enabled risk assessments for individual parent compounds and for combined exposure to multiple PFRs by calculating the HI. The implementation of a harmonized sampling protocol, including consistent questionnaires and the inclusion of children in the same age group, enabled comparison of the observed PFR levels across the five included countries. In general, concentrations reported in the current study were lower than those reported in children in Europe and the United States but similar to those reported in children from China, Japan, and Taiwan. South Korea was an exception among the studied countries and generally showed higher concentrations of PFR metabolites than reported in most of the other included countries and other studies. Differences in PFR concentrations and exposure profiles might be due to differences in lifestyle and different regulations of FR usage across the studied countries. In general, RCRs and HIs were more than 2 orders of magnitude below the critical value of 1, with only one individual in Thailand showing an HI above 1 due to high TCIPP exposure. This indicates that the included population is not at risk of adverse effects from PFRs based on current acute exposure levels in single spot urine samples. This study can contribute to the limited data on PFR exposure in Egypt, Bangladesh, Thailand, Indonesia, and South Korea and provide indications for future studies to identify differences in exposure patterns and exposure sources between different countries.
DECLARATIONS
Acknowledgements
We thank all the children and parents in the different countries who voluntarily participated, filled in the questionnaires, and donated urine. Without them, this work would not have been possible. The graphical abstract incorporates a country-highlighted map from MapChart.com (https://www.mapchart.net/index.html), a mass spectrometer icon from Bioicons.com (https://bioicons.com/), and a urine sample icon from Healthicons.org (https://healthicons.org/).
Authors’ contributions
Formal analysis, investigation, visualization, writing - original draft: den Ouden, F.
Formal analysis, investigation, writing - review and editing: Que, D. E.; Bosschaerts, S.
Data curation, writing - review and editing: Jung, J.; Lee, A.; Jo, A. R.
Writing - review and editing, supervision: Poma, G.; Tosepu, R.; Ahmed, M. B. M.; Hossain, K.; Park, J.; Tantrakarnapa, K.
Writing - review and editing: Umar, A.; Abdelhafez, H. E. D. H.; Hossain, A. S.; Kliengchuay, W.
Writing - review and editing, supervision, conceptualization, funding acquisition, project administration: Choi, K.; Covaci, A.
Availability of data and materials
Restrictions apply to the availability of these data. Data were obtained from the International Biobank for Children and are available upon reasonable request due to privacy reasons at Kyungho Choi with the permission of the International Biobank for Children.
AI and AI-assisted tools statement
Not applicable.
Financial support and sponsorship
den Ouden, F. acknowledges the Flemish Exposome Project (GISMO 01IB1320m Flexigut project) for her PhD fellowship. Poma, G. was supported by the Exposome Centre of Excellence at the University of Antwerp (BOF grant, Antigoon database numbers 41222 and 50211). This study was in part supported by the National Research Foundation of Korea (NRF) grant funded by the Ministry of Science and ICT (MSIT) (RS-2025-00513967). Que, D. E. is supported by the University of Queensland Research Training Program Scholarship.
Conflicts of interest
Poma, G. is an Associate Editor of the Journal of Environmental Exposure Assessment, and Covaci, A. is an Editorial Board Member of the Journal. They were not involved in any steps of editorial processing, notably reviewers’ selection, manuscript handling, and decision-making. The other authors declare that there are no conflicts of interest.
Ethical approval and consent to participate
Ethical approval was sought in each participating country and institution. Ethical approval for the study was given by the Research Ethics Committees of Soonchunhyang University (202204-BR-058-05), Mahidol University (MUTM 2023-017-01 and MUTM 2023-017-02), Indonesian Public Health Association (018/ECHR-IPHA/I/2023), University of Rajshahi [249(35)/320/IAMEBBC/IBSc] and the Research Ethics Committee of Egypt National Research Centre (IRB approval No. 03420223). Written consent was obtained from the participating children and their guardians.
Consent for publication
Not applicable.
Copyright
© The Author(s) 2026.
Supplementary Materials
REFERENCES
1. European Chemicals Agency. Regulatory strategy for flame retardants. 2023. https://www.actu-environnement.com/media/pdf/news-43052-strategie-echa-retardateurs-flammes.pdf. (accessed on 5 Aug 2026).
2. van der Veen, I.; de Boer, J. Phosphorus flame retardants: properties, production, environmental occurrence, toxicity and analysis. Chemosphere 2012, 88, 1119-53.
3. Blum, A.; Behl, M.; Birnbaum, L.; et al. Organophosphate ester flame retardants: are they a regrettable substitution for polybrominated diphenyl ethers? Environ. Sci. Technol. Lett. 2019, 6, 638-49.
4. Hahladakis, J. N.; Velis, C. A.; Weber, R.; Iacovidou, E.; Purnell, P. An overview of chemical additives present in plastics: migration, release, fate and environmental impact during their use, disposal and recycling. J. Hazard. Mater. 2018, 344, 179-99.
5. Wei, G. L.; Li, D. Q.; Zhuo, M. N.; et al. Organophosphorus flame retardants and plasticizers: sources, occurrence, toxicity and human exposure. Environ. Pollut. 2015, 196, 29-46.
6. National Toxicology Program. Toxicology and carcinogenesis studies of an isomeric mixture of tris(chloropropyl) phosphate administered in feed to Sprague Dawley (Hsd:Sprague Dawley SD) rats and B6C3F1/N mice. Natl. Toxicol. Program. Tech. Rep. Ser. 2023, NTP-TR-602.
7. Araki, A.; Bastiaensen, M.; Ait Bamai, Y.; et al. Associations between allergic symptoms and phosphate flame retardants in dust and their urinary metabolites among school children. Environ. Int. 2018, 119, 438-46.
8. Mendy, A.; Percy, Z.; Braun, J. M.; et al. Prenatal exposure to replacement flame retardants and organophosphate esters and childhood adverse respiratory outcomes. Environ. Res. 2024, 240, 117523.
9. Chupeau, Z.; Mercier, F.; Bot, B. L.; et al. Early-life exposure to organophosphate esters and child neurodevelopment in the French national birth cohort. Environ. Int. 2025, 200, 109558.
10. European Chemicals Agency. Screening Report. An assessment of whether the use of TCEP, TCPP and TDCP in articles should be restricted. 2018. https://echa.europa.eu/documents/10162/13641/screening_report_tcep_tcpp_td-cp_en.pdf/e0960aa7-f703-499c-24ff-fba627060698. (accessed on 5 Aug 2026).
11. European Chemicals Agency. Candidate List of substances of very high concern for Authorisation. 2025. https://echa.europa.eu/candidate-list-table?p_p_id=disslists_WAR_disslistsportlet&p_p_lifecycle=0&p_p_state=normal&p_p_mode=view&_disslists_WAR_disslistsportlet_cur=1&_disslists_WAR_disslistsportlet_haz_detailed_concern=&_disslists_WAR_disslistsportlet_su. (accessed on 5 Aug 2026).
12. Bastiaensen, M.; Gys, C.; Colles, A.; et al. Exposure levels, determinants and risk assessment of organophosphate flame retardants and plasticizers in adolescents (14-15 years) from the Flemish Environment and Health Study. Environ. Int. 2021, 147, 106368.
13. Hou, R.; Xu, Y.; Wang, Z. Review of OPFRs in animals and humans: absorption, bioaccumulation, metabolism, and internal exposure research. Chemosphere 2016, 153, 78-90.
14. Liu, Y.; Li, Y.; Dong, S.; et al. The risk and impact of organophosphate esters on the development of female-specific cancers: comparative analysis of patients with benign and malignant tumors. J. Hazard. Mater. 2021, 404, 124020.
15. Gbadamosi, M. R.; Abdallah, M. A.; Harrad, S. A critical review of human exposure to organophosphate esters with a focus on dietary intake. Sci. Total. Environ. 2021, 771, 144752.
16. Guo, Y.; Liang, C.; Zeng, M. X.; et al. An overview of organophosphate esters and their metabolites in humans: analytical methods, occurrence, and biomonitoring. Sci. Total. Environ. 2022, 848, 157669.
17. Li, Y.; Li, D.; Chen, J.; et al. Presence of organophosphate esters in plasma of patients with hypertension in Hubei Province, China. Environ. Sci. Pollut. Res. Int. 2020, 27, 24059-69.
18. Liu, Y.; Gong, S.; Ye, L.; et al. Organophosphate (OP) diesters and a review of sources, chemical properties, environmental occurrence, adverse effects, and future directions. Environ. Int. 2021, 155, 106691.
19. Völkel, W.; Fuchs, V.; Wöckner, M.; Fromme, H. Toxicokinetic of tris(2-butoxyethyl) phosphate (TBOEP) in humans following single oral administration. Arch. Toxicol. 2018, 92, 651-60.
20. Christia, C.; Tang, B.; Yin, S. S.; et al. Simultaneous determination of legacy and emerging organophosphorus flame retardants and plasticizers in indoor dust using liquid and gas chromatography-tandem mass spectrometry: method development, validation, and application. Anal. Bioanal. Chem. 2019, 411, 7015-25.
21. Health Canada. Chemicals and children’s health. 2024. https://www.canada.ca/en/health-canada/services/chemical-substances/fact-sheets/chemicals-childrens-health.html. (accessed on 5 Aug 2026).
22. van der Schyff, V.; Kalina, J.; Govarts, E.; et al. Exposure to flame retardants in European children - results from the HBM4EU aligned studies. Int. J. Hyg. Environ. Health. 2023, 247, 114070.
23. World Health Organization. Chemical Safety. https://www.who.int/health-topics/chemical-safety. (accessed on 5 Aug 2026).
24. Bastiaensen, M.; Ait Bamai, Y.; Araki, A.; et al. Biomonitoring of organophosphate flame retardants and plasticizers in children: associations with house dust and housing characteristics in Japan. Environ. Res. 2019, 172, 543-51.
25. National Center for Environmental Health (U.S.). Division of Laboratory Sciences. Fourth National Report on human exposure to environmental chemicals. 2019. https://stacks.cdc.gov/view/cdc/75823. (accessed on 5 Aug 2026).
26. Chen, F. S.; Chen, C. C.; Tsai, C. C.; et al. Urinary levels of organophosphate flame retardants metabolites in a young population from Southern Taiwan and potential health effects. Front. Endocrinol. 2023, 14, 1173449.
27. Hu, L.; Yu, M.; Li, Y.; et al. Association of exposure to organophosphate esters with increased blood pressure in children and adolescents. Environ. Pollut. 2022, 295, 118685.
28. Yu, M.; Li, X.; Liu, B.; et al. Organophosphate esters in children and adolescents in Liuzhou city, China: concentrations, exposure assessment, and predictors. Environ. Sci. Pollut. Res. Int. 2022, 29, 39310-22.
29. Zeng, Y.; Goudarzi, H.; Ait Bamai, Y.; et al. Exposure to organophosphate flame retardants and plasticizers is positively associated with wheeze and FeNO and eosinophil levels among school-aged children: the Hokkaido study. Environ. Int. 2023, 181, 108278.
30. Jung, J.; Jo, A. R.; Kim, Y.; et al. Phthalate and nonphthalate plasticizer exposure among children of Korea, Thailand, Indonesia, and Bangladesh: occurrences and risk comparison. Environ. Sci. Technol. 2025, 59, 17431-42.
31. Lee, I.; Pälmke, C.; Ringbeck, B.; et al. Urinary concentrations of major phthalate and alternative plasticizer metabolites in children of Thailand, Indonesia, and Saudi Arabia, and associated risks. Environ. Sci. Technol. 2021, 55, 16526-37.
32. Bastiaensen, M.; Xu, F.; Been, F.; Van den Eede, N.; Covaci, A. Simultaneous determination of 14 urinary biomarkers of exposure to organophosphate flame retardants and plasticizers by LC-MS/MS. Anal. Bioanal. Chem. 2018, 410, 7871-80.
33. Barr, D. B.; Wilder, L. C.; Caudill, S. P.; Gonzalez, A. J.; Needham, L. L.; Pirkle, J. L. Urinary creatinine concentrations in the U.S. population: implications for urinary biologic monitoring measurements. Environ. Health. Perspect. 2005, 113, 192-200.
34. James, R. A.; Hertz-Picciotto, I.; Willman, E.; Keller, J. A.; Charles, M. J. Determinants of serum polychlorinated biphenyls and organochlorine pesticides measured in women from the child health and development study cohort, 1963-1967. Environ. Health. Perspect. 2002, 110, 617-24.
35. West, R. M. Best practice in statistics: the use of log transformation. Ann. Clin. Biochem. 2022, 59, 162-5.
36. Gys, C.; Bastiaensen, M.; Bruckers, L.; et al. Determinants of exposure levels of bisphenols in flemish adolescents. Environ. Res. 2021, 193, 110567.
37. Colles, A.; Bruckers, L.; Den Hond, E.; et al. Perfluorinated substances in the Flemish population (Belgium): levels and determinants of variability in exposure. Chemosphere 2020, 242, 125250.
38. Kim, S. S.; Meeker, J. D.; Carroll, R.; et al. Urinary trace metals individually and in mixtures in association with preterm birth. Environ. Int. 2018, 121, 582-90.
39. O’Brien, K. M.; Upson, K.; Cook, N. R.; Weinberg, C. R. Environmental chemicals in urine and blood: improving methods for creatinine and lipid adjustment. Environ. Health. Perspect. 2016, 124, 220-7.
40. Beckford, K.; Grimes, C. A.; Margerison, C.; et al. A systematic review and meta-analysis of 24-h urinary output of children and adolescents: impact on the assessment of iodine status using urinary biomarkers. Eur. J. Nutr. 2020, 59, 3113-31.
41. European Chemicals Agency. ECHA CHEM. 2025. https://echa.europa.eu/nl/echa-chem. (accessed on 5 Aug 2026).
42. US, E. P. A. Comptox chemicals dashboard. 2024. https://comptox.epa.gov/dashboard/. (accessed on 5 Aug 2026).
43. European Chemicals Agency. Guidance on information requirements and chemical safety assessment. Part E: risk characterisation. 2016. https://echa.europa.eu/documents/10162/17224/information_requirements_part_e_en.pdf/1da6cadd-895a-46f0-884b-00307c0438fd. (accessed on 5 Aug 2026).
44. Apel, P.; Kortenkamp, A.; Koch, H. M.; et al. Time course of phthalate cumulative risks to male developmental health over a 27-year period: biomonitoring samples of the German Environmental Specimen Bank. Environ. Int. 2020, 137, 105467.
45. den Ouden, F.; Cseresznye, A.; Engelen, L.; et al. Chemical exposure in childhood: a study on organophosphate flame retardants and plasticizers in a Flemish birth cohort. Environ. Res. 2026, 288, 123275.
46. Que, D. E.; den Ouden, F.; Bosschaerts, S.; et al. Trends of organophosphate ester flame retardant metabolites in age- and sex-stratified pooled Australian urine samples from the past decade (2012-2023). Environ. Sci. Technol. 2025, 59, 8997-9007.
47. Cequier, E.; Sakhi, A. K.; Marcé, R. M.; Becher, G.; Thomsen, C. Human exposure pathways to organophosphate triesters - a biomonitoring study of mother-child pairs. Environ. Int. 2015, 75, 159-65.
48. UN Trade and Development. Country classifications. https://unctadstat.unctad.org/EN/Classifications.html. (accessed on 5 Aug 2026).
49. Rosolen, V.; Giordani, E.; Mariuz, M.; et al. Cognitive performance and exposure to organophosphate flame retardants in children: evidence from a cross-sectional analysis of two European mother-child cohorts. Toxics 2023, 11, 878.
50. Egypt’s National Food Safety Authority. Decision No. 17/2022. https://voyager.fas.usda.gov/voyager/navigo/show?id=187a5afc-b3f0-519d-9868-46dcdc7b3eb6&disp=default. (accessed on 5 Aug 2026).
51. Presidential Decree Egypt. Law number 4 of 1994. Promulgating the environment law. https://www.gafi.gov.eg/English/StartaBusiness/Laws-and-Regulations/PublishingImages/Pages/BusinessLaws/enviromental.pdf. (accessed on 5 Aug 2026).
52. Wang, Y.; Peris, A.; Rifat, M. R.; et al. Measuring exposure of e-waste dismantlers in Dhaka Bangladesh to organophosphate esters and halogenated flame retardants using silicone wristbands and T-shirts. Sci. Total. Environ. 2020, 720, 137480.
53. Hazardous substance act B.E. 2535. https://www.diw.go.th/webdiw/wp-content/uploads/2021/07/law-haz-29032535-eng.pdf. (accessed on 5 Aug 2026).
54. Ministry of Industry of the Republic of Indonesia. Regulation of the Minister of Industry of the Republic of Indonesia Number 52 of 2020 concerning Green Industry Standards for the Laminated Safety Glass Industry. 2020. https://peraturan.bpk.go.id/Details/167416/permenperin-no-52-tahun-2020. (accessed on 5 Aug 2026).
55. Presidential Decree No. 33514. Enforcement decree of the persistent pollutants control act. 2023. https://elaw.klri.re.kr/eng_mobile/viewer.do?hseq=68807&type=part&key=39. (accessed on 5 Aug 2026).
Cite This Article
 Open Access
How to Cite
Download Citation
Export Citation File:
Type of Import
Tips on Downloading Citation
Citation Manager File Format
Type of Import
Direct Import: When the Direct Import option is selected (the default state), a dialogue box will give you the option to Save or Open the downloaded citation data. Choosing Open will either launch your citation manager or give you a choice of applications with which to use the metadata. The Save option saves the file locally for later use.
Indirect Import: When the Indirect Import option is selected, the metadata is displayed and may be copied and pasted as needed.
About This Article
Copyright

Data & Comments
Data
0










Comments
Comments must be written in English. Spam, offensive content, impersonation, and private information will not be permitted. If any comment is reported and identified as inappropriate content by OAE staff, the comment will be removed without notice. If you have any queries or need any help, please contact us at [email protected].