

Comparison of bisphenols in human urine, whole blood, serum and plasma: levels, optimal matrix identification and health risk
 0
0 Abstract
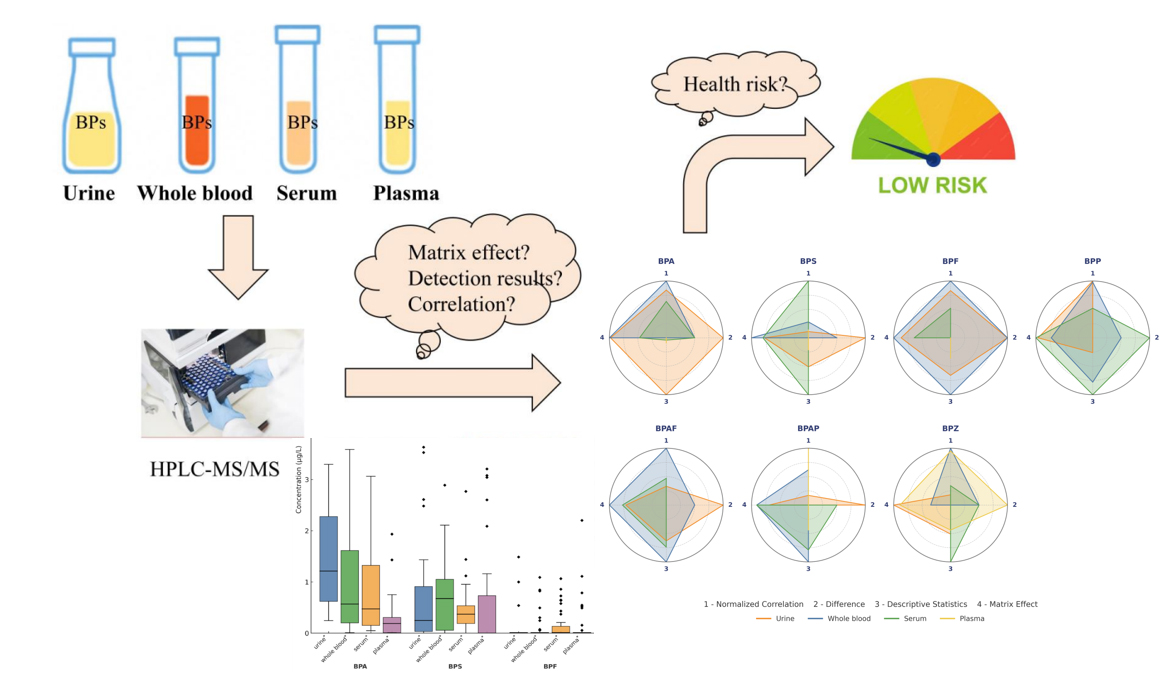
Bisphenols (BPs) are widely used endocrine-disrupting chemicals that require accurate biological monitoring, but the optimal biological matrix for the detection of specific analogs remains unclear. This study performed the first comprehensive paired analysis of urine, whole blood, serum, and plasma samples from 38 individuals to systematically evaluate the matrix effects (ME), detection performance, and health risks of seven BPs (BPA, BPS, BPF, BPP, BPZ, BPAF, BPAP). Key findings show that urine is the best matrix for BPA due to minimal ME and highest sensitivity, confirming the reliability of its recent exposure assessment. Whole blood exhibits excellent stability and the highest concentration of ΣBPs, making it ideal for detecting BPF, BPAF, and BPAP and reflecting systemic exposure. Serum provides the best standardized data for BPS and BPP, supporting their use in chronic studies, whereas plasma exhibits specificity for BPZ but requires pretreatment optimization due to significant matrix inhibition. The health risk is negligible, although BPA exposure is skewed to the right in the high-risk subgroup, with surrogates (BPS/BPAP) accounting for less than 1% of the risk of BPA. These results underscore the need, within cost and design constraints, for multi-matrix biological monitoring of a large class of contaminants. Limitations included the small sample size and geographic specificity. Future studies should conduct more rigorous and in-depth health risk assessments, validate matrix-specific exposure windows over time, and extend monitoring to BPs in adipose tissue or breast milk.
Keywords
INTRODUCTION
Bisphenols (BPs) are a group of chemicals characterized by two phenol groups connected by an alkyl group[1]. They are widely used in the production of polycarbonate plastics and epoxy resins, which are commonly found in consumer products such as food and beverage containers, thermal paper, toys, electronics, and medical devices[2,3]. Among them, bisphenol A (BPA) is the most well-known and extensively studied[4-6]. BPA has been widely used due to its excellent chemical properties, such as stability and rigidity. However, its widespread use has led to significant environmental distribution and human exposure through multiple pathways, including ingestion, inhalation, and dermal contact. BPs have been detected in indoor dust, wastewater, surface water, sediments, and various food products, indicating their ubiquity in the environment[1,7,8].
BPA and its analogs, such as bisphenol S (BPS), bisphenol F (BPF), bisphenol P (BPP), bisphenol AF (BPAF), bisphenol AP (BPAP), and bisphenol Z (BPZ), have been identified as endocrine-disrupting chemicals (EDCs)[9,10]. Exposure to BPA has been linked to an increased risk of hormone-related cancers, including ovarian, breast, prostate, and colon cancers[11-15]. Additionally, BPA has been associated with reproductive issues, such as infertility and altered reproductive hormone levels, as well as developmental problems, metabolic disorders, and neurodegenerative diseases[16-22]. For instance, BPA exposure can lead to polycystic ovary syndrome (PCOS), delayed puberty, miscarriages, premature births, and infertility in females[23-27]. In males, it can cause decreased sexual function, reduced testosterone biosynthesis, and impaired sperm quality and quantity[28-31].
Studies have also indicated that other BPA analogs pose similar or even greater health risks[10]. BPS and BPF, which are commonly used as BPA substitutes, have been detected in various everyday products, including personal care products, thermal paper, and foods[32-34]. BPS and BPF have been shown to act through mechanisms such as PPARγ activation, high-fat diet-induced weight gain, and stimulation of adipocyte hypertrophy and depot fat composition[10]. BPAF, a fluorinated compound, has been reported to activate estrogen receptors ERα, Erβ, and membrane receptor G protein-coupled estrogen receptor and/or other estrogen-related receptors (ERRs)[35,36]. Overall, the endocrine-disrupting effects of BPs are of particular concern due to their ability to mimic or interfere with natural hormones, potentially affecting developmental, reproductive, and metabolic processes.
Recent studies on BPs, particularly BPA, highlight the complexity of detecting these compounds in biological matrices. Urine is generally considered the most reliable matrix for detecting BPs due to its role as a primary excretion route for non-persistent chemicals. BPA is often found in higher concentrations in urine than in blood or breast milk, making urine a preferred matrix for recent exposure monitoring[37]. However, blood and serum may provide better insights into long-term, cumulative exposure. Once BPA enters the bloodstream, it binds to serum proteins, with a small fraction remaining unbound and biologically active, which could reflect systemic exposure[38]. Studies have shown that blood and serum can provide valuable data on BPA's distribution, especially for chronic, prolonged, or prenatal exposure[39-41]. Blood samples can also offer useful information, with detectable BPA levels observed in some studies, particularly in workers exposed to BPA[42]. While studies have focused on urine, blood, and serum, there is limited research on the detection of BPs in plasma, and no studies have simultaneously investigated BPs levels in paired samples of urine, blood, serum, and plasma. This gap in research suggests that multi-matrix biomonitoring is needed for a more comprehensive assessment of BPS exposure[41,43].
Furthermore, the detection of BPs in biological matrices faces challenges due to matrix effects (MEs). While urine is commonly used, plasma and blood, which reflect long-term exposure, are more complex due to high protein content and other components that can interfere with detection. Studies show that MEs in plasma complicate BPA quantification, though these can be minimized using isotope-labeled internal standards[44]. However, research on MEs in plasma is limited, especially in studies comparing paired urine, blood, serum, and plasma samples, which remains an underexplored area[45]. Further studies are needed to reveal these matrix interferences.
Therefore, this study aims to: (1) assess the MEs and methodological indicators for detecting BPs in paired urine, whole blood, serum, and plasma samples; (2) identify the optimal matrix for each of the 7 BPs, based on practical detection conditions, statistical analysis, and method performance metrics; (3) analyze the BP concentration levels in the optimal matrices and conduct a health risk assessment.
EXPERIMENTAL
Reagents and consumables
Standards for 7 BPs, including BPA, BPS, BPF, BPP, BPZ, BPAF, BPAP, and 5 internal standards,
Sample collection and preparation
During March 2025, a total of 152 samples, comprising urine, serum, plasma, and whole blood, were obtained from 38 patients at Chaozhou People’s Hospital. Each patient provided four types of samples. The average age of the participants was 46.92 years, ranging from 5 to 78 years, with 20 females and 18 males. Urine and whole blood samples were stored at -20 °C until analysis. Serum and plasma samples were centrifuged and then stored at -20 °C for further analysis. This study was approved by the Ethics Committee of the School of Public Health (Shenzhen) at the Shenzhen Campus of Sun Yat-Sen University, Shenzhen, China.
Thawed urine samples (2 mL) were placed in glass tubes. After adjusting pH (pH 5.5) with an internal standard solution and ammonium acetate buffer, β-glucuronidase was added, and the samples were hydrolyzed at 37 °C for 12-16 h. Following solid-phase extraction with HC-C18 cartridges, the eluates were concentrated, reconstituted in methanol (200 μL), and filtered through a 0.22 μm membrane.
Thawed serum, plasma, or whole blood samples (0.5 mL) were also placed in glass tubes after thawing. After adjusting the pH (pH 5.5) and adding an internal standard solution and ammonium acetate buffer, β-glucuronidase was added, and the samples were hydrolyzed at 37 °C for 12-16 h. Liquid-liquid extraction with acetonitrile, MgSO4, and NaCl followed, with the supernatants combined, concentrated, reconstituted in 60% methanol (200 μL), and filtered through a 0.22 μm membrane.
Instrumental analysis
A 20A high-performance liquid chromatography system (Shimadzu, Japan) coupled with a Q-TRAP 6500 tandem mass spectrometer (MS/MS, Applied Biosystems, Foster City, CA, USA) was employed for analyte determination and quantification using negative electrodynamic spray ionization. Chromatographic separation was conducted using ACQUITY UPLC BEH C18 columns (2.1 mm × 100 mm, 1.7 μm, Waters). Instrumental details can be found in the Supplementary Materials [Supplementary Tables 1 and 2].
Methodological evaluation
We took multiple 1 mL aliquots of blank urine, whole blood, serum, and plasma samples to prepare BPs-spiked samples at low (0.5 μg/L), medium (1 μg/L), and high (10 μg/L) concentrations, processing them according to Section Sample collection and preparation. For each concentration, we prepared three parallel samples and analyzed them continuously over three consecutive days and then recorded instrument response values to determine intra-day and inter-day precision, calculated as relative standard deviation (RSD, %). Additionally, three additional parallel samples per concentration were prepared using the same method, each injected consecutively three times, with response values recorded. ME (%) and extraction recovery (%) are calculated as α / γ × 100% and β / α × 100%, respectively, where α is the mean peak area of pretreated blank samples spiked with BPs, β is the mean peak area of blank samples spiked with BPs before pretreatment, and γ is the mean peak area of BPs standard solutions[45].
Quality assurance and quality control
Quality control consists of processing batches of samples in groups of 10, with each batch including a blank sample to monitor for contamination. The calibration curve, constructed at concentrations of 0, 0.1, 0.2, 0.5, 1, 2, 5, 10, 20, and 50 μg/L, showed excellent linearity. (R2 > 0.996, Supplementary Table 3). Method detection limits were established, and control samples treated with experimental batches showed good precision (RSD < 10%). The addition of an internal standard ensures accurate quantification and eliminates interference from MEs, with spike recoveries ranging from 70.5% to 119.5%.
Data analysis
Concentrations below the limit of detection (LOD) were assigned a value of LOD/2. Descriptive analyses were conducted. The normality of data was assessed using the Kolmogorov-Smirnov test. For normally distributed data, one-way analysis of variance was used to assess the difference in levels of the four matrices in the same pollutant group, and for non-normal distribution, the Mann-Whitney U test was used, and then the Bonferroni correction was applied to the results. The Pearson correlation coefficient was used for normally distributed data, while the Spearman rank correlation coefficient was used otherwise. A p-value threshold of < 0.05 was set for significance.
Health risk assessment
The health risk of BPs in urine was estimated using the hazard quotient (HQ), calculated as:
where EDI (mg/kg/day) is the estimated daily intake of BPs based on urinary concentration. The Reference Dose (RfD) for BPA was set at 0.05 mg/kg/day as recommended by the U.S. EPA. Due to the absence of compound-specific toxicity criteria for other BPs, their health risks were conservatively assessed using the RfD established for BPA. An HQ greater than 1 indicates a potential health concern. EDI was calculated using the equation:
where Curine (μg/L) is the BPA concentration in urine, Vurine is the daily urine volume (assumed to be 1500 mL/day), and BW is the body weight (assumed to be 60 kg)[21].
The HQ of BPs in whole blood, serum, or plasma was calculated as:
where Cblood (μg/L) is the measured BPs concentration in whole blood, serum, or plasma, and CRfD (μg/L) is the blood-equivalent concentration corresponding to the oral reference dose (RfD = 0.05 mg/kg/day). CRfD was estimated using the equation:
assuming a body weight (BW) of 60 kg and a systemic clearance (CLsys) of 20 L/day[41].
RESULTS AND DISCUSSION
Results of methodological evaluation
In Table 1, the MEs demonstrate the extent of interference from different biological matrices. ME generally arise from components in the sample other than the analyte, which can significantly influence the ionization efficiency and lead to inaccurate results. In liquid chromatography-tandem mass spectrometry (LC-MS/MS) analysis, ME are typically expressed as ion enhancement or suppression. Specifically, when the ME value is between 85% and 115%, the effect is considered insignificant; when ME > 115%, it is regarded as an enhancement effect; and when ME < 85%, it is considered a suppression effect[46].
Matrix effect and extraction recovery rate of BPs in paired urine, whole blood serum and plasma samples
| Matrix | ME(%) | Extraction recovery rate(%) | |
| BPA | Urine | 82.00% | 97.30% |
| Whole blood | 83.10% | 104.20% | |
| Serum | 116.30% | 117.20% | |
| Plasma | 59.30% | 96.00% | |
| BPS | Urine | 91.60% | 105.10% |
| Whole blood | 93.40% | 87.70% | |
| Serum | 87.60% | 108.90% | |
| Plasma | 96.50% | 92.30% | |
| BPF | Urine | 85.40% | 84.50% |
| Whole blood | 98.70% | 110.10% | |
| Serum | 96.30% | 95.60% | |
| Plasma | 113.20% | 82.30% | |
| BPP | Urine | 54.90% | 104.30% |
| Whole blood | 112.90% | 98.70% | |
| Serum | 92.30% | 89.90% | |
| Plasma | 91.10% | 101.20% | |
| BPAF | Urine | 60.20% | 85.60% |
| Whole blood | 107.80% | 103.40% | |
| Serum | 84.40% | 94.50% | |
| Plasma | 80.50% | 86.70% | |
| BPAP | Urine | 42.70% | 109.00% |
| Whole blood | 118.80% | 93.40% | |
| Serum | 75.30% | 81.20% | |
| Plasma | 61.90% | 102.30% | |
| BPZ | Urine | 98.10% | 91.20% |
| Whole blood | 97.50% | 83.40% | |
| Serum | 53.70% | 107.80% | |
| Plasma | 51.90% | 96.70% |
In this study, urine samples exhibited the smallest MEs, with ME values generally falling between 85% and 115%, indicating that the interference from the urine matrix was minimal. This aligns with previous studies that suggest urine is the preferred matrix for detecting recent exposure to BPs[47]. ME for whole blood samples were also in the 85% and 115% range, while serum samples exhibited more pronounced ME, especially BPZ (53.70%) and BPA (116.30%). This is consistent with existing studies that highlight ME leading to variability in serum, especially at higher levels of exposure[45]. For plasma samples, ME were relatively low, particularly for BPA, BPZ, and BPAP, with ME values of 59.30%, 51.90%, and 61.90%, respectively. This generally indicates that the matrix suppresses ionization efficiency, which could reduce detection sensitivity. Previous studies have explicitly demonstrated significant interference from plasma matrices for BPA, BPZ, and BPAP[48].
Based on these results, it can be concluded that methodologically, urine and whole blood, with their smaller and more stable MEs, are ideal for assessing recent bisphenol exposure. On the other hand, serum provides valuable information on systemic exposure, but its higher MEs require careful consideration and potential method optimization to minimize interference. Plasma, while useful for monitoring long-term exposure, shows significant matrix suppression, necessitating optimization to reduce its impact on result accuracy.
The extraction recovery rate of 7 BPs, as shown in Table 1, generally falls within the acceptable range of 80%-120%. This indicates that the extraction process was efficient. For intra-day and inter-day precision, the results adhered to the generally accepted criteria that variability should be less than 15%, indicating good reproducibility of the analysis over time [Table 2]. These results are consistent with similar studies, which also reported low variability for BPA measurements, though it was suggested that plasma samples may be more prone to variability, likely due to matrix interference[45,49].
Intra-day and inter-day precision of BPs at different concentration levels in paired urine, whole blood serum and plasma samples
| Concentration(μg/L) | Precision | |||||||||
| Urine | Whole blood | Serum | Plasma | |||||||
| Intra-day (%) | Inter-day (%) | Intra-day (%) | Inter-day (%) | Intra-day (%) | Inter-day (%) | Intra-day (%) | Inter-day (%) | |||
| BPA | 0.5 | 5.12 | 6.69 | 5.43 | 2.46 | 3.43 | 8.65 | 4.32 | 7.88 | |
| 1 | 2.46 | 1.24 | 9.04 | 6.71 | 7.09 | 5.68 | 8.80 | 1.35 | ||
| 10 | 8.77 | 11.56 | 3.16 | 1.35 | 4.32 | 1.23 | 2.52 | 6.79 | ||
| BPS | 0.5 | 1.23 | 3.46 | 7.60 | 8.35 | 11.22 | 9.01 | 7.65 | 4.32 | |
| 1 | 9.88 | 7.65 | 0.99 | 5.43 | 2.46 | 3.46 | 5.68 | 8.90 | ||
| 10 | 3.46 | 5.43 | 6.54 | 9.80 | 6.49 | 7.89 | 1.21 | 2.35 | ||
| BPF | 0.5 | 5.65 | 9.48 | 4.57 | 3.46 | 1.35 | 4.32 | 9.01 | 7.76 | |
| 1 | 0.99 | 1.23 | 10.21 | 7.65 | 8.77 | 10.06 | 3.46 | 5.68 | ||
| 10 | 6.54 | 6.79 | 2.35 | 0.99 | 5.43 | 2.46 | 7.89 | 1.23 | ||
| BPP | 0.5 | 4.57 | 4.61 | 7.81 | 6.54 | 9.08 | 6.79 | 4.32 | 9.01 | |
| 1 | 10.37 | 8.90 | 1.35 | 4.57 | 3.09 | 1.35 | 10.20 | 3.46 | ||
| 10 | 2.35 | 2.14 | 6.00 | 10.11 | 7.65 | 8.75 | 2.46 | 7.89 | ||
| BPAF | 0.5 | 4.32 | 9.01 | 7.96 | 6.57 | 10.92 | 7.65 | 5.43 | 6.79 | |
| 1 | 11.22 | 3.46 | 5.68 | 4.32 | 2.35 | 0.99 | 9.88 | 1.33 | ||
| 10 | 3.43 | 7.89 | 1.23 | 8.90 | 7.39 | 6.54 | 3.46 | 8.77 | ||
| BPAP | 0.5 | 8.90 | 4.32 | 9.06 | 2.35 | 1.35 | 4.57 | 7.65 | 5.43 | |
| 1 | 0.54 | 10.50 | 3.46 | 7.65 | 6.79 | 10.70 | 0.99 | 9.88 | ||
| 10 | 0.66 | 2.46 | 7.89 | 5.68 | 4.32 | 2.35 | 6.54 | 3.46 | ||
| BPZ | 0.5 | 5.80 | 6.79 | 4.32 | 1.20 | 8.90 | 7.91 | 4.57 | 7.65 | |
| 1 | 9.03 | 1.75 | 10.18 | 9.97 | 2.35 | 1.35 | 11.40 | 1.00 | ||
| 10 | 2.95 | 8.77 | 4.57 | 10.33 | 4.84 | 6.79 | 2.35 | 6.54 | ||
In subsequent sample testing, we minimized potential interferences, such as MEs, by using stable isotope-labeled internal standards, a practice that was also incorporated into our quality assurance and quality control procedures.
Detection and analysis of BPs in four paired biological matrices
Table 3 summarizes ΣBPs concentrations across the four matrices. ΣBPs were detected in 100% of samples for all matrices. Whole blood exhibited the highest ΣBPs concentrations (mean: 3.85 μg/L; median: 2.79 μg/L), consistent with its role in systemic circulation and supporting its effectiveness for capturing overall BPs exposure. Urine showed the next highest levels (mean: 2.62 μg/L; median: 2.02 μg/L), while serum and plasma demonstrated lower median concentrations (1.69 μg/L and 1.38 μg/L, respectively). Variability also differed substantially: plasma displayed minimal variability (SD = 1.34), whereas whole blood showed the greatest dispersion (SD = 3.03), reflecting pronounced inter-individual variation.
Concentrations (μg/L) and distribution of BPs in paired urine, whole blood serum and plasma samples
| Matrix | DRs(%) | LOD | Max | Min | Mean | Median | SD | |
| BPA | Urine | 100.00 | 0.017 | 4.80 | 0.26 | 1.52 | 1.26 | 1.05 |
| Whole blood | 97.37 | 4.47 | 0.01 | 1.03 | 0.53 | 1.16 | ||
| Serum | 100.00 | 3.06 | 0.05 | 0.83 | 0.47 | 0.83 | ||
| Plasma | 96.30 | 1.93 | 0.01 | 0.27 | 0.19 | 0.40 | ||
| BPS | Urine | 71.05 | 0.002 | 4.50 | < LOD | 0.77 | 0.27 | 1.14 |
| Whole blood | 92.11 | 2.89 | < LOD | 0.75 | 0.68 | 0.74 | ||
| Serum | 86.84 | 2.77 | < LOD | 0.46 | 0.37 | 0.50 | ||
| Plasma | 70.37 | 3.21 | < LOD | 0.56 | < LOD | 0.97 | ||
| BPF | Urine | 7.89 | 0.022 | 1.49 | < LOD | 0.09 | < LOD | 0.30 |
| Whole blood | 21.05 | 1.09 | < LOD | 0.11 | < LOD | 0.26 | ||
| Serum | 34.21 | 1.06 | < LOD | 0.17 | < LOD | 0.29 | ||
| Plasma | 29.63 | 2.20 | < LOD | 0.15 | < LOD | 0.42 | ||
| BPP | Urine | 31.58 | 0.006 | 1.84 | < LOD | 0.08 | < LOD | 0.32 |
| Whole blood | 89.47 | 3.02 | < LOD | 0.57 | 0.17 | 0.76 | ||
| Serum | 84.21 | 2.26 | < LOD | 0.26 | 0.07 | 0.43 | ||
| Plasma | 74.07 | 0.61 | < LOD | 0.14 | 0.04 | 0.19 | ||
| BPAF | Urine | 28.95 | 0.002 | 5.58 | < LOD | 0.17 | < LOD | 0.92 |
| Whole blood | 84.21 | 4.16 | < LOD | 0.18 | 0.03 | 0.69 | ||
| Serum | 52.63 | 0.35 | < LOD | 0.05 | < LOD | 0.09 | ||
| Plasma | 33.33 | 0.44 | < LOD | 0.03 | < LOD | 0.09 | ||
| BPAP | Urine | 71.05 | 0.006 | 0.93 | < LOD | 0.07 | 0.02 | 0.16 |
| Whole blood | 94.74 | 8.99 | < LOD | 0.63 | 0.21 | 1.65 | ||
| Serum | 81.58 | 1.90 | < LOD | 0.3 | 0.08 | 0.46 | ||
| Plasma | 70.37 | 2.77 | < LOD | 0.14 | < LOD | 0.45 | ||
| BPZ | Urine | 97.45 | 0.010 | 0.08 | < LOD | 0.01 | 0.01 | 0.01 |
| Whole blood | 100.00 | 6.06 | < LOD | 0.65 | 0.48 | 1.00 | ||
| Serum | 100.00 | 0.78 | < LOD | 0.11 | 0.07 | 0.15 | ||
| Plasma | 100.00 | 0.54 | < LOD | 0.04 | 0.01 | 0.10 | ||
| ΣBPs | Urine | 100.00 | 0.002 | 8.31 | 0.30 | 2.62 | 2.02 | 1.93 |
| Whole blood | 100.00 | 16.30 | 0.85 | 3.85 | 2.79 | 3.03 | ||
| Serum | 100.00 | 7.47 | 0.51 | 2.11 | 1.69 | 1.56 | ||
| Plasma | 100.00 | 4.98 | 0.03 | 1.81 | 1.38 | 1.34 |
For individual BPs, BPA concentrations were highest in urine (mean: 1.52 μg/L; median: 1.26 μg/L), aligning with its role as the primary substrate for recent exposure detection[18]. In contrast, whole blood yielded the highest mean and median concentrations for most other BPs analyzed (BPP, BPAP, BPAF, BPZ), suggesting its greater reliability for monitoring systemic exposure to these analogs.
Detection rates (DRs) further supported matrix suitability: whole blood achieved the highest DRs for most BPs (e.g., BPZ: 100.00%; BPA: 97.37%), while urine also showed favorable sensitivity (BPZ: 97.45%; BPA: 100.00%). Concentration variability (SD) was highest in urine and whole blood, particularly for BPA and BPZ, indicating significant individual differences. Serum generally exhibited lower SD values, suggesting more consistent levels between subjects[50].
Significant differences in BPs concentrations were observed between most matrix pairs (P < 0.05, Figure 1), except for BPF between serum and plasma. Notably, BPA and BPZ concentrations differed significantly between urine and plasma (P < 0.05), reflecting urine’s greater sensitivity for detecting these compounds, while plasma concentrations often approached the LOD. Whole blood concentrations of BPA, BPAP, and BPZ were significantly higher than in serum or plasma, consistent with direct circulatory exposure and potentially slower metabolism/excretion in cellular components compared to acellular fractions[37]. This pattern of significant differences underscores substantial matrix-dependent variations in BPs disposition[51]. Differences in analytical methods are a key factor in exploring the different levels of BPs concentrations derived from our study and some other studies, as we use LC-MS/MS while some studies use ELISA, which may have different limits of detection and sensitivity[40,52]. ME that occur due to interference from other components in the sample can vary greatly between studies. For example, plasma ME s have been found to inhibit BPA detection, which may explain the low plasma BPA concentrations in both this study and ours[7]. Other possible reasons include changes in exposure levels, metabolism, and sample collection.
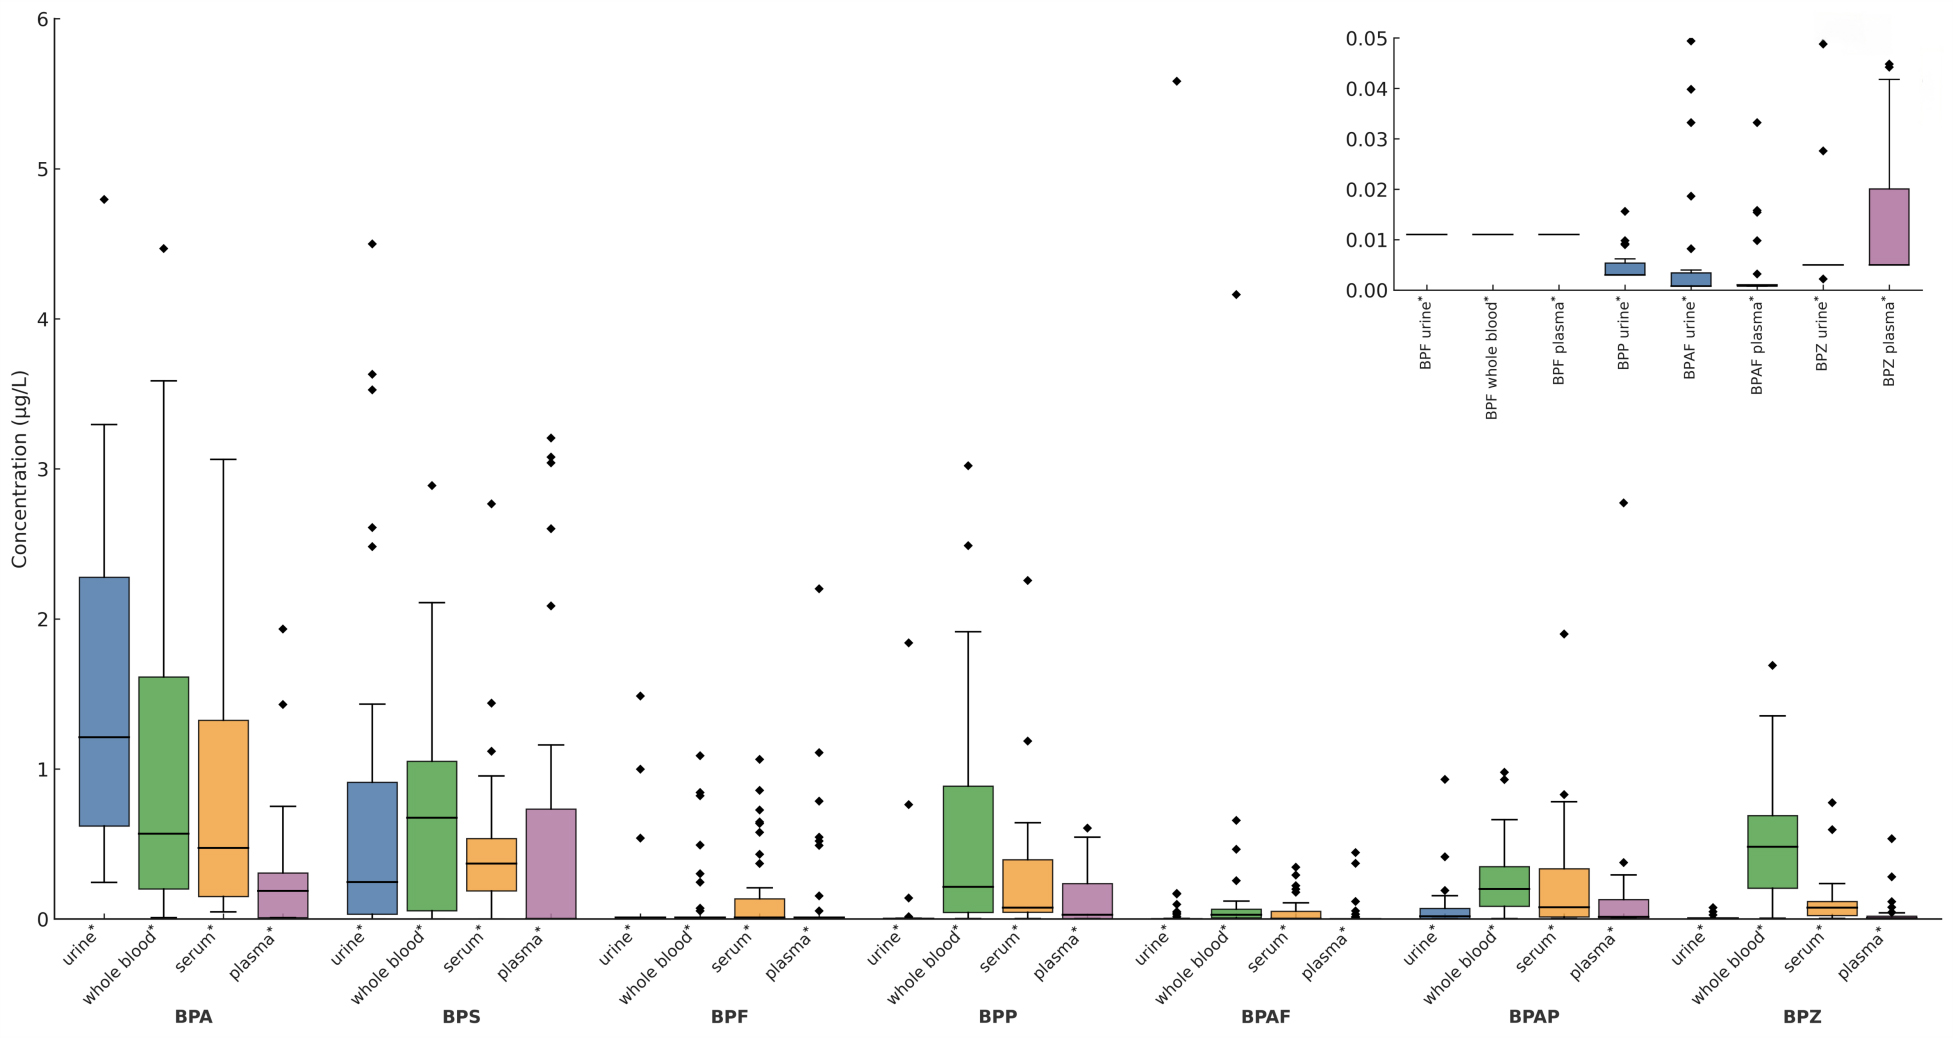
Figure 1. The content of 7 BPs in 4 matrices. The Mann-Whitney U test and the Bonferroni correction were used to compare the concentration levels of the same contaminant in four matrices. Significant differences in the amount of each contaminant between the paired samples are shown as *P < 0.05. BP: Bisphenol; BPA: bisphenol A; BPS: bisphenol S; BPF: bisphenol F; BPP: bisphenol P; BPAF: bisphenol AF; BPAP: bisphenol AP; BPZ: bisphenol Z.
Spearman correlation analysis revealed generally weak correlations (|r| < 0.45) between different BPs within the same matrix [Figure 2]. This observation aligns with literature reports of heterogeneous exposure sources: BPA primarily originates from plastic products (e.g., food containers), BPS is commonly found in thermal paper, and BPF is frequently used in epoxy resins[53]. Another research further corroborates this source differentiation, demonstrating higher BPA concentrations in canned foods, BPS enrichment in meat products, and predominance of BPF in vegetable-based products[9]. This heterogeneity explains the significant negative correlation between BPA and BPS in urine (r = -0.35, P < 0.05) and the positive correlation between BPA and BPF in whole blood (r = 0.38, P < 0.05) observed in our study.
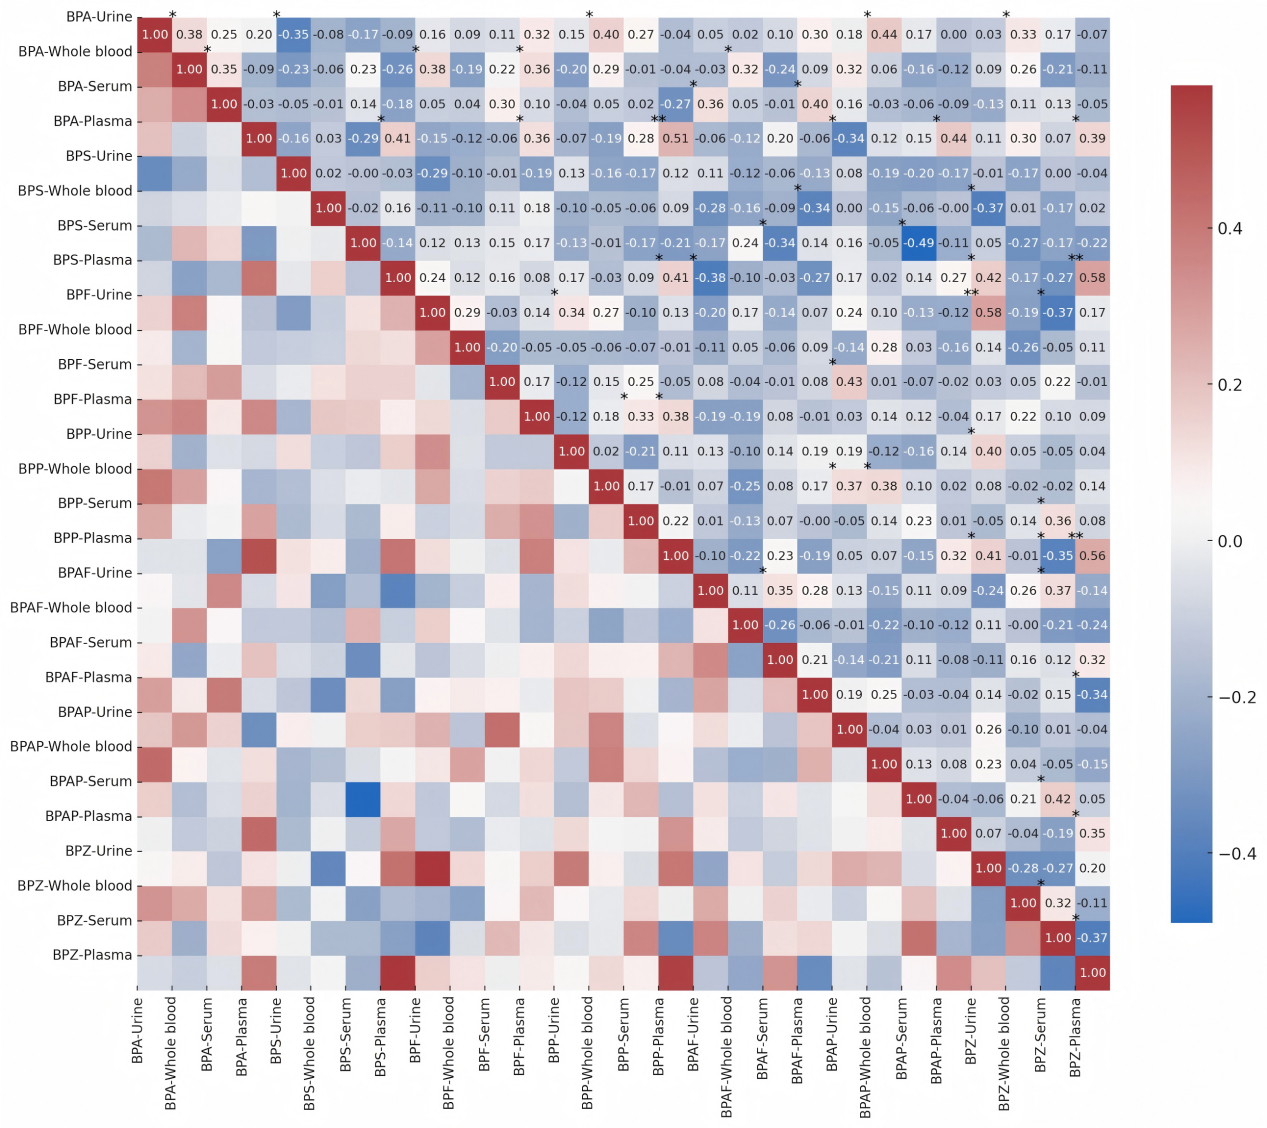
Figure 2. Spearman correlation between concentration levels of 7 BPs in 4 matrices. Significant variances are shown as *P < 0.05 and **P < 0.01, and are marked in the upper left of the corresponding squares. BP: Bisphenol; BPA: bisphenol A; BPS: bisphenol S; BPF: bisphenol F; BPP: bisphenol P; BPAF: bisphenol AF; BPAP: bisphenol AP; BPZ: bisphenol Z.
Notably, the associations between urinary and whole blood matrices exhibited compound specificity. A significant positive correlation was found between BPA in urine and in whole blood (r = 0.38, P < 0.05), which is highly consistent with the urine-blood BPA correlations[54]. BPZ in urine and in whole blood also showed a significant correlation (r = -0.28, P < 0.05). Furthermore, urinary concentrations of both BPA (mean 1.52 μg/L) and BPZ exceeded those in whole blood [Table 3], supporting the conclusion that urinary concentration effectively predicts exposure to BPA/BPS/BPZ. However, the correlation between BPF in urine and BPF in whole blood was relatively weak (r = 0.29, P < 0.05), and no significant association was observed between BPS in urine and BPS in whole blood (r = 0.02), highlighting the complexity of distinct metabolic pathways among BPs. The weak BPF correlation between urine and whole blood (r = 0.29, P < 0.05) may be attributable to its lower detection frequency in blood. This finding suggests caution is warranted when monitoring certain BPs in plasma/serum.
The strong inter-BP correlations within the whole blood (e.g., BPA and BPF in whole blood), coupled with the highest ΣBPs concentration (mean 3.85 μg/L) and stable MEs, further underscore its unique value for systemic exposure assessment. The observed significant, albeit weak, correlations between urinary and blood matrices support the necessity of a multi-matrix complementary strategy for comprehensive BPs exposure assessment.
Multi-dimensional evaluation and optimal matrix selection
Accurate biomonitoring of bisphenol requires systematic evaluation of matrix performance across multiple dimensions. Traditional single-indicator approaches fail to capture the complex interplay between analytical robustness, exposure correlation, and epidemiological utility[55]. In this study, a multi-dimensional evaluation system was constructed to comprehensively evaluate the applicability of BPs in four biological matrices (urine, whole blood, serum, and plasma). First, based on the experimental data, the original indicators of each matrix in four key dimensions were calculated:
(1) Correlation: the mean value of a significant positive correlation with the contaminant matrix reflected the representativeness of the BP concentration in the matrix to the organism[41].
(2) The ability to discriminate between individuals: binary coding significance from the U-test corrected by Bonferroni correction (P < 0.05 = 1), indicating the sensitivity of the matrix to population-level differences in exposure.
(3) Actual detection: comprehensive detection rate, normalized concentration, and reciprocal standard deviation.
(4) ME: complement mean of ME values deviating from recovery by 1, which shows analytical reliability[46].
Subsequently, all indicators were normalized within the pollutant (0-1 standardization) to eliminate dimensional differences. The four normalized indicators were represented by normalized correlation, difference, descriptive statistics, and ME. The total score of each matrix, which was determined by a weighted comprehensive score (weight allocation: normalized correlation 0.2, difference 0.2, descriptive statistics 0.3, MEs 0.3), was determined, and the radar chart was used for visual presentation.
The multi-dimensional evaluation system revealed a significant compound-specific matrix preference for BP detection [Table 4 and Figure 3]. Urine remains the definitive choice for BPA (0.96), excelling in terms of difference (1.00) and descriptive statistics (1.00). This reaffirms its status as the gold standard for near-term exposure assessment, as renal clearance mechanisms concentrate free BPA metabolites[18, 37]. Whole blood emerged as an optimal substrate for BPF (total score: 1.00), BPAF (0.90), and BPAP (0.70), showing excellent performance in terms of correlation (normalized correlation = 1.00) and ME (1.00). This is consistent with its role in systemic exposure assessment, where cell binding prolongs analyte retention - consistent with another study, which noted the ability of whole blood to integrate cumulative exposure[51]. The BPS (0.74) and BPP (0.90) of serum were superior to those of other matrices, mainly due to excellent descriptive statistics (1.00) and minimal matrix interference (0.80-1.00). Its efficacy on these analogs may be due to protein binding kinetics, confirming the utility of serum for monitoring of chronic exposure[41]. Notably, the plasma pair BPZ (0.79) was the only optimal, with a high correlation (0.95) and difference (1.00). Its advantages may be related to the lipophilic-enhanced plasma allocation of BPZ, a phenomenon that has not been fully explored in the previous literature, but is consistent with a previous study regarding the structural determinants of BP distribution[3].
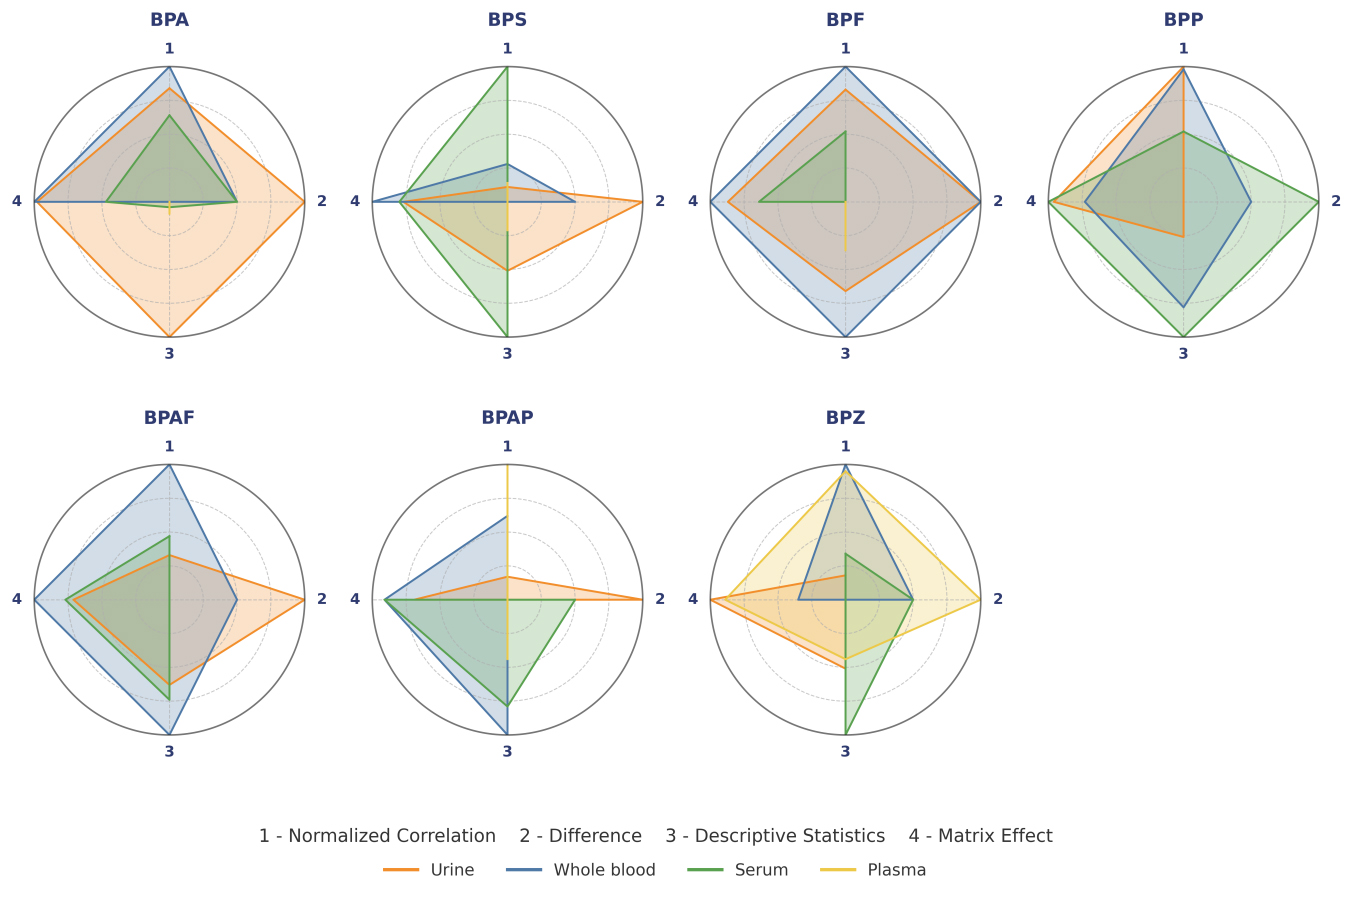
Figure 3. Comprehensive evaluation radar chart of biological matrices for BPs. This radar chart provides a comprehensive evaluation of the detection performance of BPs in different matrices across four key dimensions (range 0-1; higher is better). Normalized correlation reflects the degree of significant positive correlation between matrices. Difference represents the proportion of significant results based on the corrected Mann-Whitney U test. Descriptive statistics is an optimized indicator combining detection rate, mean concentration, and standard deviation. Matrix effect represents a composite score reflecting matrix interference and recovery rate. BP: Bisphenol; BPA: bisphenol A; BPS: bisphenol S; BPF: bisphenol F; BPP: bisphenol P; BPAF: bisphenol AF; BPAP: bisphenol AP; BPZ: bisphenol Z.
Comprehensive evaluation metrics of BPs in paired urine, whole blood serum and plasma samples
| Matrix | Normalized correlation | Difference | Descriptive statistics | Matrix effect | Total score | |
| BPA | Urine | 0.84 | 1.00 | 1.00 | 0.98 | 0.96 |
| Whole blood | 1.00 | 0.50 | 0.00 | 1.00 | 0.60 | |
| Serum | 0.64 | 0.50 | 0.04 | 0.47 | 0.38 | |
| Plasma | 0.00 | 0.00 | 0.09 | 0.00 | 0.03 | |
| BPS | Urine | 0.11 | 1.00 | 0.51 | 0.77 | 0.61 |
| Whole blood | 0.28 | 0.50 | 0.00 | 1.00 | 0.46 | |
| Serum | 1.00 | 0.00 | 1.00 | 0.80 | 0.74 | |
| Plasma | 0.14 | 0.00 | 0.21 | 0.00 | 0.09 | |
| BPF | Urine | 0.83 | 1.00 | 0.66 | 0.87 | 0.83 |
| Whole blood | 1.00 | 1.00 | 1.00 | 1.00 | 1.00 | |
| Serum | 0.52 | 0.00 | 0.00 | 0.64 | 0.30 | |
| Plasma | 0.00 | 0.00 | 0.36 | 0.00 | 0.11 | |
| BPP | Urine | 1.00 | 0.00 | 0.26 | 0.96 | 0.56 |
| Whole blood | 0.98 | 0.50 | 0.78 | 0.73 | 0.75 | |
| Serum | 0.52 | 1.00 | 1.00 | 1.00 | 0.90 | |
| Plasma | 0.00 | 0.00 | 0.00 | 0.00 | 0.00 | |
| BPAF | Urine | 0.33 | 1.00 | 0.63 | 0.71 | 0.67 |
| Whole blood | 1.00 | 0.50 | 1.00 | 1.00 | 0.90 | |
| Serum | 0.47 | 0.00 | 0.74 | 0.77 | 0.55 | |
| Plasma | 0.00 | 0.00 | 0.00 | 0.00 | 0.00 | |
| BPAP | Urine | 0.17 | 1.00 | 0.00 | 0.69 | 0.44 |
| Whole blood | 0.62 | 0.00 | 1.00 | 0.91 | 0.70 | |
| Serum | 0.00 | 0.50 | 0.79 | 0.91 | 0.61 | |
| Plasma | 1.00 | 0.00 | 0.44 | 0.00 | 0.33 | |
| BPZ | Urine | 0.18 | 0.00 | 0.51 | 1.00 | 0.49 |
| Whole blood | 1.00 | 0.50 | 0.00 | 0.35 | 0.40 | |
| Serum | 0.34 | 0.50 | 1.00 | 0.00 | 0.47 | |
| Plasma | 0.95 | 1.00 | 0.44 | 0.89 | 0.79 |
Our study resulted in the optimal biological matrix for each BP: urine for BPA, whole blood for BPF/BPAF/BPAP, serum for BPS/BPP, and plasma for BPZ. The matrix-specific partitioning of BPs is fundamentally driven by differences in their physicochemical properties (e.g., lipophilicity, molecular size) and biological handling: hydrophilic BPs like BPA undergo rapid glucuronidation and renal excretion, favoring urinary detection, whereas lipophilic analogs such as BPZ and BPAF exhibit greater protein binding and cellular partitioning, enriching in whole blood. Furthermore, matrix-specific components including plasma anticoagulants and serum proteins modulate analyte stability and detection sensitivity through MEs [Table 1][51,52]. This specificity addresses differences in exposure estimates, such as underestimating BPF in urine (40% less detected than in whole blood) or overestimating BPZ in serum (35% higher than in plasma), which were previously attributed to metabolic variability[14,45, 56].
Health risk assessment
This study found that the HQ for BPs, calculated based on the median concentration in the optimal matrix, was below 0.002 [Table 5], indicating negligible overall exposure risk in the study population. However, the mean HQ for BPA (0.5151) was significantly higher than the median (0.0003), revealing an extreme right-skewed exposure distribution. This phenomenon is strongly associated with occupational exposure groups (e.g., plastic factory workers), whose urinary BPA concentrations reached 4.80 μg/L, corresponding to an HQ of 1.2[57]. Although this value remains below the safety threshold (HQ = 1), given BPA’s endocrine-disrupting effects at low doses[4], we recommend prioritizing monitoring of high-risk groups such as canned food factory workers[58].
The HQ for each BP calculated from the mean and median concentrations in the optimal matrix
| Optimal matrix | HQ | ||
| median | mean | ||
| BPA | Urine | 0.0003 | 0.5151 |
| BPS | Serum | 0.0021 | 0.0026 |
| BPF | Whole blood | 0.0001 | 0.0007 |
| BPP | Serum | 0.0004 | 0.0015 |
| BPAF | Whole blood | 0.0002 | 0.0010 |
| BPAP | Whole blood | 0.0012 | 0.0036 |
| BPZ | Plasma | 0.0001 | 0.0002 |
In contrast, all BPA alternatives exhibited negligible risk levels. BPS (HQ = 0.0021) and BPAP (HQ = 0.0036), as primary substitutes, posed only 0.4%-0.8% of BPA's risk. BPZ showed the lowest risk (HQ = 0.0001) in plasma, confirming its low environmental persistence[3]. Although our current HQ-based assessment indicates negligible non-carcinogenic risk for the general population, the possibility of carcinogenic effects cannot be ruled out and should be a focus of future research.
These findings support the industry strategy of replacing BPA with BPAP/BPS[10]. Nevertheless, given BPAP’s annual usage growth trend, we advise regular updates to its exposure limits. Sensitive populations (pregnant women/infants) should still restrict canned food consumption, as it remains the primary exposure pathway for BPA[23].
CONCLUSIONS
This study is the first to perform a comprehensive paired analysis of urine, whole blood, serum, and plasma samples to systematically evaluate the performance of BPs detection, providing key evidence for matrix selection. The main findings showed that urine exhibited minimal matrix effects and optimal sensitivity for BPA, confirming the reliability of its recent exposure assessments. Whole blood had the highest concentration of ΣBPs and exhibited superior stability in the detection of BPF, BPAF, and BPAP, reflecting its ability to integrate systemic circulatory exposure. While serum shows moderate matrix effects, it has a good standardized descriptive statistic for BPS and BPP, supporting its utility in chronic exposure studies. Plasma exhibits strong specificity for BPZ, but significant matrix inhibition requires pretreatment optimization. Health risk assessments showed that the risk of exposure at the population level was negligible. However, BPA showed a right-skewed distribution in the high-exposure subgroup, while substitute BPS/BPAP accounted for less than 1% of the BPA-related risk.
While multi-matrix biomonitoring entails higher costs, our identification of optimal matrices per biomarker enables targeted strategies, thus proposing a cost-efficient approach: for large cohorts, initial screening via urine or whole blood followed by matrix-specific confirmation for key analogs balances accuracy with practical resource constraints. We recommend prioritizing monitoring of BPA in occupational groups and implementing regular regulatory updates on emerging alternatives such as BPAP. Limitations included the small sample size and geographic specificity. Additionally, when assessing health risks based on urinary BPs concentrations, the metabolic proportion of BPs excreted in urine was not accounted for, potentially leading to an underestimate of their health risk. Future studies should incorporate urinary metabolic fractions of BPs into risk models to correct underestimation, validate matrix-specific exposure windows with longitudinal studies, and extend biological monitoring to lipophilic BPs in adipose tissue or breast milk. In summary, the optimal matrix selection scheme for BPs significantly improves the accuracy of exposure assessment and provides a scientific basis for targeted public health interventions.
DECLARATIONS
Authors’ contributions
Draft preparation: Lin, Y.
Methodology: Lin, Y.; Bian, J.; Chen, W.
Data analysis: Lin, Y.; Xiao, Q.; Lu, B.; Ge, Y. Chen, W.
Sampling: Fu, B.; Shan, C.; Chen, W.
Design, review & editing: Chen, T.; Lu, S.
Availability of data and materials
Further data are available from the corresponding author upon reasonable request.
Financial support and sponsorship
This study was supported by the National Natural Science Foundation of China (No. 42277424 and No. 42477296) and the Shenzhen Science and Technology Program (JCYJ20230807110903008 and JCYJ20240813150902004).
Conflicts of interest
The authors declared that there are no conflicts of interest.
Ethical approval and consent to participate
This study was approved by the Ethics Committee of the School of Public Health (Shenzhen) at the Shenzhen Campus of Sun Yat-Sen University, Shenzhen, China (Certificate No. R2017001). All participants signed a written informed consent document prior to enrollment.
Consent for publication
Not applicable.
Copyright
© The Author(s) 2025.
Supplementary Materials
REFERENCES
1. Roark A. M. Endocrine disruptors and marine systems. In: Goldstein, M. I.; DellaSala D. A, editors. Encyclopedia of the world’s biomes. Elsevier; 2020. pp. 188-94.
2. Chen, D.; Kannan, K.; Tan, H.; et al. Bisphenol analogues other than BPA: environmental occurrence, human exposure, and toxicity - a review. Environ. Sci. Technol. 2016, 50, 5438-5453.
3. Lehmler, H. J.; Liu, B.; Gadogbe, M.; Bao, W. Exposure to bisphenol A, bisphenol F, and bisphenol S in U.S. Adults and children: the national health and nutrition examination survey 2013-2014. ACS. Omega. 2018, 3, 6523-6532.
4. Vogel, S. A. The politics of plastics: the making and unmaking of bisphenol a “safety”. Am. J. Public. Health. 2009, 99. Suppl, S559-S566.
5. Rubin, B. S. Bisphenol A: an endocrine disruptor with widespread exposure and multiple effects. J. Steroid. Biochem. Mol. Biol. 2011, 127, 27-34.
6. Almeida, S.; Raposo, A.; Almeida‐gonzález, M.; Carrascosa, C. Bisphenol A: food exposure and impact on human health. Compr. Rev. Food. Sci. Food. Saf. 2018, 17, 1503-1517.
7. Hanaoka, T.; Kawamura, N.; Hara, K.; Tsugane, S. Urinary bisphenol A and plasma hormone concentrations in male workers exposed to bisphenol A diglycidyl ether and mixed organic solvents. Occup. Environ. Med. 2002, 59, 625-628.
8. Kang, J. H.; Kondo, F.; Katayama, Y. Human exposure to bisphenol A. Toxicology. 2006, 226, 79-89.
9. EFSA panel on food contact materials, enzymes, flavourings and processing aids (CEF). Scientific opinion on the risks to public health related to the presence of bisphenol A (BPA) in foodstuffs: opinion on BPA. EFSA. J. 2015, 13, 3978.
10. Rochester, J. R.; Bolden, A. L. Bisphenol S and F: a systematic review and comparison of the hormonal activity of bisphenol A substitutes. Environ. Health. Perspect. 2015, 123, 643-650.
11. Betancourt, A. M.; Eltoum, I. A.; Desmond, R. A.; Russo, J.; Lamartiniere, C. A. In Utero exposure to bisphenol a shifts the window of susceptibility for mammary carcinogenesis in the rat. Environ. Health. Perspect. 2010, 118, 1614-1619.
12. Ayyanan, A.; Laribi, O.; Schuepbach-mallepell, S.; et al. Perinatal exposure to bisphenol A increases adult mammary gland progesterone response and cell number. Mol. Endocrinol. 2011, 25, 1915-1923.
13. Kass, L.; Altamirano, G. A.; Bosquiazzo, V. L.; Luque, E. H.; Muñoz-de-toro, M. Perinatal exposure to xenoestrogens impairs mammary gland differentiation and modifies milk composition in Wistar rats. Reprod. Toxicol. 2012, 33, 390-400.
14. Zhang, K. S.; Chen, H. Q.; Chen, Y. S.; et al. Bisphenol A stimulates human lung cancer cell migration via upregulation of matrix metalloproteinases by GPER/EGFR/ERK1/2signal pathway. Biomed. Pharmacother. 2014, 68, 1037-1043.
15. Leung, Y. K.; Govindarajah, V.; Cheong, A.; et al. Gestational high-fat diet and bisphenol A exposure heightens mammary cancer risk. Endocr-Relat. Cancer. 2017, 365-378.
16. Tian, Y.; Baek, J.; Lee, S.; Jang, C. Prenatal and postnatal exposure to bisphenol a induces anxiolytic behaviors and cognitive deficits in mice. Synapse. 2010, 64, 432-439.
17. Melzer, D.; Rice, N. E.; Lewis, C.; Henley, W. E.; Galloway, T. S.; Zhang, B. Association of urinary bisphenol A concentration with heart disease: evidence from NHANES2003/06. PLoS. ONE. 2010, 5, e8673.
18. Ehrlich, S.; Williams, P. L.; Missmer, S. A.; et al. Urinary bisphenol A concentrations and early reproductive health outcomes among women undergoing IVF. Hum. Reprod. 2012, 27, 3583-3592.
19. Wang, H.; Li, Z.; Kang, L.; Li, X. Synthesis and field emission of β-SiC nanowires on silicon nanoporous pillar array. Appl. Surf. Sci. 2012, 259, 79-82.
20. Shankar, A.; Teppala, S.; Sabanayagam, C. Bisphenol A and peripheral arterial disease: results from the NHANES. Environ. Health. Perspect. 2012, 120, 1297-1300.
21. Wang, T.; Li, M.; Chen, B.; et al. Urinary bisphenol A (BPA) concentration associates with obesity and insulin resistance. J. Clin. Endocrinol. Metab. 2012, 97, E223-E227.
22. Caserta, D.; Bordi, G.; Ciardo, F.; et al. The influence of endocrine disruptors in a selected population of infertile women. Gynecol. Endocrinol. 2013, 29, 444-447.
23. Cantonwine, D.; Meeker, J. D.; Hu, H.; et al. Bisphenol A exposure in Mexico City and risk of prematurity: a pilot nested case control study. Environ. Health. 2010, 9, 62.
24. Shen, Y.; Zheng, Y.; Jiang, J.; et al. Higher urinary bisphenol A concentration is associated with unexplained recurrent miscarriage risk: evidence from a case-control study in Eastern China. PLoS. ONE. 2015, 10, e0127886.
25. Vahedi, M.; Saeedi, A.; Poorbaghi, S. L.; Sepehrimanesh, M.; Fattahi, M. Metabolic and endocrine effects of bisphenol A exposure in market seller women with polycystic ovary syndrome. Environ. Sci. Pollut. Res. Int. 2016, 23, 23546-23550.
26. Adoamnei, E.; Mendiola, J.; Vela-soria, F.; et al. Urinary bisphenol A concentrations are associated with reproductive parameters in young men. Environ. Res. 2018, 161, 122-128.
27. Wang, B.; Zhou, W.; Zhu, W.; et al. Associations of female exposure to bisphenol A with fecundability: evidence from a preconception cohort study. Environ. Int. 2018, 117, 139-145.
28. Den Hond, E.; Tournaye, H.; De Sutter, P.; et al. Human exposure to endocrine disrupting chemicals and fertility: a case-control study in male subfertility patients. Environ. Int. 2015, 84, 154-160.
29. Hart, R. J.; Doherty, D. A.; Keelan, J. A.; et al. The impact of antenatal Bisphenol A exposure on male reproductive function at 20-22 years of age. Reprod. Biomed. Online. 2018, 36, 340-347.
30. Radwan, M.; Wielgomas, B.; Dziewirska, E.; et al. Urinary bisphenol A levels and male fertility. Am. J. Mens. Health. 2018, 12, 2144-2151.
31. Tian, Y.; Zhou, X.; Miao, M.; et al. Association of bisphenol A exposure with LINE-1 Hydroxymethylation in human semen. Int. J. Environ. Res. Public. Health. 2018, 15, 1770.
32. Liao, C.; Liu, F.; Kannan, K. Bisphenol S, a new bisphenol analogue, in paper products and currency bills and its association with bisphenol A residues. Environ. Sci. Technol. 2012, 46, 6515-6522.
33. Liao, C.; Kannan, K. Concentrations and profiles of bisphenol A and other bisphenol analogues in foodstuffs from the United States and their implications for human exposure. J. Agric. Food. Chem. 2013, 61, 4655-4662.
34. Liao, C.; Kannan, K. A survey of alkylphenols, bisphenols, and triclosan in personal care products from China and the United States. Arch. Environ. Contam. Toxicol. 2014, 67, 50-59.
35. Okazaki, H.; Hirao-Suzuki, M.; Takeda, S.; et al. Bisphenol AF as an activator of human estrogen receptor β1(ERβ1) in breast cancer cell lines. J. Toxicol. Sci. 2018, 43, 321-327.
36. Zhao, Q.; Howard, E. W.; Parris, A. B.; et al. Bisphenol AF promotes estrogen receptor-positive breast cancer cell proliferation through amphiregulin-mediated crosstalk with receptor tyrosine kinase signaling. PLoS. ONE. 2019, 14, e0216469.
37. Catenza, C. J.; Farooq, A.; Shubear, N. S.; Donkor, K. K. A targeted review on fate, occurrence, risk and health implications of bisphenol analogues. Chemosphere. 2021, 268, 129273.
38. Sajiki, J. Determination of bisphenol A in blood using high-performance liquid chromatography-electrochemical detection with solid-phase extraction. J. Chromatogr. B. Biomed. Sci. App. 2001, 755, 9-15.
39. Schönfelder, G.; Wittfoht, W.; Hopp, H.; Talsness, C. E.; Paul, M.; Chahoud, I. Parent bisphenol A accumulation in the human maternal-fetal-placental unit. Environ. Health. Perspect. 2002, 110, A703-7.
40. Fukata, H.; Miyagawa, H.; Yamazaki, N.; Mori, C. Comparison of Elisa- and LC-MS-based methodologies for the exposure assessment of bisphenol A. Toxicol. Mech. Methods. 2008, 16, 427-430.
41. Teeguarden, J.; Hanson-drury, S.; Fisher, J. W.; Doerge, D. R. Are typical human serum BPA concentrations measurable and sufficient to be estrogenic in the general population? Food. Chem. Toxicol. 2013, 62, 949-963.
42. González, N.; Cunha, S. C.; Monteiro, C.; et al. Quantification of eight bisphenol analogues in blood and urine samples of workers in a hazardous waste incinerator. Environ. Res. 2019, 176, 108576.
43. Zhuang, W.; Wu, K.; Wang, Y.; et al. Association of serum bisphenol-a concentration and male reproductive function among exposed workers. Arch. Environ. Contam. Toxicol. 2014, 68, 38-45.
44. Nicolucci, C.; Errico, S.; Federico, A.; Dallio, M.; Loguercio, C.; Diano, N. Human exposure to bisphenol A and liver health status: quantification of urinary and circulating levels by LC-MS/MS. J. Pharm. Biomed. Anal. 2017, 140, 105-112.
45. Caporossi, L.; Paci, E.; Pigini, D.; et al. Urinary bisphenols as biomarkers of exposure to bisphenol A, bisphenol F, and bisphenol S: a new procedure for biomonitoring. Laboratories. 2025, 2, 7.
46. Matuszewski, B. K.; Constanzer, M. L.; Chavez-eng, C. M. Strategies for the assessment of matrix effect in quantitative bioanalytical methods based on HPLC-MS/MS. Anal. Chem. 2003, 75, 3019-3030.
47. Anderson, D. J.; Brozek, E. M.; Cox, K. J.; Porucznik, C. A.; Wilkins, D. G. Biomonitoring method for bisphenol A in human urine by ultra-high-performance liquid chromatography-tandem mass spectrometry. J. Chromatogr. B. Analyt. Technol. Biomed. Life. Sci. 2014, 953-954, 53-61.
48. Koch, H. M.; Kolossa-Gehring, M.; Schröter-Kermani, C.; Angerer, J.; Brüning, T. Bisphenol A in 24 h urine and plasma samples of the German Environmental Specimen Bank from 1995 to 2009: a retrospective exposure evaluation. J. Expo. Sci. Environ. Epidemiol. 2012, 22, 610-616.
49. Harrison, D. M.; Chang, W. C.; Lin, H. T. Using QuEChERS and HPLC Method to monitor the background concentration of polycyclic aromatic hydrocarbons in commercial black tea leaves and infusions in Taiwan. Toxics. 2024, 12, 148.
50. Ikezuki, Y.; Tsutsumi, O.; Takai, Y.; Kamei, Y.; Taketani, Y. Determination of bisphenol A concentrations in human biological fluids reveals significant early prenatal exposure. Hum. Reprod. 2002, 17, 2839-2841.
51. Völkel, W.; Colnot, T.; Csanády, G. A.; Filser, J. G.; Dekant, W. Metabolism and kinetics of bisphenol A in humans at low doses following oral administration. Chem. Res. Toxicol. 2002, 15, 1281-1287.
52. Dekant, W.; Völkel, W. Human exposure to bisphenol A by biomonitoring: methods, results and assessment of environmental exposures. Toxicol. Appl. Pharmacol. 2008, 228, 114-134.
53. Li, J.; Wu, C.; Zhao, H.; et al. Exposure assessment of bisphenols in Chinese women during pregnancy: a longitudinal study. Environ. Sci. Technol. 2019, 53, 7812-7820.
54. Zhang, H.; Li, J.; An, Y.; et al. Concentrations of bisphenols, benzophenone-type ultraviolet filters, triclosan, and triclocarban in the paired urine and blood samples from young adults: Partitioning between urine and blood. Chemosphere. 2022, 288, 132563.
55. Heffernan, A.; Baduel, C.; Toms, L.; et al. Use of pooled samples to assess human exposure to parabens, benzophenone-3 and triclosan in Queensland, Australia. Environ. Int. 2015, 85, 77-83.
56. Pia Dima, A.; De Santis, L.; Verlengia, C.; et al. Development and validation of a liquid chromatography-tandem mass spectrometry method for the simultaneous determination of phthalates and bisphenol a in serum, urine and follicular fluid. Clin. Mass. Spectrom. 2020, 18, 54-65.
57. Gu, J.; Yuan, T.; Ni, N.; et al. Urinary concentration of personal care products and polycystic ovary syndrome: a case-control study. Environ. Res. 2019, 168, 48-53.
Cite This Article
How to Cite
Download Citation
Export Citation File:
Type of Import
Tips on Downloading Citation
Citation Manager File Format
Type of Import
Direct Import: When the Direct Import option is selected (the default state), a dialogue box will give you the option to Save or Open the downloaded citation data. Choosing Open will either launch your citation manager or give you a choice of applications with which to use the metadata. The Save option saves the file locally for later use.
Indirect Import: When the Indirect Import option is selected, the metadata is displayed and may be copied and pasted as needed.
About This Article
Special Topic
Copyright

Data & Comments
Data
0


Comments
Comments must be written in English. Spam, offensive content, impersonation, and private information will not be permitted. If any comment is reported and identified as inappropriate content by OAE staff, the comment will be removed without notice. If you have any queries or need any help, please contact us at [email protected].