

Occurrence, sources and ecological risk assessment of per- and polyfluoroalkyl substances (PFASs) in water and sediment from urban rivers in Dhaka, Bangladesh
 0
0 
Abstract
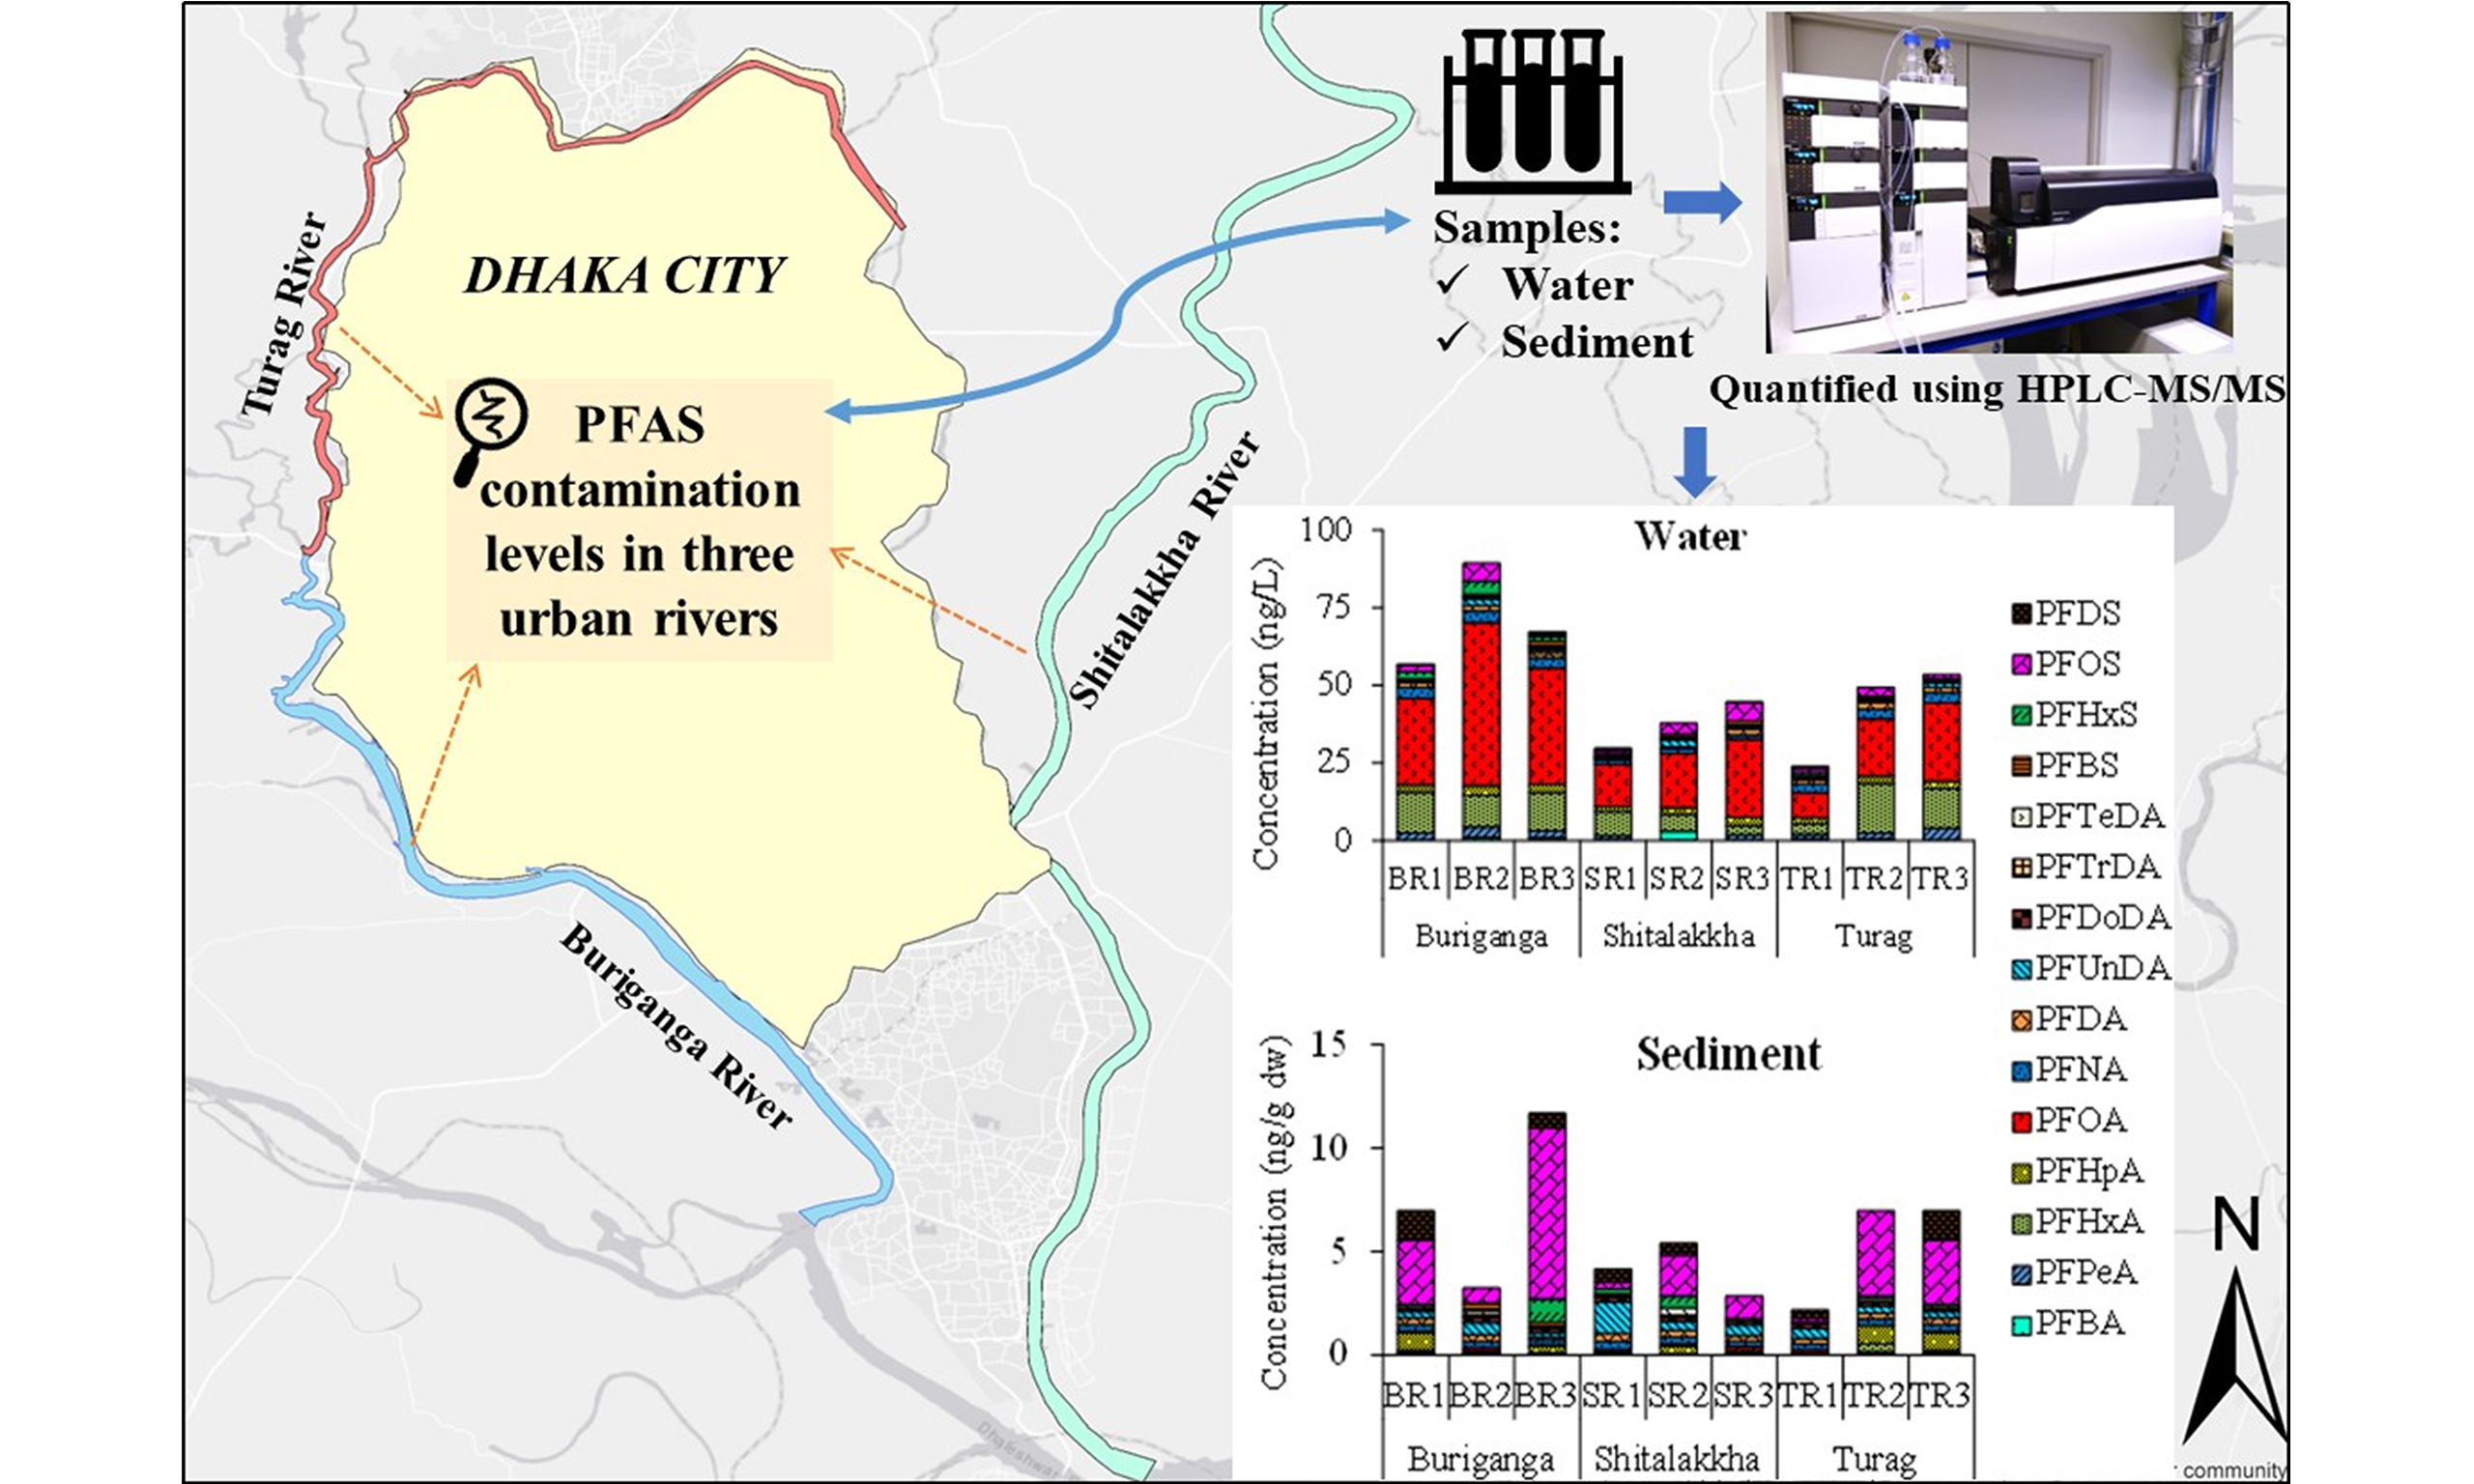
Per- and polyfluoroalkyl substances (PFASs) in urban rivers of rapidly industrializing regions remain understudied, particularly in South Asia. This study assessed the occurrence, sources, and ecological risks of 15 PFASs in water and sediment from three major rivers (Buriganga, Turag, Shitalakkha) in Dhaka, Bangladesh. PFASs were quantified using HPLC-MS/MS, and sources were identified via principal component analysis (PCA). All target compounds were detected, with total concentrations in water ranging from 23.96 to 89.35 ng/L and sediment from 2.18 to 11.67 ng/g dry weight. Perfluorooctanoic acid (PFOA) dominated water samples (34%-59% of ΣPFASs), reflecting its ongoing industrial use and high water solubility, while perfluorooctane sulfonate (PFOS) prevailed in sediments (up to 71% of ΣPFASs) due to historical accumulation. The Buriganga River exhibited the highest contamination, driven by untreated effluents from tanneries, textiles, and chemical industries. Risk quotient (RQ) analysis revealed low-to-moderate ecological risks for most PFASs, but PFOS in sediments posed a high risk (RQ = 1.68) near industrial clusters. Compared with global data, PFAS levels in rivers around Dhaka city exceeded those in less industrialized regions but were lower than those in heavily polluted systems. These findings highlight the urgent need for stricter regulation of industrial discharges, improved wastewater treatment, and long-term monitoring to mitigate PFAS contamination in urban waterways. This study also provides critical baseline data to inform environmental policy and sustainable water management in developing regions.
Keywords
INTRODUCTION
Per- and polyfluoroalkyl substances (PFASs) are a group of synthetic chemicals that have been widely used since the mid-20th century in numerous industrial and consumer applications, including textile coatings, food packaging, nonstick cookware, and aqueous film-forming foams (AFFFs) used in firefighting[1-3]. Their unique physicochemical properties - particularly their thermal and chemical stability, and resistance to oil and water - stem from the strength of the carbon–fluorine (C–F) bond, which also renders them highly persistent in the environment. These “forever chemicals” can travel long distances, bioaccumulate in living organisms, and pose considerable ecological and human health risks[3-5]. PFASs are well-documented for endocrine, reproductive, immune, kidney, and liver toxicity, with carcinogenic potential necessitating monitoring priority[6,7]. Ecologically, PFASs accumulate in aquatic organisms and biomagnify, threatening fish, birds, and apex predators. Their persistence leads to long-term contamination, endangering wildlife and humans via chronic exposure. For instance, PFAS contamination in Bangladeshi coastal seafood - predominantly perfluorooctane sulfonate (PFOS) in finfish and perfluorooctanoic acid (PFOA) in shellfish - highlights escalating threats to coastal ecosystems[8].
Widespread production and use of PFASs have led to their detection across multiple environmental and biological media, including air, water, soil, sediment, wildlife, and humans[9-11]. Among the hundreds of PFASs, legacy long-chain compounds such as PFOA and PFOS are the most extensively studied, as they are terminal degradation products of many precursor substances and are known for their toxicity and environmental persistence[12]. Recognizing their global risk, these legacy PFASs (e.g., PFOA, PFOS) and their precursors were listed under Annex B of the Stockholm Convention, prompting regulatory restrictions in many countries[13,14].
In response, developed nations have phased out or replaced long-chain PFASs with emerging short-chain alternatives such as perfluorobutanoic acid (PFBA), perfluoropentanoic acid (PFPeA), perfluorobutanesulfonic acid (PFBS), and other substitutes such as fluorotelomer-based compounds (e.g., 6:2 FTS)[15,16]. In this study, we refer to legacy PFASs as long-chain perfluoroalkyl acids (PFAAs) (e.g., PFOA, PFOS) and their precursors, which have been widely used and are now regulated or phased out due to their environmental persistence and toxicity. Emerging PFASs refer to newer substitutes, including short-chain PFASs (e.g., PFBA, PFPeA, PFBS) and alternative fluorinated compounds (e.g., fluorotelomer-based substances), which have been introduced to replace legacy compounds but whose environmental behavior and health effects remain uncertain[17,18]. Simultaneously, PFAS production has increasingly shifted to developing countries where regulatory frameworks are often weaker, raising concerns about new contamination hotspots. Bangladesh exemplifies this trend, hosting a rapidly expanding textile industry - a major global consumer of PFAS - yet lacking specific national regulations for PFAS control[19]. While Bangladesh ratified Stockholm Convention amendments for PFOS and PFOA in 2023, it has no domestic laws targeting PFAS production, use, or disposal[19]. Industrial discharges, particularly from textiles, may lead to severe contamination[19,20]. This regulatory gap, coupled with inadequate wastewater treatment and reliance on imported PFAS-containing products (e.g., leather goods, firefighting foams, food packaging), positions Bangladesh as a potential PFAS pollution hotspot, contributing to the global cycle of these persistent pollutants.
Extensive studies across North America, Europe, and East Asia have confirmed the global ubiquity of PFASs. For instance, elevated PFAS levels have been reported in water sources in China, the United States, and even remote locations such as the Arctic and the Tibetan Plateau[21-24]. However, in South Asia - and particularly in Bangladesh - research on PFASs remains limited. A few pioneering studies have identified PFAS contamination in coastal waters and sediments, particularly in Cox’s Bazar and Chittagong, with concentrations influenced by shipbreaking, port activity, and industrial effluent discharges[20]. Yet, data on PFAS occurrence in urban river systems, which are heavily impacted by industrial and municipal activities, remain critically scarce.
Urban rivers are dynamic environments that often receive PFASs from both point sources [e.g., industrial discharges, wastewater treatment plants (WWTPs)] and nonpoint sources (e.g., surface runoff, landfill leachates). WWTPs, while essential for urban sanitation, are generally ineffective at removing PFASs - especially short-chain variants - due to their resistance to chemical and biological degradation. Some precursor compounds may even transform into more persistent PFASs during treatment processes[25-27].
Dhaka, the capital of Bangladesh, is one of the most densely populated megacities in the world, with over 24.7 million inhabitants in its greater metropolitan area[28]. Rapid urbanization and industrial expansion have placed immense environmental pressure on the rivers that traverse the city - namely the Buriganga, Turag, and Shitalakkha. These rivers receive substantial volumes of untreated or partially treated effluents from industries such as textiles, tanneries, pharmaceuticals, and plastics, especially in areas like Hazaribagh, Savar, Tongi, and Narayanganj[29-31]. Despite these known pressures, there is a lack of systematic data on PFAS contamination in these river systems.
As concern grows worldwide over PFAS pollution, Bangladesh still lacks detailed information on how these chemicals affect its urban waterways. To protect the major urban rivers in Dhaka city and the communities that depend on them, there is an urgent need to investigate where these pollutants come from and how much is present. This study addresses this gap by pursuing three objectives: Quantify the occurrence and concentrations of legacy and emerging PFASs in water and sediment across three major urban rivers (Buriganga, Turag, and Shitalakkha) in and around Dhaka; Identify potential sources of PFAS contamination using compositional profiling and spatial analysis; Evaluate ecological risks by comparing PFAS levels with international safety benchmarks. This study provides essential baseline data for environmental monitoring and policy development in Bangladesh and contributes to the broader understanding of PFAS contamination in rapidly industrializing urban environments, advancing Sustainable Development Goals (SDGs) for clean water (SDG 6)[32] and sustainable cities (SDG 11)[33].
EXPERIMENTAL
Study area and sampling locations
This study focused on three major rivers - Turag, Buriganga, and Shitalakkha - around Dhaka City, Bangladesh [Figure 1]. The banks of these rivers have turned into unplanned industrial areas. The metropolitan area of Dhaka is about 815.8 km2 and is located at the center of Bangladesh. Dhaka City is one of the most densely populated cities in the world, home to approximately twelve million people, of which less than 25% are served by a sewage treatment facility[34]. These rivers are used as a convenient means for disposing of domestic raw sewage as well as untreated industrial waste effluents from surrounding habitation and the nearby industrial belt. No information is available regarding the levels of PFAS contamination in these rivers. Therefore, these three rivers have been selected for the present study. Furthermore, sampling sites were strategically selected along the upstream, midstream, and downstream sections of each river to capture spatial variations in PFAS contamination. This division enables assessment of potential changes in PFAS levels due to differing anthropogenic inputs along the river course, such as industrial effluent discharges, urban runoff, and municipal wastewater inputs, which typically intensify in the midstream and downstream zones of urban rivers.
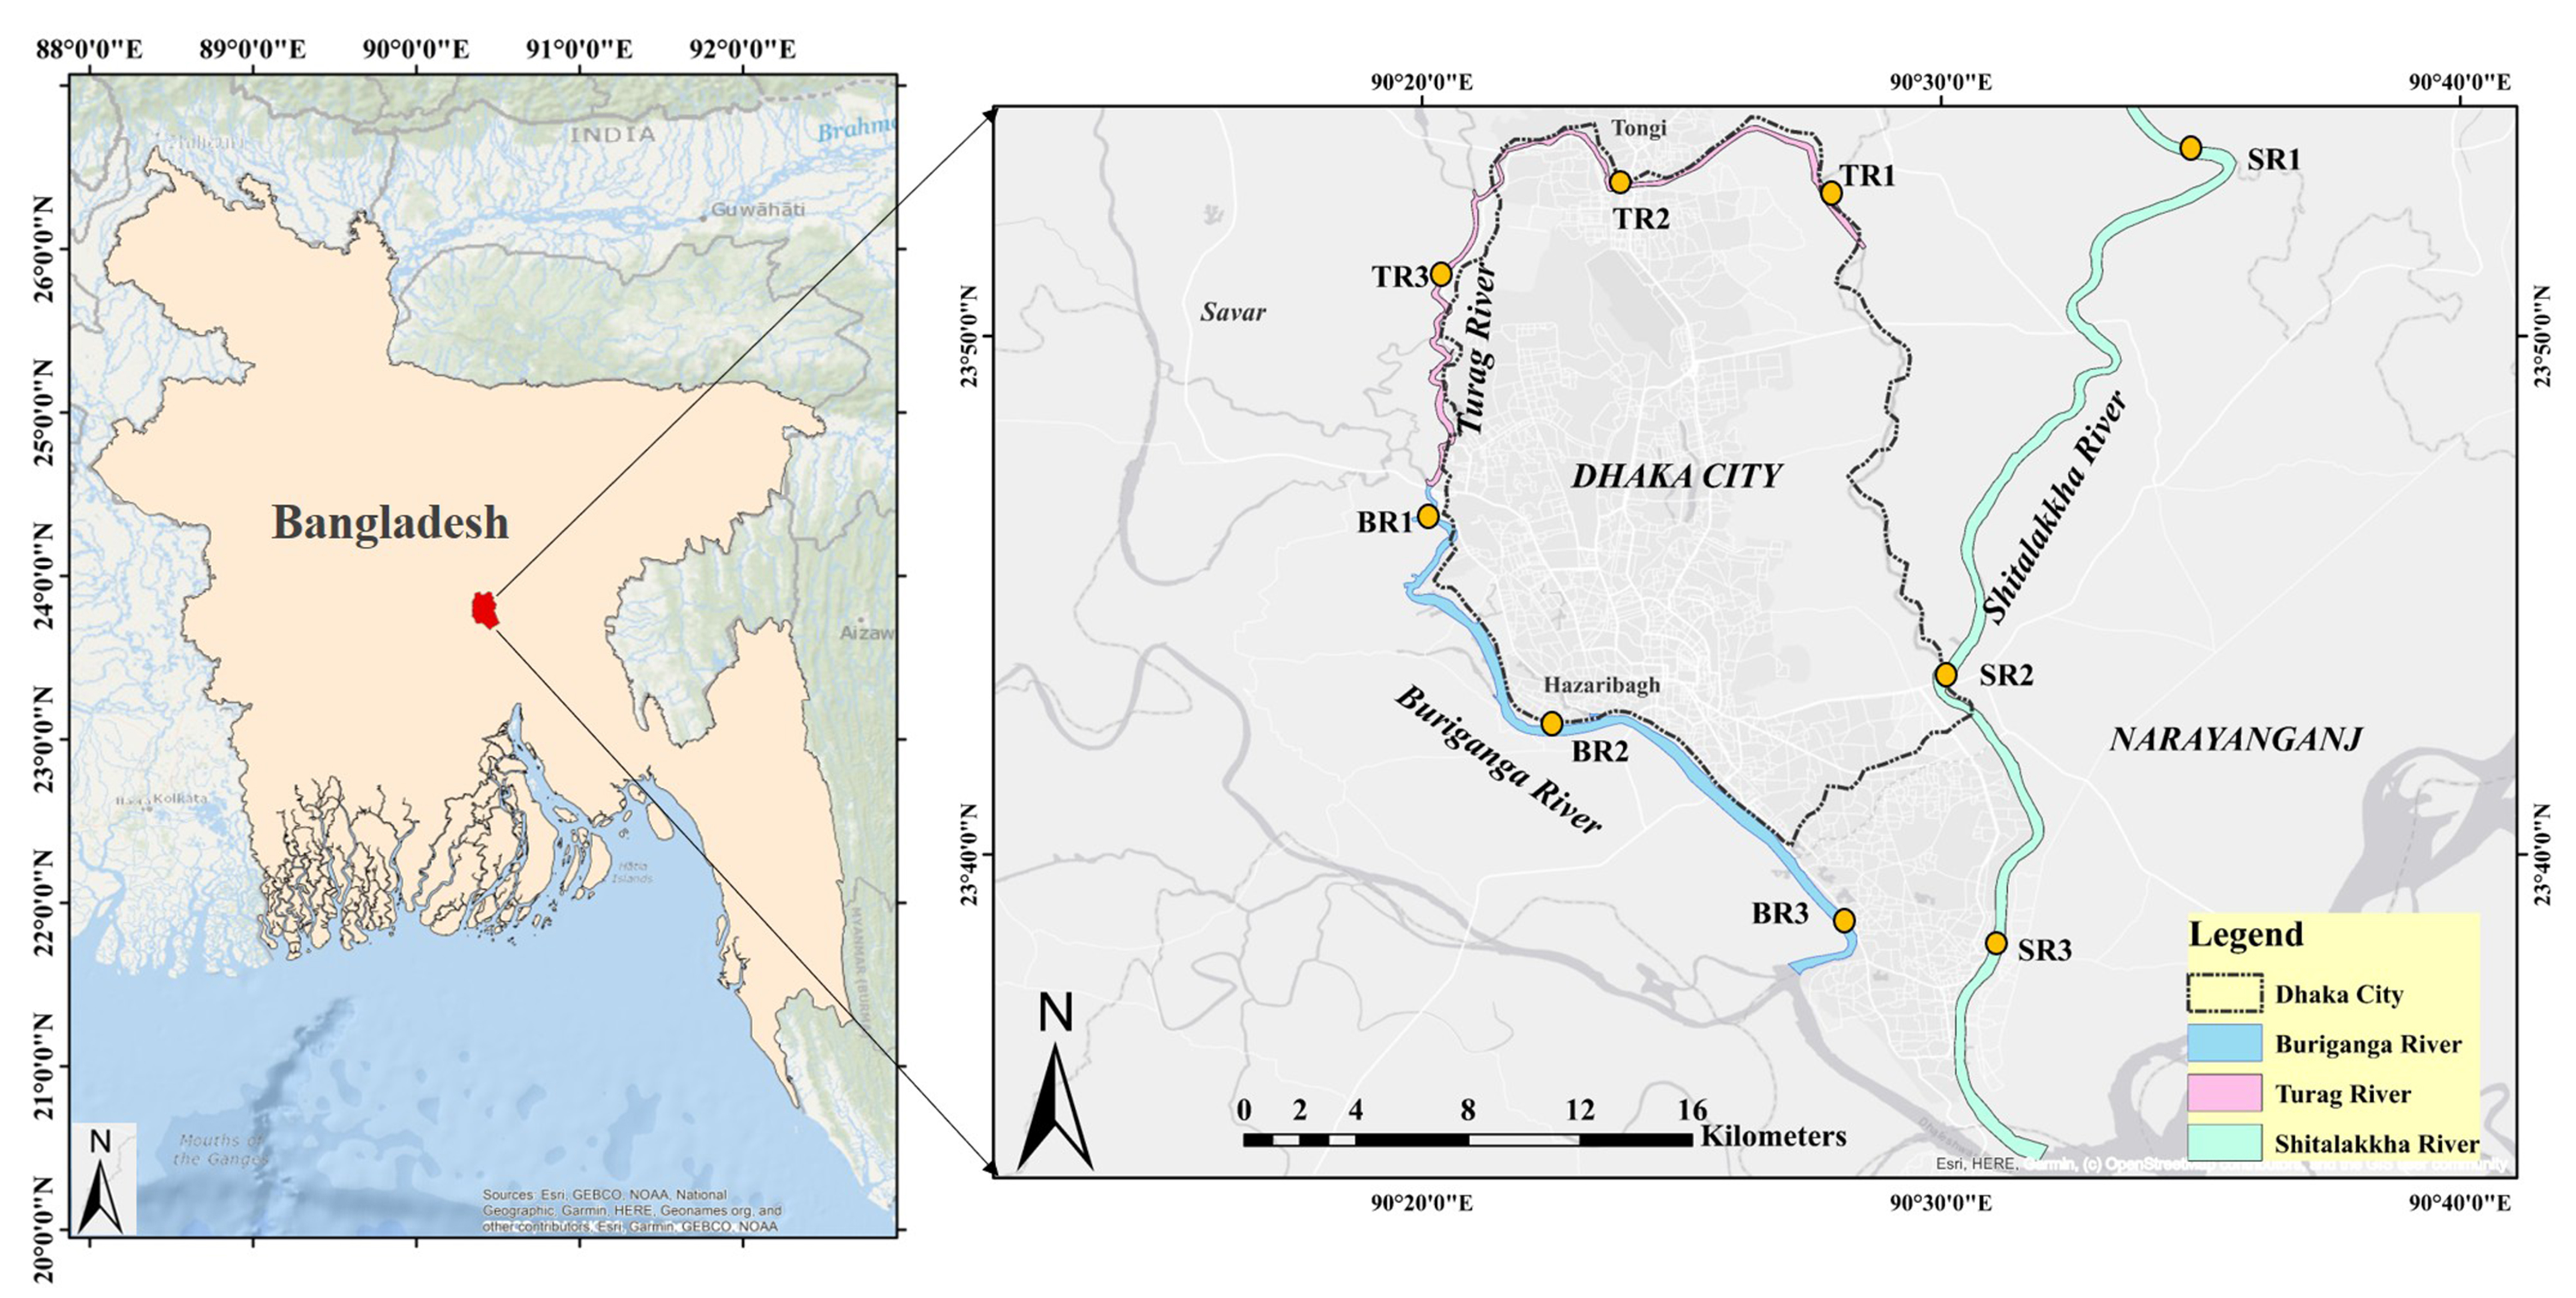
Figure 1. Map of Dhaka city, Bangladesh, showing the three urban rivers sampled in this study: BR, TR, and SR. Sampling sites were distributed across upstream (1), midstream (2), and downstream (3) locations for each river (e.g., BR1–BR3, TR1–TR3, SR1–SR3). BR: Buriganga River; TR: Turag River; SR: Shitalakkha River.
Collection of samples
Sampling was carried out at three points (up-, mid-, and downstream) along each river. A total of 27 surface water samples and 27 sediment samples were collected during the dry season, in January-April 2017. For water, triplicate composite samples (~100 mL each) were taken at each site using pre-cleaned polypropylene (PP) bottles. The bottles were rinsed first with deionized water, then methanol, and finally with site water before sample collection. Immediately post-collection, samples were passed through 0.45 µm membrane filters to eliminate suspended particles and stored in clean PP containers prewashed with methanol and Milli-Q water. Samples were transported on ice and kept at -20 °C until further processing, which occurred within 48 h. Sediment samples were collected using a handheld Ekman grab sampler targeting the top
Chemicals and reagents
Fifteen PFAS compounds were analyzed: PFBA, PFPeA, PFHxA, PFHpA, PFOA, PFNA, PFDA, PFUnDA, PFDoDA, PFTrDA, PFTeDA, PFBS, PFHxS, PFOS, and PFDS. Calibration and isotope-labeled internal standards (e.g., 13C4–PFBA, 13C2–PFHxA, 13C4–PFOA, 13C2–PFDoDA, and 13C4–PFOS) were obtained from Wellington Laboratories (Canada) and Kanto Chemical (Japan). All standards were prepared in methanol and stored in PP vials at 4 °C. Solid-phase extraction (SPE) was performed using Oasis® WAX cartridges (6 cc, 150 mg) and ENVI-CarbTM clean-up tubes (1 mL, 100 mg). High-purity solvents (methanol, acetonitrile, ammonium acetate, acetic acid) were purchased from Wako Pure Chemical Industries (Japan), and ultrapure Milli-Q water (18.2 MΩ) was used throughout. Filter membranes (0.45 µm, 47 mm) were sourced from ADVANTEC® (Japan). Detailed instrument parameters are provided in Supplementary Table 1.
Sample pretreatment
Pretreatment followed a modified SPE protocol previously described in the study “Occurrence and distribution of PFAAs in surface water and sediment of a tropical coastal area (Bay of Bengal coast, Bangladesh)” by Habibullah-Al-Mamun et al.[20]. Briefly, 800 µL of a 5 ng/mL internal standard mix was added to 100 mL of filtered water. SPE cartridges were conditioned sequentially with 0.1% ammonium hydroxide in methanol (4 mL), methanol (4 mL), and Milli-Q water (4 mL). Samples were loaded at
Instrumental analysis
PFASs were quantified using high-performance liquid chromatography coupled with tandem mass spectrometry (HPLC–MS/MS). An Agilent 1100 HPLC system was interfaced with a Micromass Quattro Ultima Pt mass spectrometer operating in negative electrospray ionization (ESI–) mode. Separation was performed on a Zorbax XDB–C18 column (150 mm × 2.1 mm, 5 µm) maintained at 40 °C. A 10 µL sample was injected, and elution was achieved using a gradient of methanol and 10 mM ammonium acetate at a flow rate of 0.2 mL/min. The column was maintained at 40 °C during the sample analysis. The gradient started at 10% methanol, increased to 62% after 5 min, held for 10 min, then raised to 65% and maintained for another 10 min. It was further increased to 70% methanol, held for 6 min, then adjusted to 100% and maintained for 5 min. Finally, the gradient was returned to its initial condition. Analyte detection used multiple reaction monitoring (MRM), and data analysis was performed using MassLynx™ software (v4.1). Detailed instrument parameters are provided in Supplementary Table 2.
Quality assurance and quality control
All labware was rigorously pre-cleaned with methanol, and contact with PTFE or other fluorinated materials was strictly avoided. Quantification was based on internal standard calibration curves (0.01 to
Ecological risk assessment
To evaluate the potential ecological hazards associated with PFAS contamination in the Buriganga, Turag, and Shitalakkha rivers, an environmental risk assessment (ERA) was conducted using the widely accepted risk quotient (RQ) approach. The RQ was calculated as the ratio of the measured environmental concentration (MEC) to the predicted no-effect concentration (PNEC), according to Equation (1).
where: MEC - measured environmental concentration [ng/L or ng/g dw]; PNEC - predicted no effect concentration [ng/L or ng/g]. Owing to the absence of comprehensive freshwater PNEC values for all 15 PFASs, relevant values were sourced from published studies[20,35,36]. The collected PNEC values are presented in Supplementary Materials. Ecological risk thresholds were categorized as: very low (RQ < 0.01), low (0.01 ≤ RQ < 0.1), moderate (0.1 ≤ RQ < 1), and high (RQ ≥ 1)[37].
Statistical analysis
Data analysis was conducted using SPSS (v23.0, IBM Corp., NY, USA). Prior to statistical evaluation, concentrations below LOQ were assigned values equal to LOQ/2, while those below LOD were set to zero[38]. Normality of distribution was assessed using P–P plots. One-way ANOVA was applied to detect differences in PFAS levels across rivers. Principal component analysis (PCA) was employed to interpret potential sources and distribution patterns of PFAS contamination.
RESULTS AND DISCUSSION
Occurrence, concentration and composition of PFASs in surface water
All fifteen targeted PFASs, including perfluorocarboxylic acids (PFCAs) and perfluorosulfonic acids (PFSAs), were detected in surface water samples from the Buriganga, Turag, and Shitalakkha rivers. PFHxA, PFHpA, PFOA, PFNA, PFDA, and PFOS were consistently present across all sites. Concentrations ranged from below the limit of detection (< LOD) to 52.63 ng/L [Table 1 and Figure 2]. One-way ANOVA analysis for the river water samples showed that there were no significant differences (P > 0.05) in the mean concentrations of PFASs among the Buriganga, Turag, and Shitalakkha rivers, indicating a broadly similar level of overall PFAS contamination. However, when individual PFAS compounds were considered, significant differences were observed. For example, PFHxA concentrations were significantly higher in the Buriganga River than in the Shitalakkha River (P < 0.05). Similarly, PFNA concentrations were significantly higher in both the Buriganga and Turag rivers compared to the Shitalakkha River (P < 0.001). PFHxS levels were also significantly higher in the Buriganga River than in the Shitalakkha River (P < 0.05). These findings suggest that, while diffuse sources contribute to a relatively uniform overall PFAS burden, specific compounds are more strongly influenced by local industrial discharges and wastewater inputs. The higher concentrations of PFHxA, PFNA, and PFHxS in the Buriganga and Turag rivers may reflect the impact of intensive industrial and urban activities along these riverbanks, whereas the lower levels in the Shitalakkha River could be due to fewer direct discharges or greater dilution capacity. The total PFAS concentration
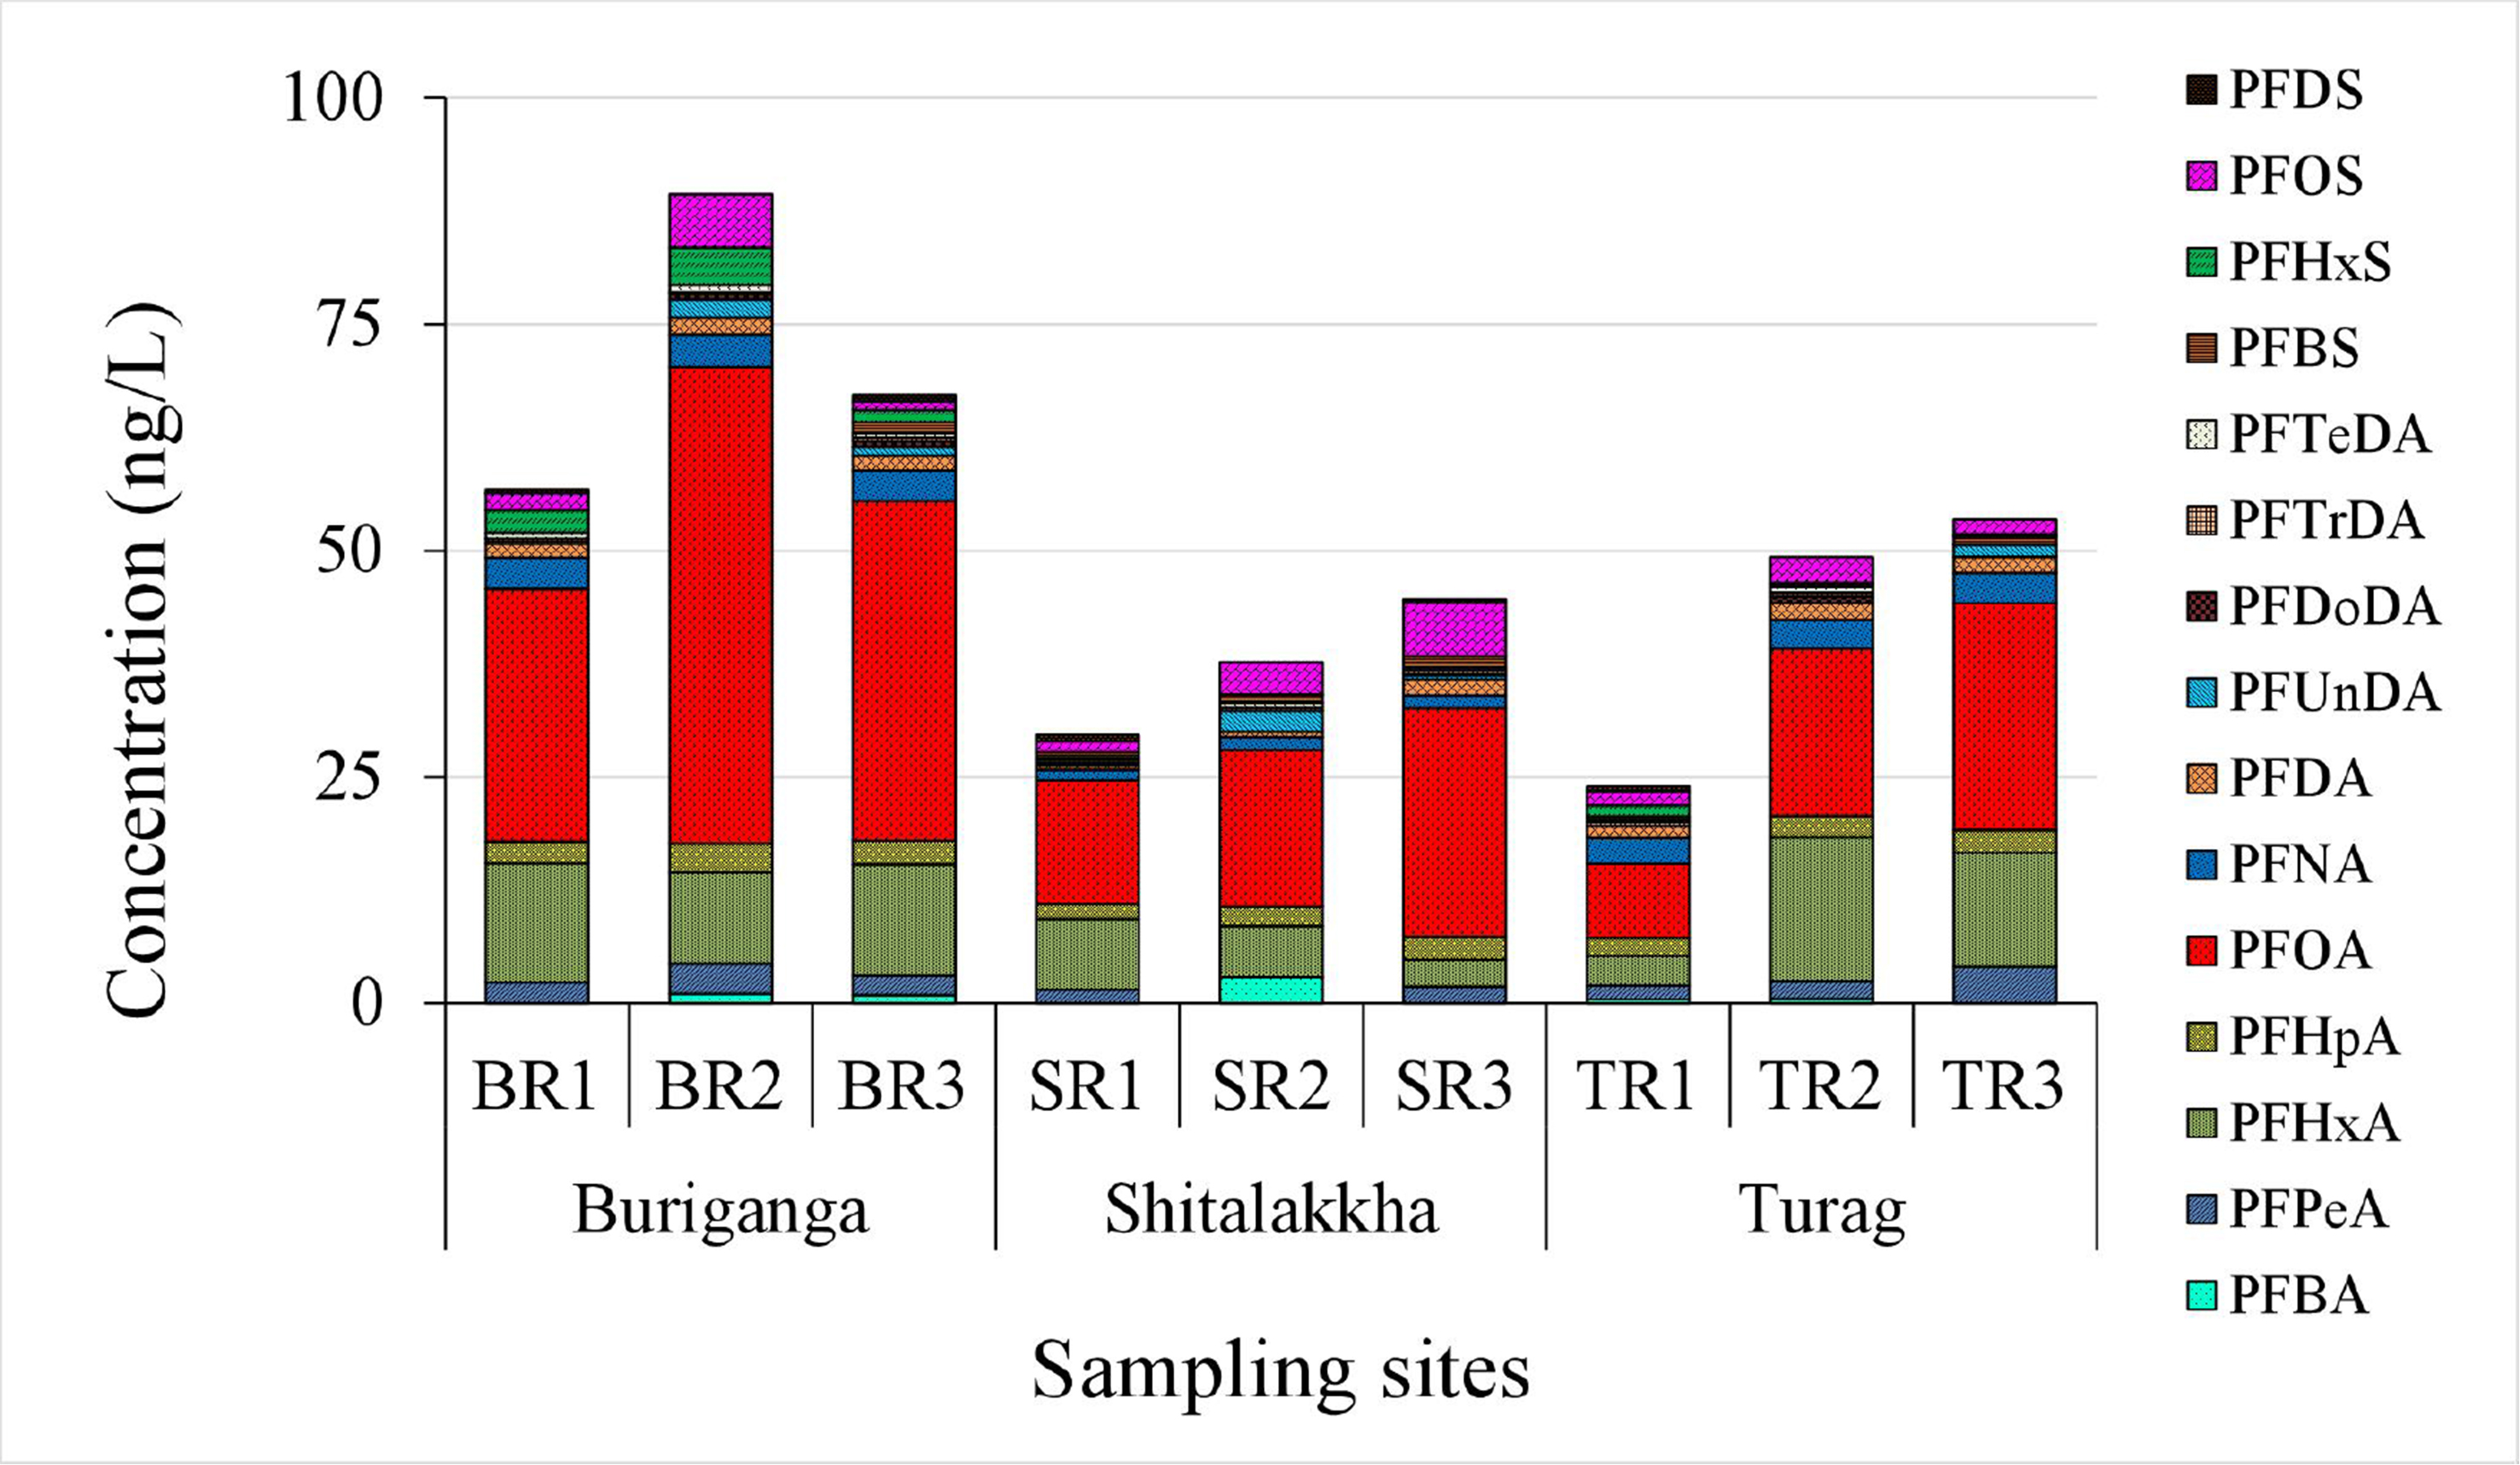
Figure 2. ΣPFASs concentrations (ng/L) in surface water samples from the BR, SR, and TR. ΣPFASs represents the sum of all quantified perfluoroalkyl and polyfluoroalkyl substances across each site. ΣPFASs: Total per- and polyfluoroalkyl substances; BR: Buriganga River; SR: Shitalakkha River; TR: Turag River.
Concentrations (ng/L) of PFASs in surface water samples from the Buriganga (BR1–BR3), Shitalakkha (SR1–SR3), and Turag (TR1–TR3) Rivers
| PFASs | Buriganga River | Shitalakkha River | Turag River | ||||||||||||
| BR1 | BR2 | BR3 | Mean | SD | SR1 | SR2 | SR3 | Mean | SD | TR1 | TR2 | TR3 | Mean | SD | |
| PFCAs | |||||||||||||||
| PFBA | < LOD | 1.03 | 0.89 | 0.96 | 0.10 | < LOD | 2.89 | < LOD | 2.89 | 0.00 | 0.43 | 0.46 | < LOD | 0.45 | 0.02 |
| PFPeA | 2.30 | 3.36 | 2.15 | 2.60 | 0.66 | 1.52 | < LOQ | 1.83 | 1.67 | 0.22 | 1.51 | 2.02 | 4.08 | 2.53 | 1.36 |
| PFHxA | 13.16 | 10.03 | 12.28 | 11.82 | 1.61 | 7.83 | 5.62 | 2.96 | 5.47 | 2.44 | 3.29 | 15.85 | 12.55 | 10.56 | 6.51 |
| PFHpA | 2.39 | 3.24 | 2.64 | 2.76 | 0.43 | 1.65 | 2.15 | 2.57 | 2.12 | 0.46 | 2.04 | 2.35 | 2.49 | 2.29 | 0.23 |
| PFOA | 27.90 | 52.63 | 37.49 | 39.34 | 12.47 | 13.63 | 17.35 | 25.24 | 18.74 | 5.92 | 8.13 | 18.46 | 25.09 | 17.23 | 8.54 |
| PFNA | 3.47 | 3.59 | 3.39 | 3.49 | 0.10 | 1.13 | 1.37 | 1.43 | 1.31 | 0.16 | 2.82 | 3.21 | 3.36 | 3.13 | 0.28 |
| PFDA | 1.58 | 1.85 | 1.66 | 1.70 | 0.14 | 0.50 | 0.63 | 1.73 | 0.96 | 0.68 | 1.38 | 1.87 | 1.75 | 1.67 | 0.25 |
| PFUnDA | < LOQ | 2.06 | 0.96 | 1.51 | 0.78 | 0.33 | 2.33 | 0.48 | 1.05 | 1.12 | < LOD | < LOD | 1.32 | 1.32 | 0.00 |
| PFDoDA | < LOQ | 0.56 | 0.63 | 0.60 | 0.06 | < LOD | < LOD | < LOD | < LOD | 0.00 | < LOD | 0.63 | < LOD | 0.63 | 0.00 |
| PFTrDA | 0.49 | 0.23 | 0.43 | 0.38 | 0.14 | 0.32 | 0.37 | 0.47 | 0.39 | 0.07 | 0.40 | 0.54 | < LOD | 0.47 | 0.10 |
| PFTeDA | 0.65 | 0.74 | 0.40 | 0.60 | 0.18 | 0.23 | 0.51 | 0.31 | 0.35 | 0.15 | 0.31 | 0.57 | < LOD | 0.44 | 0.18 |
| ΣPFCAs | 51.95 | 79.32 | 62.93 | 64.74 | 13.78 | 27.15 | 33.23 | 37.02 | 32.47 | 4.98 | 20.32 | 45.95 | 50.63 | 38.97 | 16.32 |
| PFSAs | |||||||||||||||
| PFBS | < LOD | < LOD | 1.25 | 1.25 | 0.00 | 0.57 | 0.87 | 1.31 | 0.91 | 0.37 | 0.34 | 0.37 | 0.93 | 0.54 | 0.33 |
| PFHxS | 2.52 | 4.17 | 1.38 | 2.69 | 1.40 | < LOD | < LOD | < LOD | < LOD | 0.00 | 1.22 | 0.14 | 0.25 | 0.54 | 0.59 |
| PFOS | 1.84 | 5.86 | 0.95 | 2.88 | 2.62 | 1.21 | 3.59 | 5.95 | 3.58 | 2.37 | 1.51 | 2.81 | 1.62 | 1.98 | 0.72 |
| PFDS | 0.45 | < LOD | 0.75 | 0.60 | 0.21 | 0.73 | < LOD | 0.34 | 0.54 | 0.28 | 0.57 | < LOD | < LOD | 0.57 | 0.00 |
| ΣPFSAs | 4.82 | 10.03 | 4.32 | 6.39 | 3.16 | 2.51 | 4.46 | 7.60 | 4.86 | 2.57 | 3.64 | 3.32 | 2.79 | 3.25 | 0.43 |
| ΣPFASs | 56.77 | 89.35 | 67.25 | 71.12 | 16.63 | 29.66 | 37.69 | 44.62 | 37.32 | 7.49 | 23.96 | 49.27 | 53.43 | 42.22 | 15.95 |
PFOA was the dominant PFAS, accounting for 34%-59% of ΣPFASs [Figure 3], with concentrations between 8.13 and 52.63 ng/L. PFOS contributed only 1%-13% of the total PFAS burden. The PFOA-to-PFOS concentration ratio ranged from 4:1 to 40:1, likely due to higher solubility and lower sediment affinity for PFOA[39]. Regulatory gaps and continued industrial use in rapidly urbanizing regions like Dhaka may also explain its prevalence. Similar PFOA dominance has been reported in rivers globally, including the Tennessee[40], Yangtze[41], and Elbe[42]. However, some rivers such as the Jiulong and Júcar show PFOS dominance, highlighting variable source profiles and contamination histories[43,44]. Other moderately detected PFASs included PFHxA (7%-32%), PFHpA (4%-9%), and PFNA (3%-12%). Less prevalent compounds, including PFBA, PFPeA, PFDA, PFUnDA, PFDoDA, PFTrDA, PFTeDA, PFBS, PFHxS, and PFDS, contributed minor fractions. These patterns reflect global shifts from long- to short-chain PFASs due to regulatory phase-outs[45-47], consistent with increased short-chain usage in Bangladesh[20]. Importantly, long-chain PFASs (e.g., PFOA, PFOS, PFNA) exhibit greater environmental persistence, bioaccumulation potential, and protein/lipid affinity, increasing risks of biomagnification and chronic health effects (e.g., carcinogenicity, reproductive/endocrine toxicity)[48,49]. Short-chain alternatives (e.g., PFBA, PFBS) are less bioaccumulative but remain mobile and persistent, posing concerns about continuous exposure, cumulative mixture effects, and ecological impacts[50].
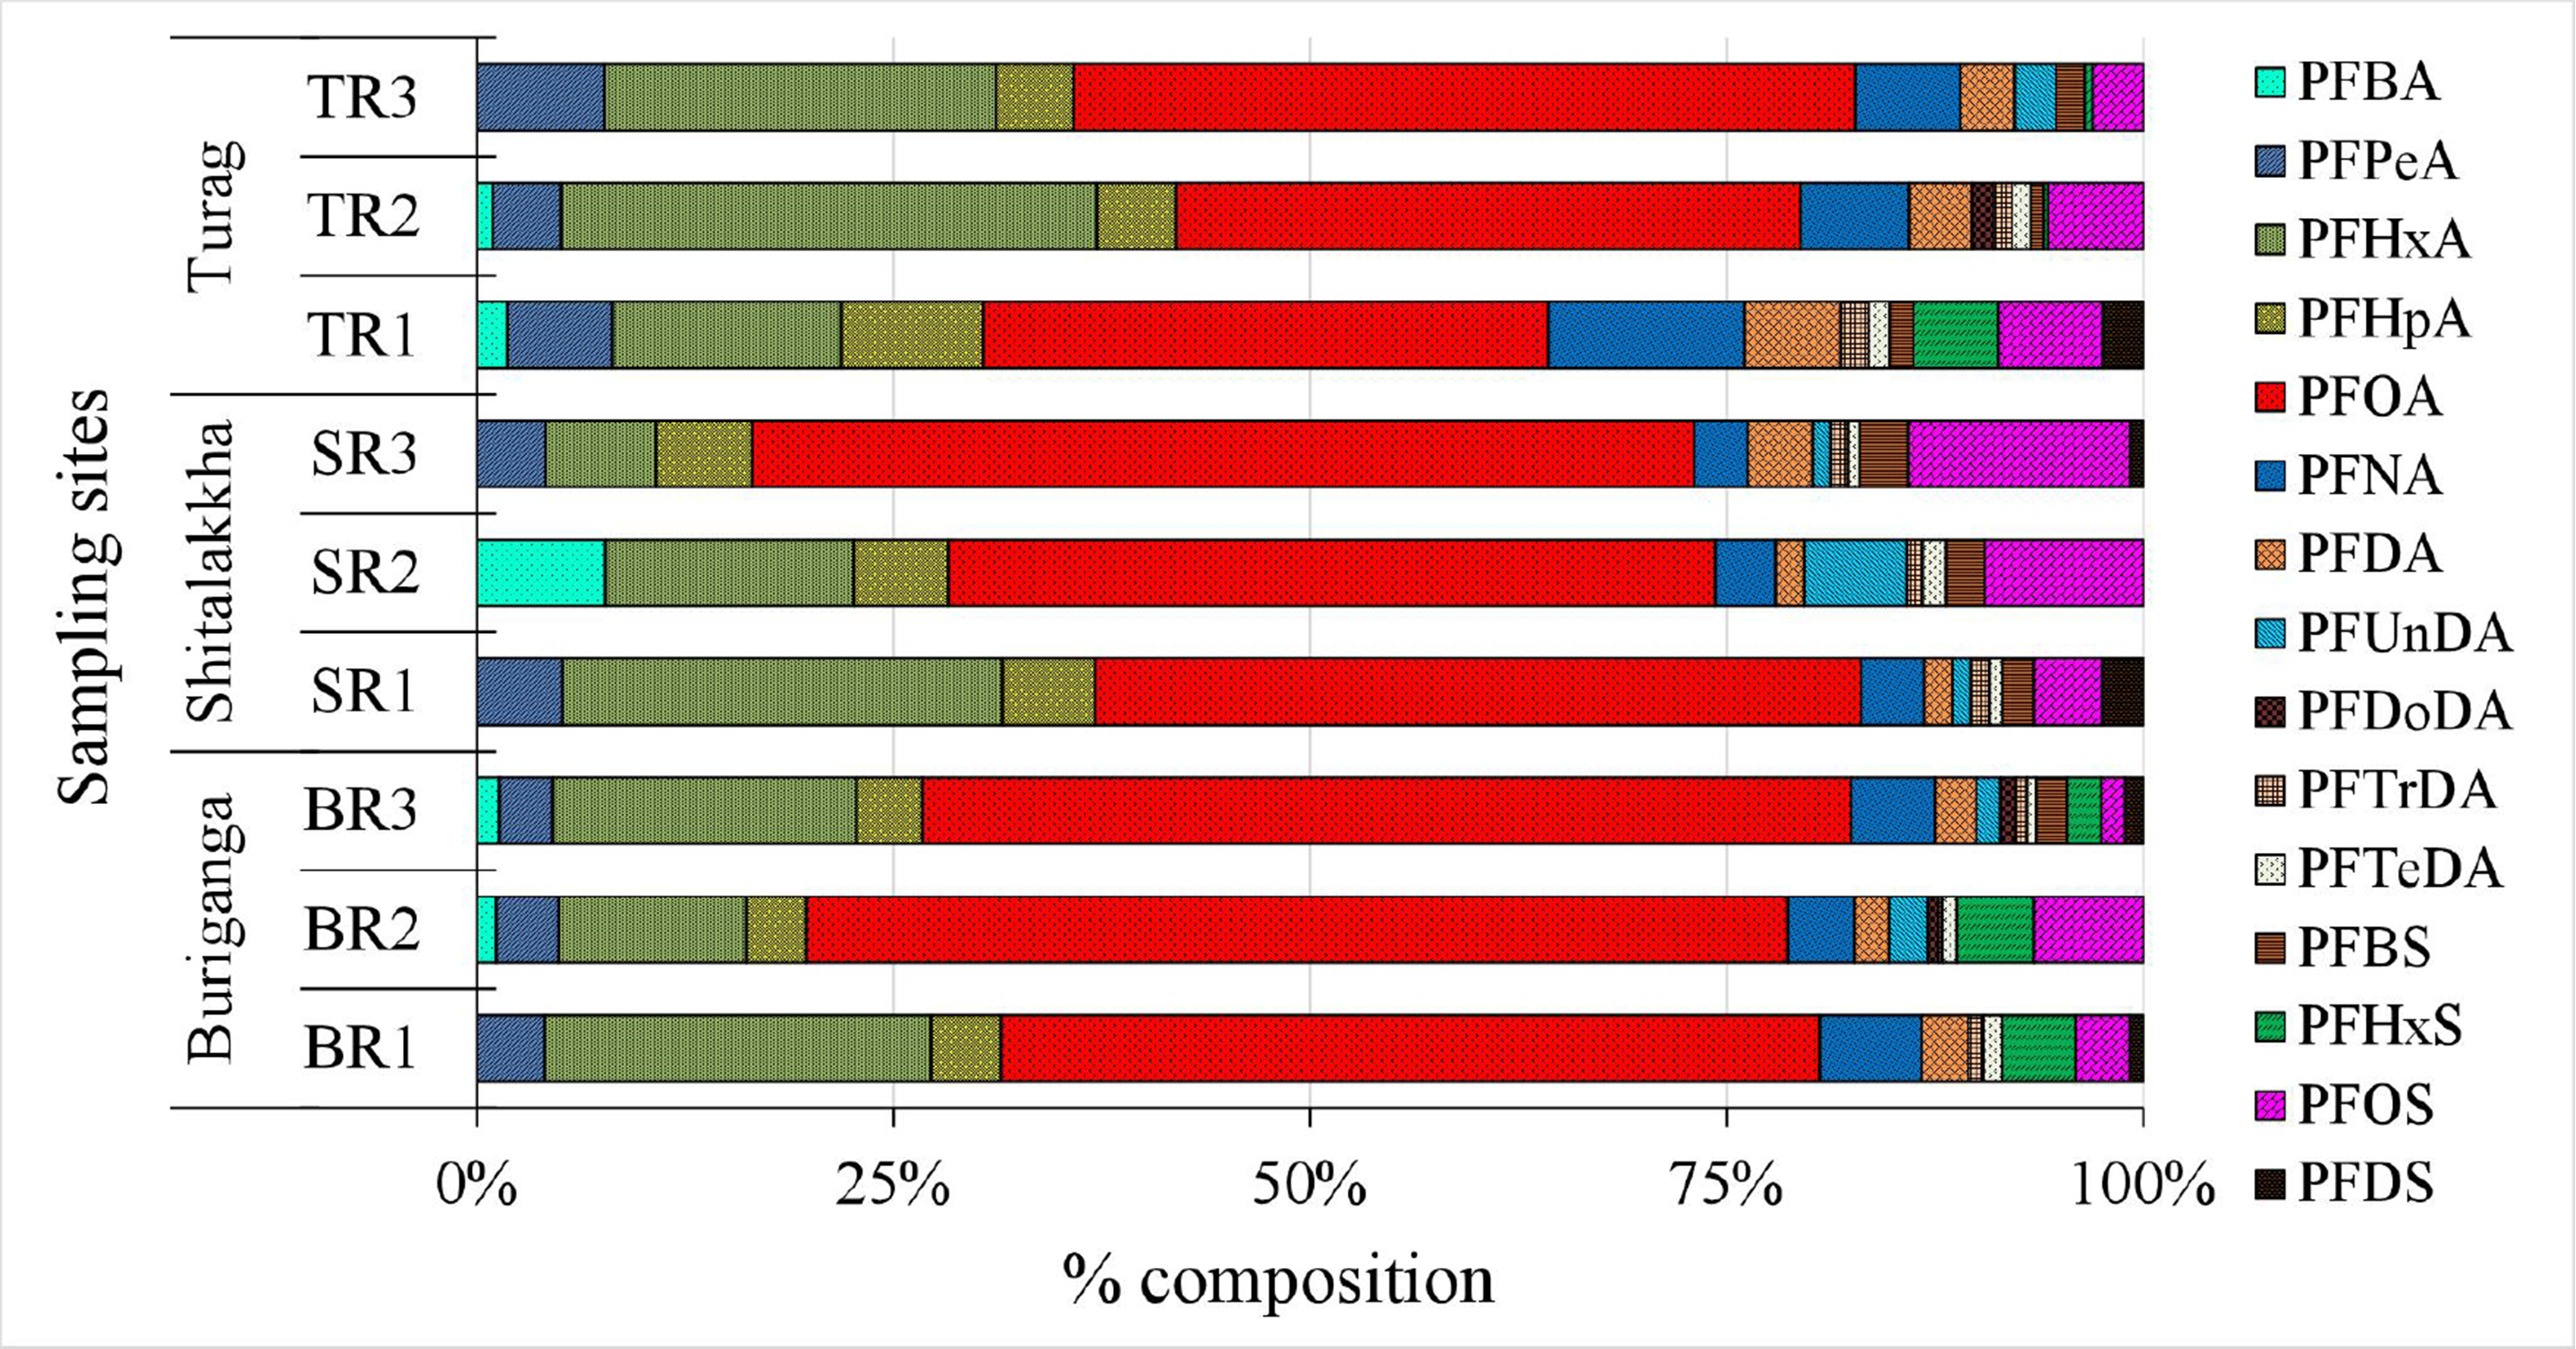
Figure 3. Relative composition (%) of individual PFAS compounds in surface water samples. PFAS: Per- and polyfluoroalkyl substance.
Compared to the previous studies [Supplementary Table 4], PFAS concentrations in rivers around Dhaka were lower than in highly contaminated sites such as the Liuxi and Xiaoqing Rivers in China[51,52] but comparable to moderately polluted rivers like the Jiulong, Oder, and Seine Rivers[44,53,54]. However, levels in the Buriganga exceeded those in rural or less industrialized regions, including the coastal area of Bangladesh[20], the Yellow River[51], and Lakes Superior and Huron[55].
Notably, PFCAs in this study were over three times higher than those in the Yangtze Estuary[56] and Yodo River[57], though lower than in more industrialized systems such as the Las Vegas Wash[58]. PFOA concentrations in this study surpassed many international reports but were comparable to those from the Liuxi River[52] and Taihu Lake[59]. PFOS levels (0.95-5.95 ng/L) were moderate, exceeding values in the Oder[54] and Ganges Rivers[60] but lower than those found in the Swan-Canning Estuary[47] and Júcar River[43]. Overall, elevated PFAS concentrations, especially in the Buriganga River, highlight the influence of untreated industrial and domestic effluents and emphasize the need for targeted management and consistent monitoring in urban waterways around Dhaka city.
Occurrence, concentration and composition of PFASs in sediment
All fifteen PFASs were detected in sediment samples from the three rivers [Table 2 and Figure 4]. The one-way ANOVA analysis revealed that differences in the concentrations of individual PFAS and the overall mean PFAS concentrations in sediment samples among the Buriganga, Turag, and Shitalakkha rivers were not statistically significant (P > 0.05). This suggests that, despite variations in local sources and industrial activities, the levels of PFAS contamination in sediments are relatively comparable across these river systems. Concentrations ranged from < LOD to 8.25 ng/g dry weight (dw). The highest total PFAS burden was observed in the Buriganga (mean: 7.29 ng/g dw), followed by the Turag (5.38 ng/g dw) and Shitalakkha (4.14 ng/g dw). Mean ΣPFCAs in sediments were similar across rivers: Shitalakkha (2.26 ng/g dw), Turag (2.25 ng/g dw), and Buriganga (1.99 ng/g dw). Conversely, ΣPFSAs were pointedly higher in the Buriganga (5.30 ng/g dw), supporting its role as the most impacted site. Elevated levels likely result from high industrial and municipal discharge, historical accumulation, and limited regulation.
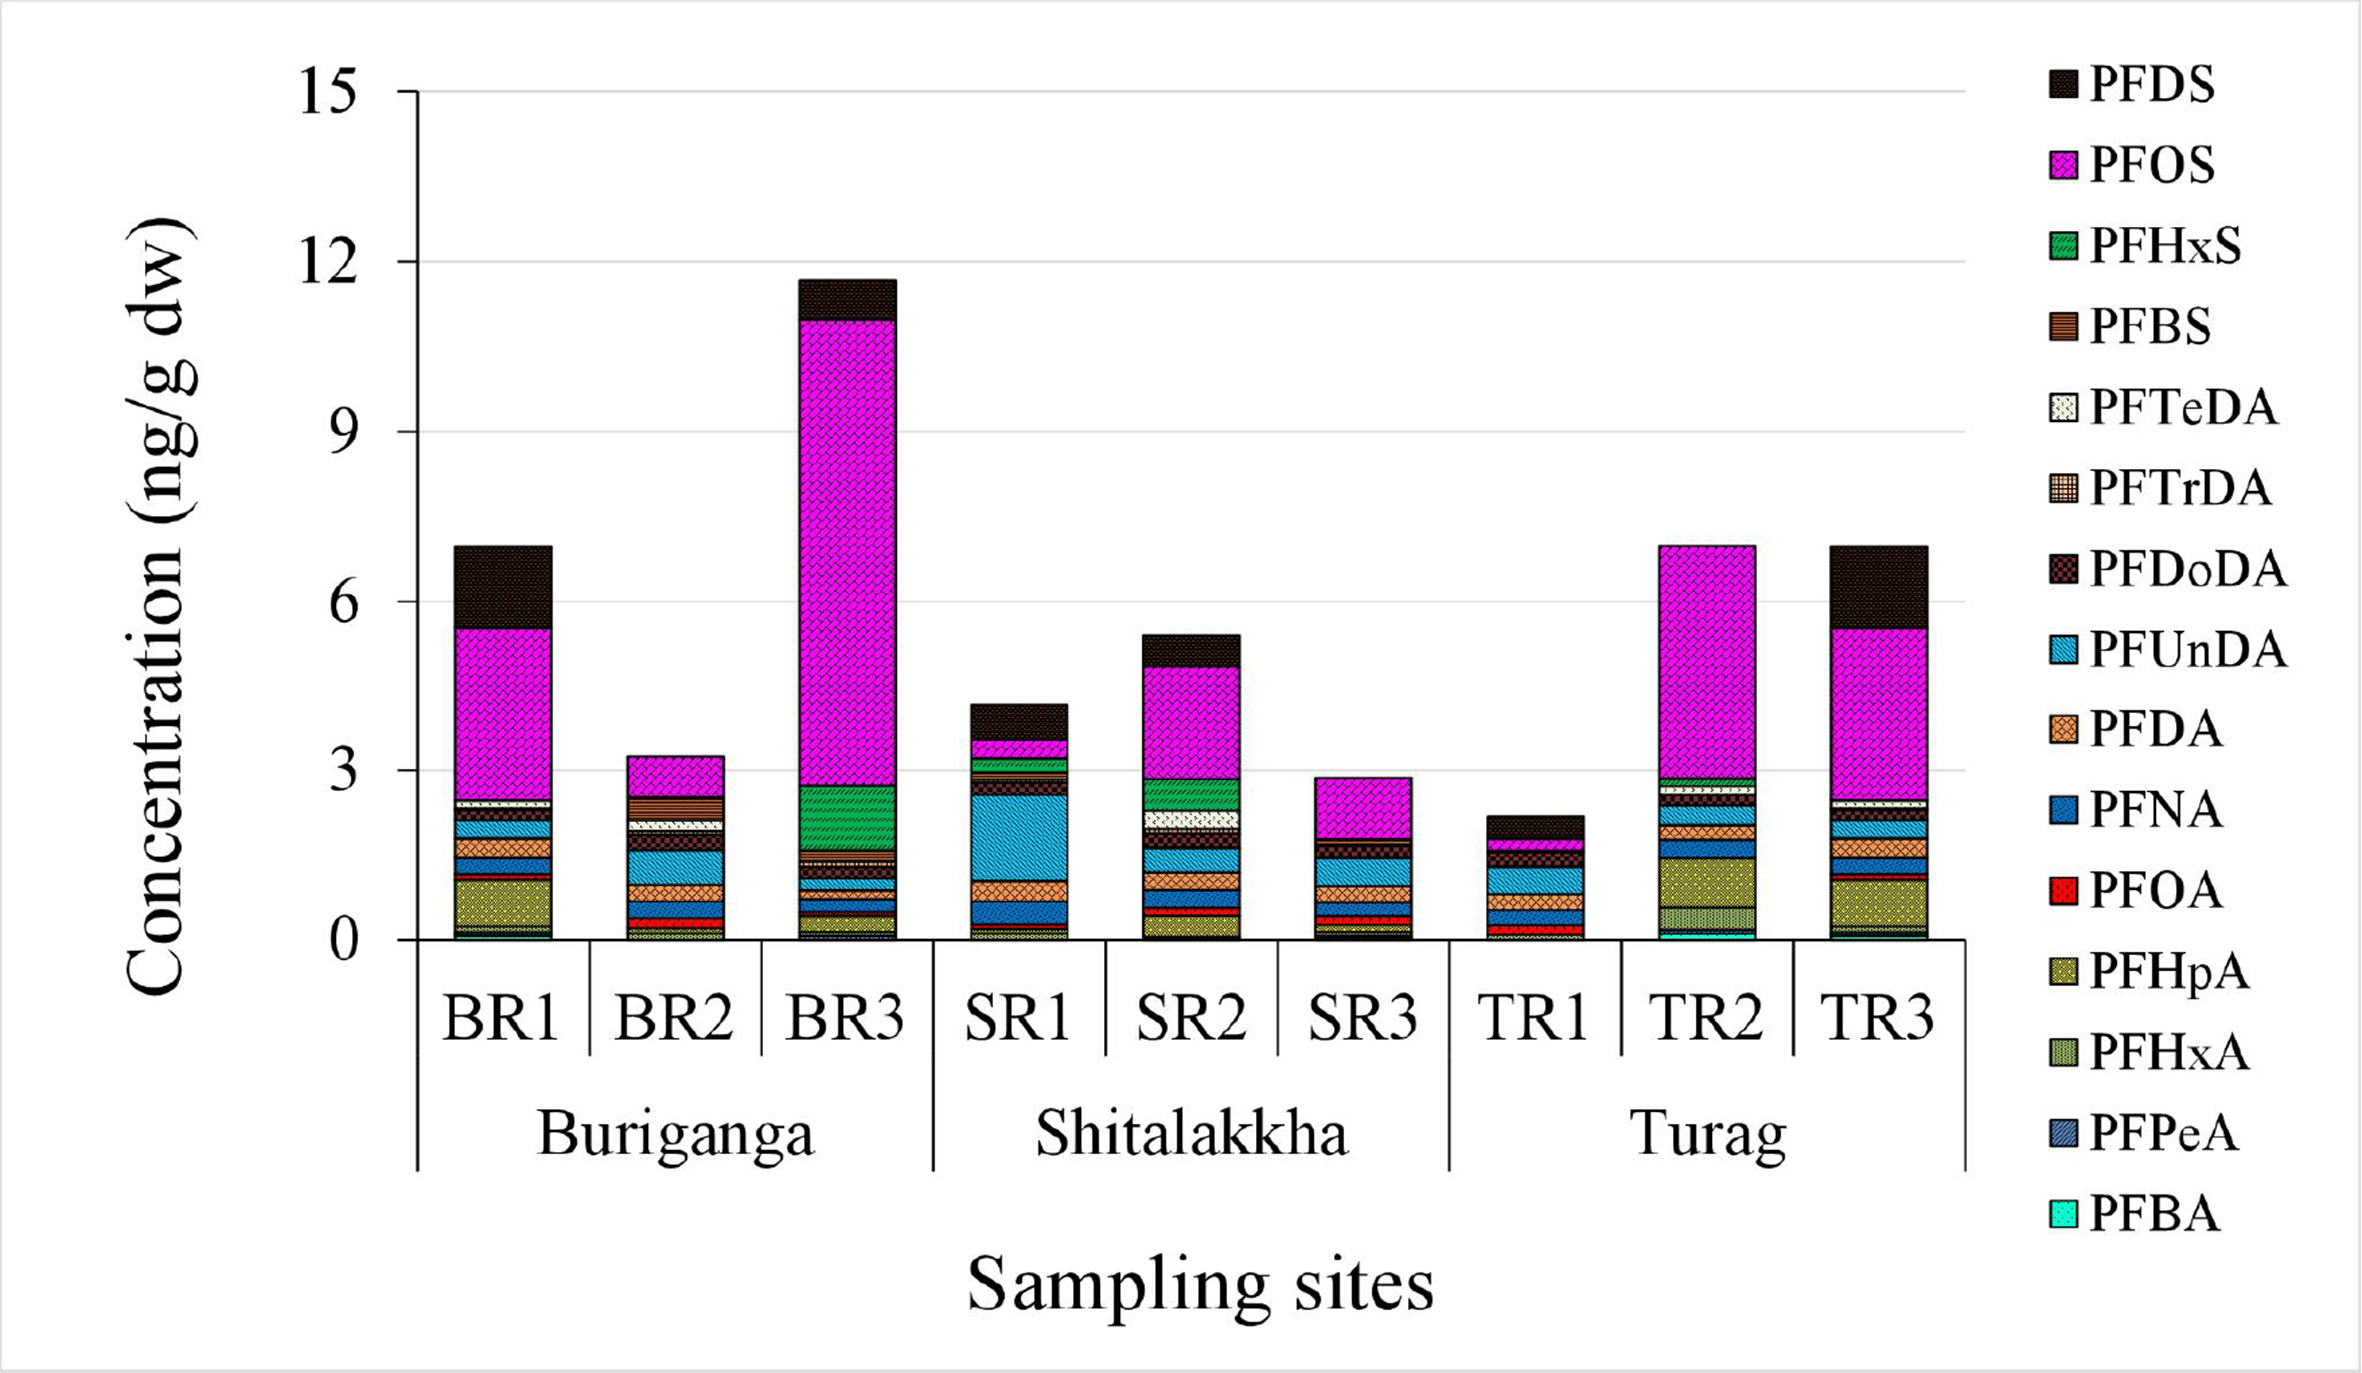
Figure 4. ΣPFASs concentrations (ng/g dry weight) in sediment samples from the Buriganga, Shitalakkha, and Turag Rivers. ΣPFASs: Total per- and polyfluoroalkyl substances.
Concentrations (ng/g dry weight) of PFASs in sediment samples from the three rivers
| PFASs | Buriganga | Shitalakkha | Turag | ||||||||||||
| BR1 | BR2 | BR3 | Mean | SD | SR1 | SR2 | SR3 | Mean | SD | TR1 | TR2 | TR3 | Mean | SD | |
| PFCAs | |||||||||||||||
| PFBA | 0.07 | < LOD | < LOD | 0.07 | 0.00 | < LOD | < LOD | 0.03 | 0.03 | 0.00 | < LOD | 0.11 | 0.07 | 0.09 | 0.02 |
| PFPeA | 0.06 | < LOD | 0.06 | 0.06 | 0.00 | < LOD | < LOD | 0.03 | 0.03 | 0.00 | < LOD | 0.07 | 0.06 | 0.07 | 0.01 |
| PFHxA | 0.11 | 0.11 | 0.08 | 0.10 | 0.02 | 0.11 | 0.05 | 0.07 | 0.08 | 0.03 | 0.09 | 0.40 | 0.11 | 0.20 | 0.18 |
| PFHpA | 0.82 | 0.09 | 0.28 | 0.40 | 0.38 | 0.08 | 0.38 | 0.13 | 0.20 | 0.16 | < LOD | 0.87 | 0.82 | 0.84 | 0.03 |
| PFOA | 0.10 | 0.18 | 0.06 | 0.11 | 0.06 | 0.09 | 0.14 | 0.15 | 0.13 | 0.04 | 0.17 | < LOQ | 0.10 | 0.13 | 0.04 |
| PFNA | 0.30 | 0.30 | 0.24 | 0.28 | 0.03 | 0.40 | 0.31 | 0.24 | 0.32 | 0.08 | 0.27 | 0.32 | 0.30 | 0.30 | 0.02 |
| PFDA | 0.33 | 0.30 | 0.15 | 0.26 | 0.09 | 0.36 | 0.31 | 0.28 | 0.32 | 0.04 | 0.27 | 0.26 | 0.33 | 0.29 | 0.04 |
| PFUnDA | 0.32 | 0.61 | 0.21 | 0.38 | 0.20 | 1.53 | 0.44 | 0.51 | 0.83 | 0.61 | 0.50 | 0.34 | 0.32 | 0.39 | 0.10 |
| PFDoDA | 0.18 | 0.27 | 0.20 | 0.22 | 0.05 | 0.21 | 0.25 | 0.21 | 0.23 | 0.02 | 0.24 | 0.19 | 0.18 | 0.20 | 0.03 |
| PFTrDA | 0.03 | 0.06 | 0.09 | 0.06 | 0.03 | 0.05 | 0.08 | < LOD | 0.07 | 0.02 | 0.03 | < LOD | 0.03 | 0.03 | 0.00 |
| PFTeDA | 0.15 | 0.19 | < LOD | 0.17 | 0.03 | < LOD | 0.33 | < LOD | 0.33 | 0.00 | < LOD | 0.15 | 0.15 | 0.15 | 0.00 |
| ΣPFCAs | 2.47 | 2.11 | 1.38 | 1.99 | 0.55 | 2.84 | 2.28 | 1.67 | 2.26 | 0.58 | 1.57 | 2.72 | 2.47 | 2.25 | 0.60 |
| PFSAs | |||||||||||||||
| PFBS | < LOD | 0.40 | 0.20 | 0.30 | 0.14 | 0.12 | < LOD | 0.10 | 0.11 | 0.01 | < LOD | < LOD | < LOD | < LOD | 0.00 |
| PFHxS | < LOD | < LOD | 1.14 | 1.14 | 0.00 | 0.25 | 0.56 | < LOD | 0.40 | 0.22 | < LOD | 0.13 | < LOD | 0.13 | 0.00 |
| PFOS | 3.06 | 0.72 | 8.25 | 4.01 | 3.85 | 0.33 | 2.01 | 1.09 | 1.14 | 0.84 | 0.21 | 4.13 | 3.06 | 2.47 | 2.02 |
| PFDS | 1.44 | < LOD | 0.69 | 1.06 | 0.53 | 0.62 | 0.55 | < LOD | 0.59 | 0.05 | 0.39 | < LOD | 1.44 | 0.91 | 0.74 |
| ΣPFSAs | 4.50 | 1.13 | 10.28 | 5.30 | 4.63 | 1.32 | 3.11 | 1.19 | 1.88 | 1.07 | 0.61 | 4.27 | 4.50 | 3.12 | 2.18 |
| ΣPFASs | 6.97 | 3.24 | 11.67 | 7.29 | 4.22 | 4.16 | 5.40 | 2.86 | 4.14 | 1.27 | 2.18 | 6.98 | 6.97 | 5.38 | 2.77 |
PFHxA, PFNA, PFDA, PFUnDA, and PFOS were consistently found across all sites [Figure 5]. PFOS concentrations (0.21-8.25 ng/g dw) dominated, contributing up to 71% of ΣPFASs, especially in the Buriganga (mean: 4.01 ng/g dw). This reflects historical usage, persistence, and affinity of PFOS for sediments[9]. PFUnDA and PFDS also contributed notably (2%-37% and 0%-21%, respectively), while others such as PFNA, PFHpA, and PFDoDA were present at moderate levels. The prevalence of PFOS in sediment aligns with findings from other urban rivers including the Chaobai[61], Tangxun Lake[62], and Júcar[43]. Exceptions exist, such as the Huangpu River, where PFOA dominated[38].
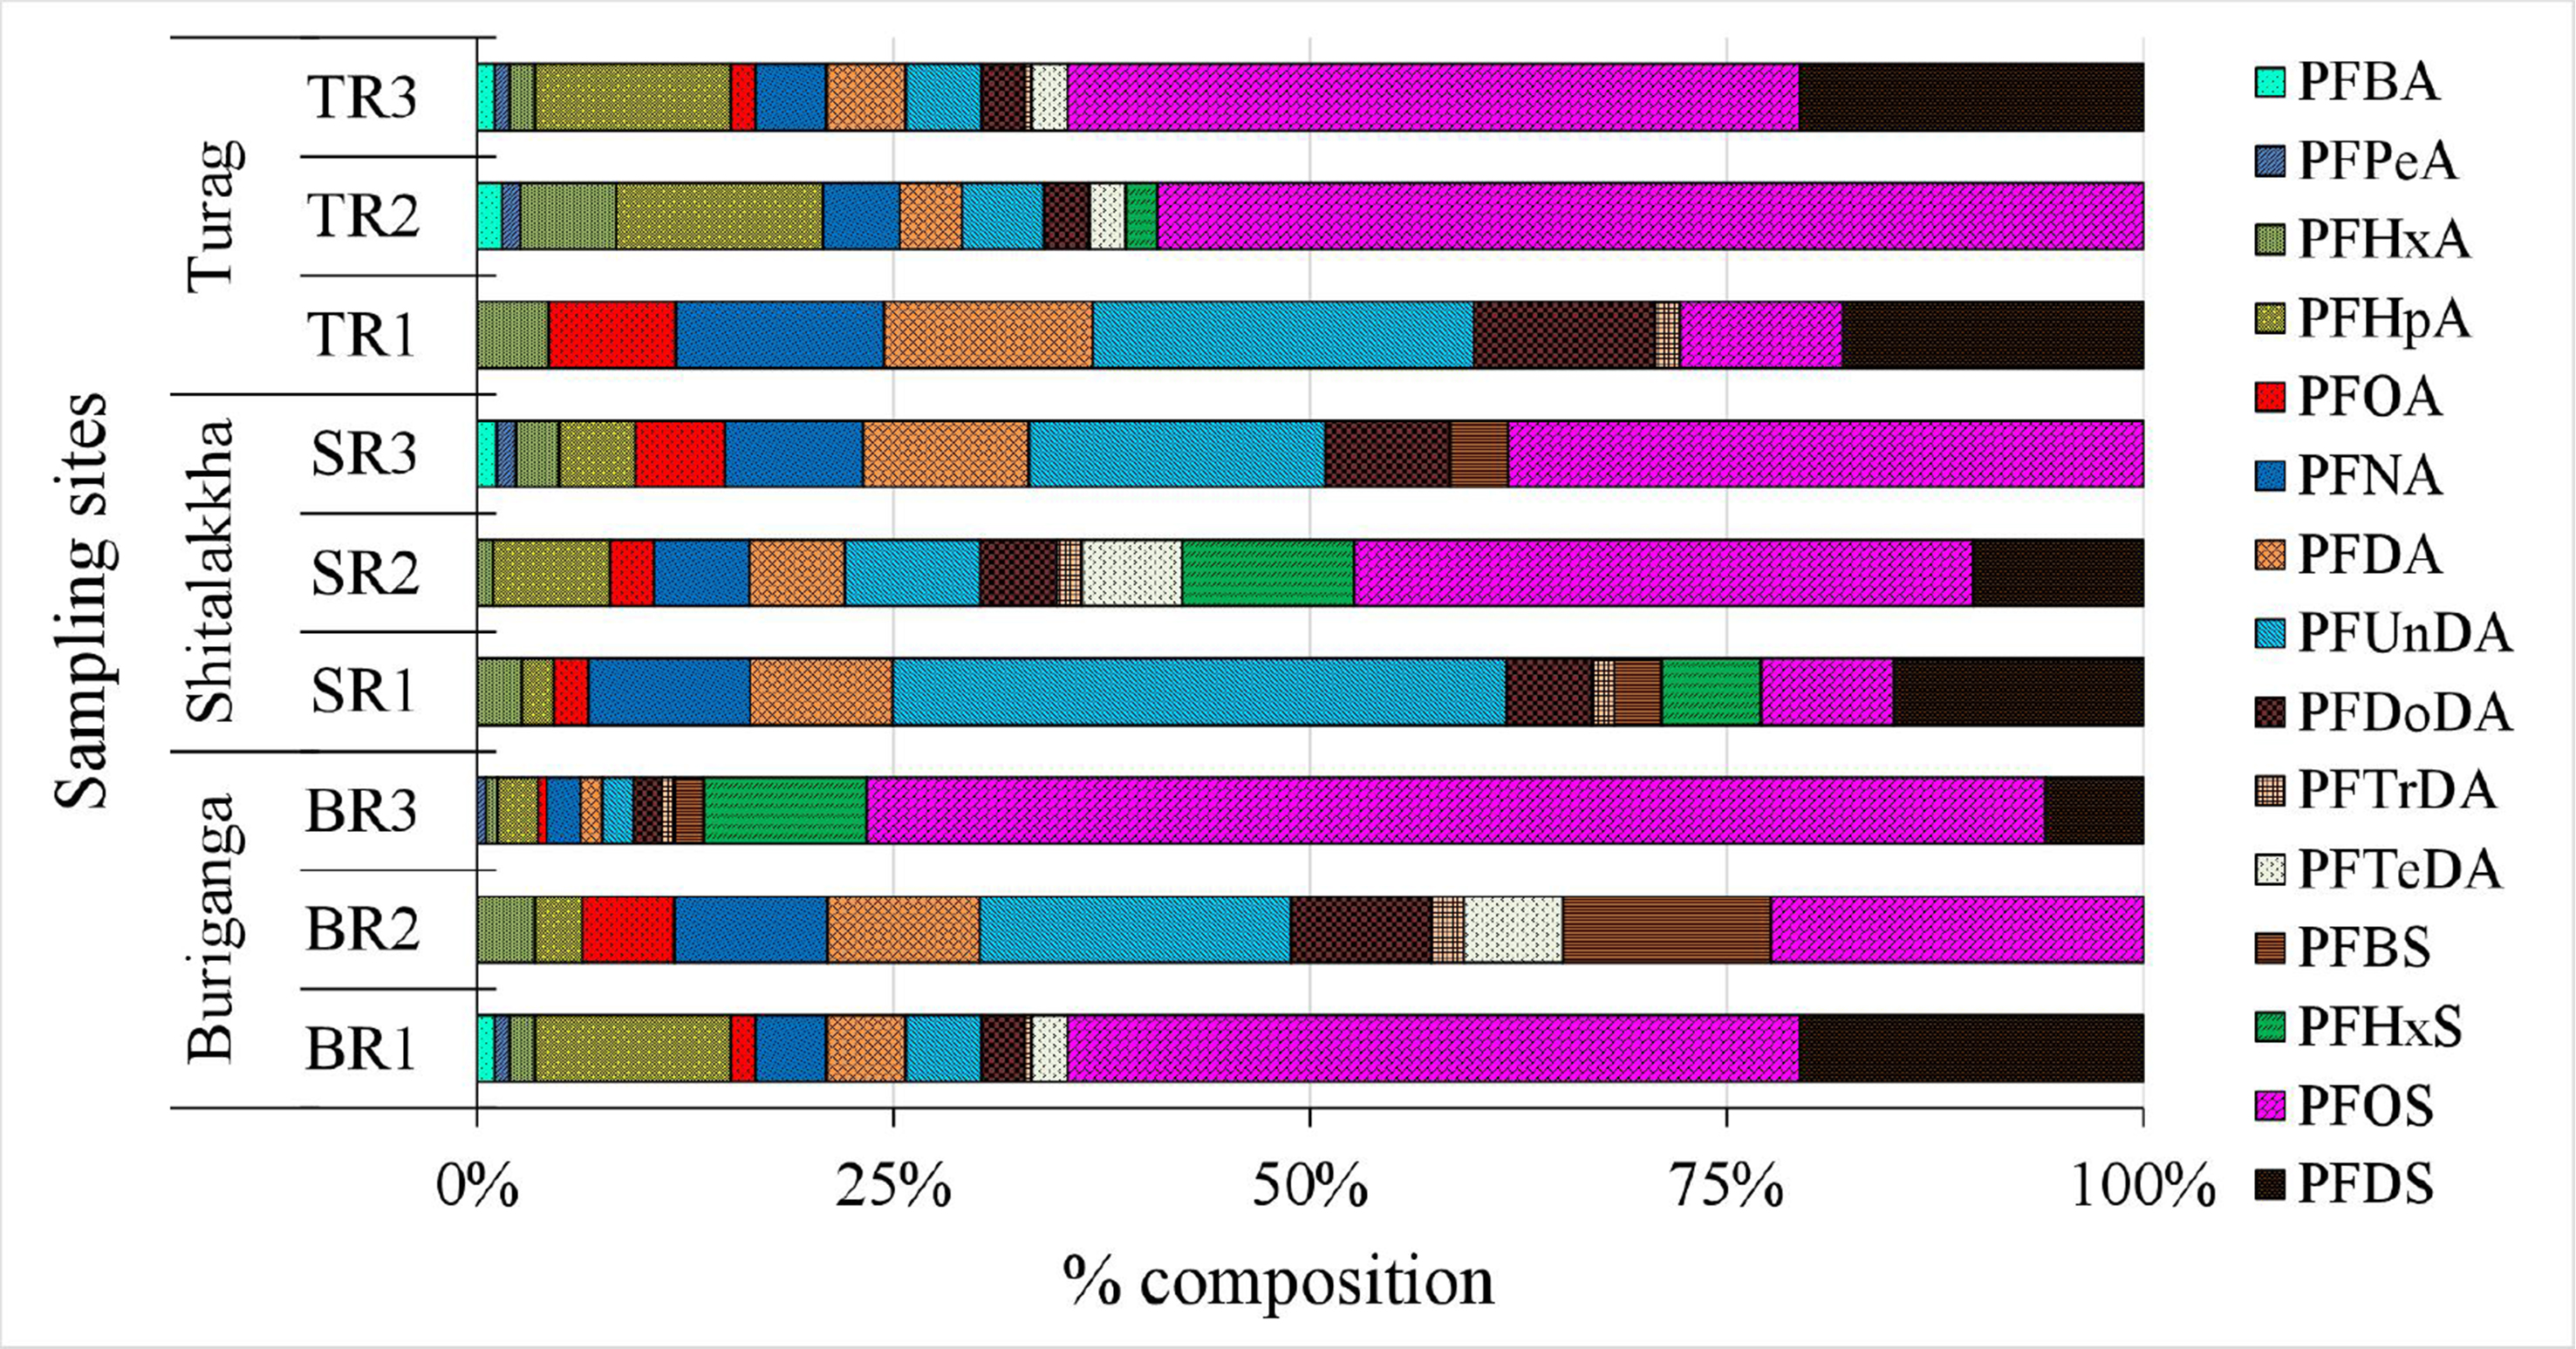
Figure 5. Relative composition (%) of individual PFAS compounds in sediment samples. PFAS: Per- and polyfluoroalkyl substance.
Compared to international datasets [Supplementary Table 5], sedimentary ΣPFAS levels in Dhaka were moderate. They were lower than those in highly contaminated sites (e.g., Liuxi, Júcar, Tangxun Lake)[43,52,62], but comparable to or slightly lower than levels in the Orge River[63], Conasauga River[64], and Jiulong River[43]. Higher levels were observed compared to the Chaobai, Elbe, Savannah, and Pearl Rivers[38,61,62,65]. PFOS concentrations in sediments observed in the present study were similar to those in the Júcar[43] and Conasauga Rivers[64] but exceeded values from the Chaobai, Elbe, and Pearl Rivers[38,61,62]. In contrast, PFOA levels in sediments in this study (< LOQ to 0.18 ng/g dw) were significantly lower than international reports from the Uji and Xiaoqing Rivers[66,67]. The widespread presence of PFASs, particularly PFOS, in this study reflects persistent contamination driven by historical and ongoing discharges. Though levels are moderate globally, they indicate the need for stricter regulatory action and comprehensive monitoring in urban river systems.
Spatial distribution and source analysis of PFASs
To elucidate the potential sources and environmental behaviors of PFASs in the Buriganga, Shitalakkha, and Turag Rivers, both compositional analysis and multivariate statistical modeling were employed. Specifically, a comparative assessment of PFAS concentration patterns was conducted alongside PCA using the mean concentrations of 15 target PFASs in both water and sediment matrices.
PFAS composition patterns
The spatial distribution and chemical composition of PFASs varied significantly across the three rivers, highlighting differences in historical pollution profiles, ongoing industrial activities, and the partitioning behavior of individual PFAS compounds.
In the water samples, the Buriganga River exhibited the highest total PFAS concentrations, with a clear dominance of legacy long-chain compounds such as PFOA (mean: 39.34 ng/L), PFHxA (11.82 ng/L), and PFOS (2.88 ng/L). These concentrations reflect the influence of decades-long industrial operations along the riverbanks, particularly from tanneries, dyeing factories, and chemical manufacturing plants. Given that the Buriganga River lies downstream of the Turag River and the two rivers are hydrologically connected [Figure 1], it is plausible that PFASs discharged into the Turag River contribute to the overall PFAS load detected in the Buriganga River. The hydrological linkage facilitates downstream transport, potentially influencing both the concentration and chemical composition of PFASs in the Buriganga. However, the higher concentrations of legacy long-chain PFASs observed in the Buriganga also indicate significant direct local inputs from surrounding industrial activities, suggesting that both upstream contributions and local discharges play important roles in shaping the contamination profile. In contrast, the Shitalakkha River showed a greater relative abundance of short-chain PFASs, notably PFBA (2.89 ng/L) and PFPeA (1.67 ng/L), compounds that are increasingly being used as replacements for phased-out long-chain PFASs in food packaging, surfactants, and paper products. The Turag River presented a mixed profile, characterized by elevated levels of both short-chain (PFHxA: 10.56 ng/L) and mid-to-long-chain PFASs such as PFUnDA (1.32 ng/L) and PFOS (1.98 ng/L), indicative of a complex mixture of effluents from various industrial sectors, potentially including electronics, pharmaceuticals, and small-scale mixed-use facilities.
In the sediment phase, the composition shifted toward longer-chain and more hydrophobic PFASs, which exhibit a higher tendency to sorb to particulate matter. The Buriganga River sediments were notably enriched in PFOS (4.01 ng/g) and PFDS (1.06 ng/g), along with PFHxS (1.14 ng/g), the latter being undetectable in many water samples. This pattern strongly suggests legacy contamination from historical industrial practices and highlights the environmental persistence of these compounds within benthic environments. Sediments from the Shitalakkha River exhibited a more balanced PFAS profile, with detectable levels of both long-chain legacy compounds (e.g., PFOS: 1.14 ng/g, PFDS: 0.59 ng/g) and emerging PFASs (e.g., PFTeDA: 0.33 ng/g), pointing to both historical and ongoing industrial inputs. Turag sediments were characterized by relatively high concentrations of PFOS (2.47 ng/g) and PFDS (0.91 ng/g), accompanied by mid-chain compounds such as PFHpA (0.84 ng/g) and PFHxA (0.20 ng/g). These findings suggest that the river is affected by both persistent legacy discharges and recent inputs of newer PFAS formulations.
Together, the water and sediment profiles indicate not only spatial heterogeneity in PFAS contamination but also a temporal shift in compound usage patterns. The sediment data, in particular, reinforce the presence of persistent legacy pollution, underscoring the need for long-term monitoring and remediation strategies that account for both dissolved and particulate-phase PFASs.
PCA
To further differentiate PFAS source signatures and understand environmental partitioning behaviors, PCA was applied to standardized mean concentrations of PFASs in both water and sediment matrices. The first two components explained 81.1% of the total variance, with PC1 accounting for 54.47% and PC2 for 26.63% [Figure 6]. PC1 was strongly associated with the overall PFAS burden, particularly long-chain compounds such as PFHxA, PFHpA, PFDA, and PFOS. PC2 captured variability linked to partitioning behavior between water and sediment, highlighting PFTrDA and PFUnDA, which may indicate contributions from niche industrial applications.
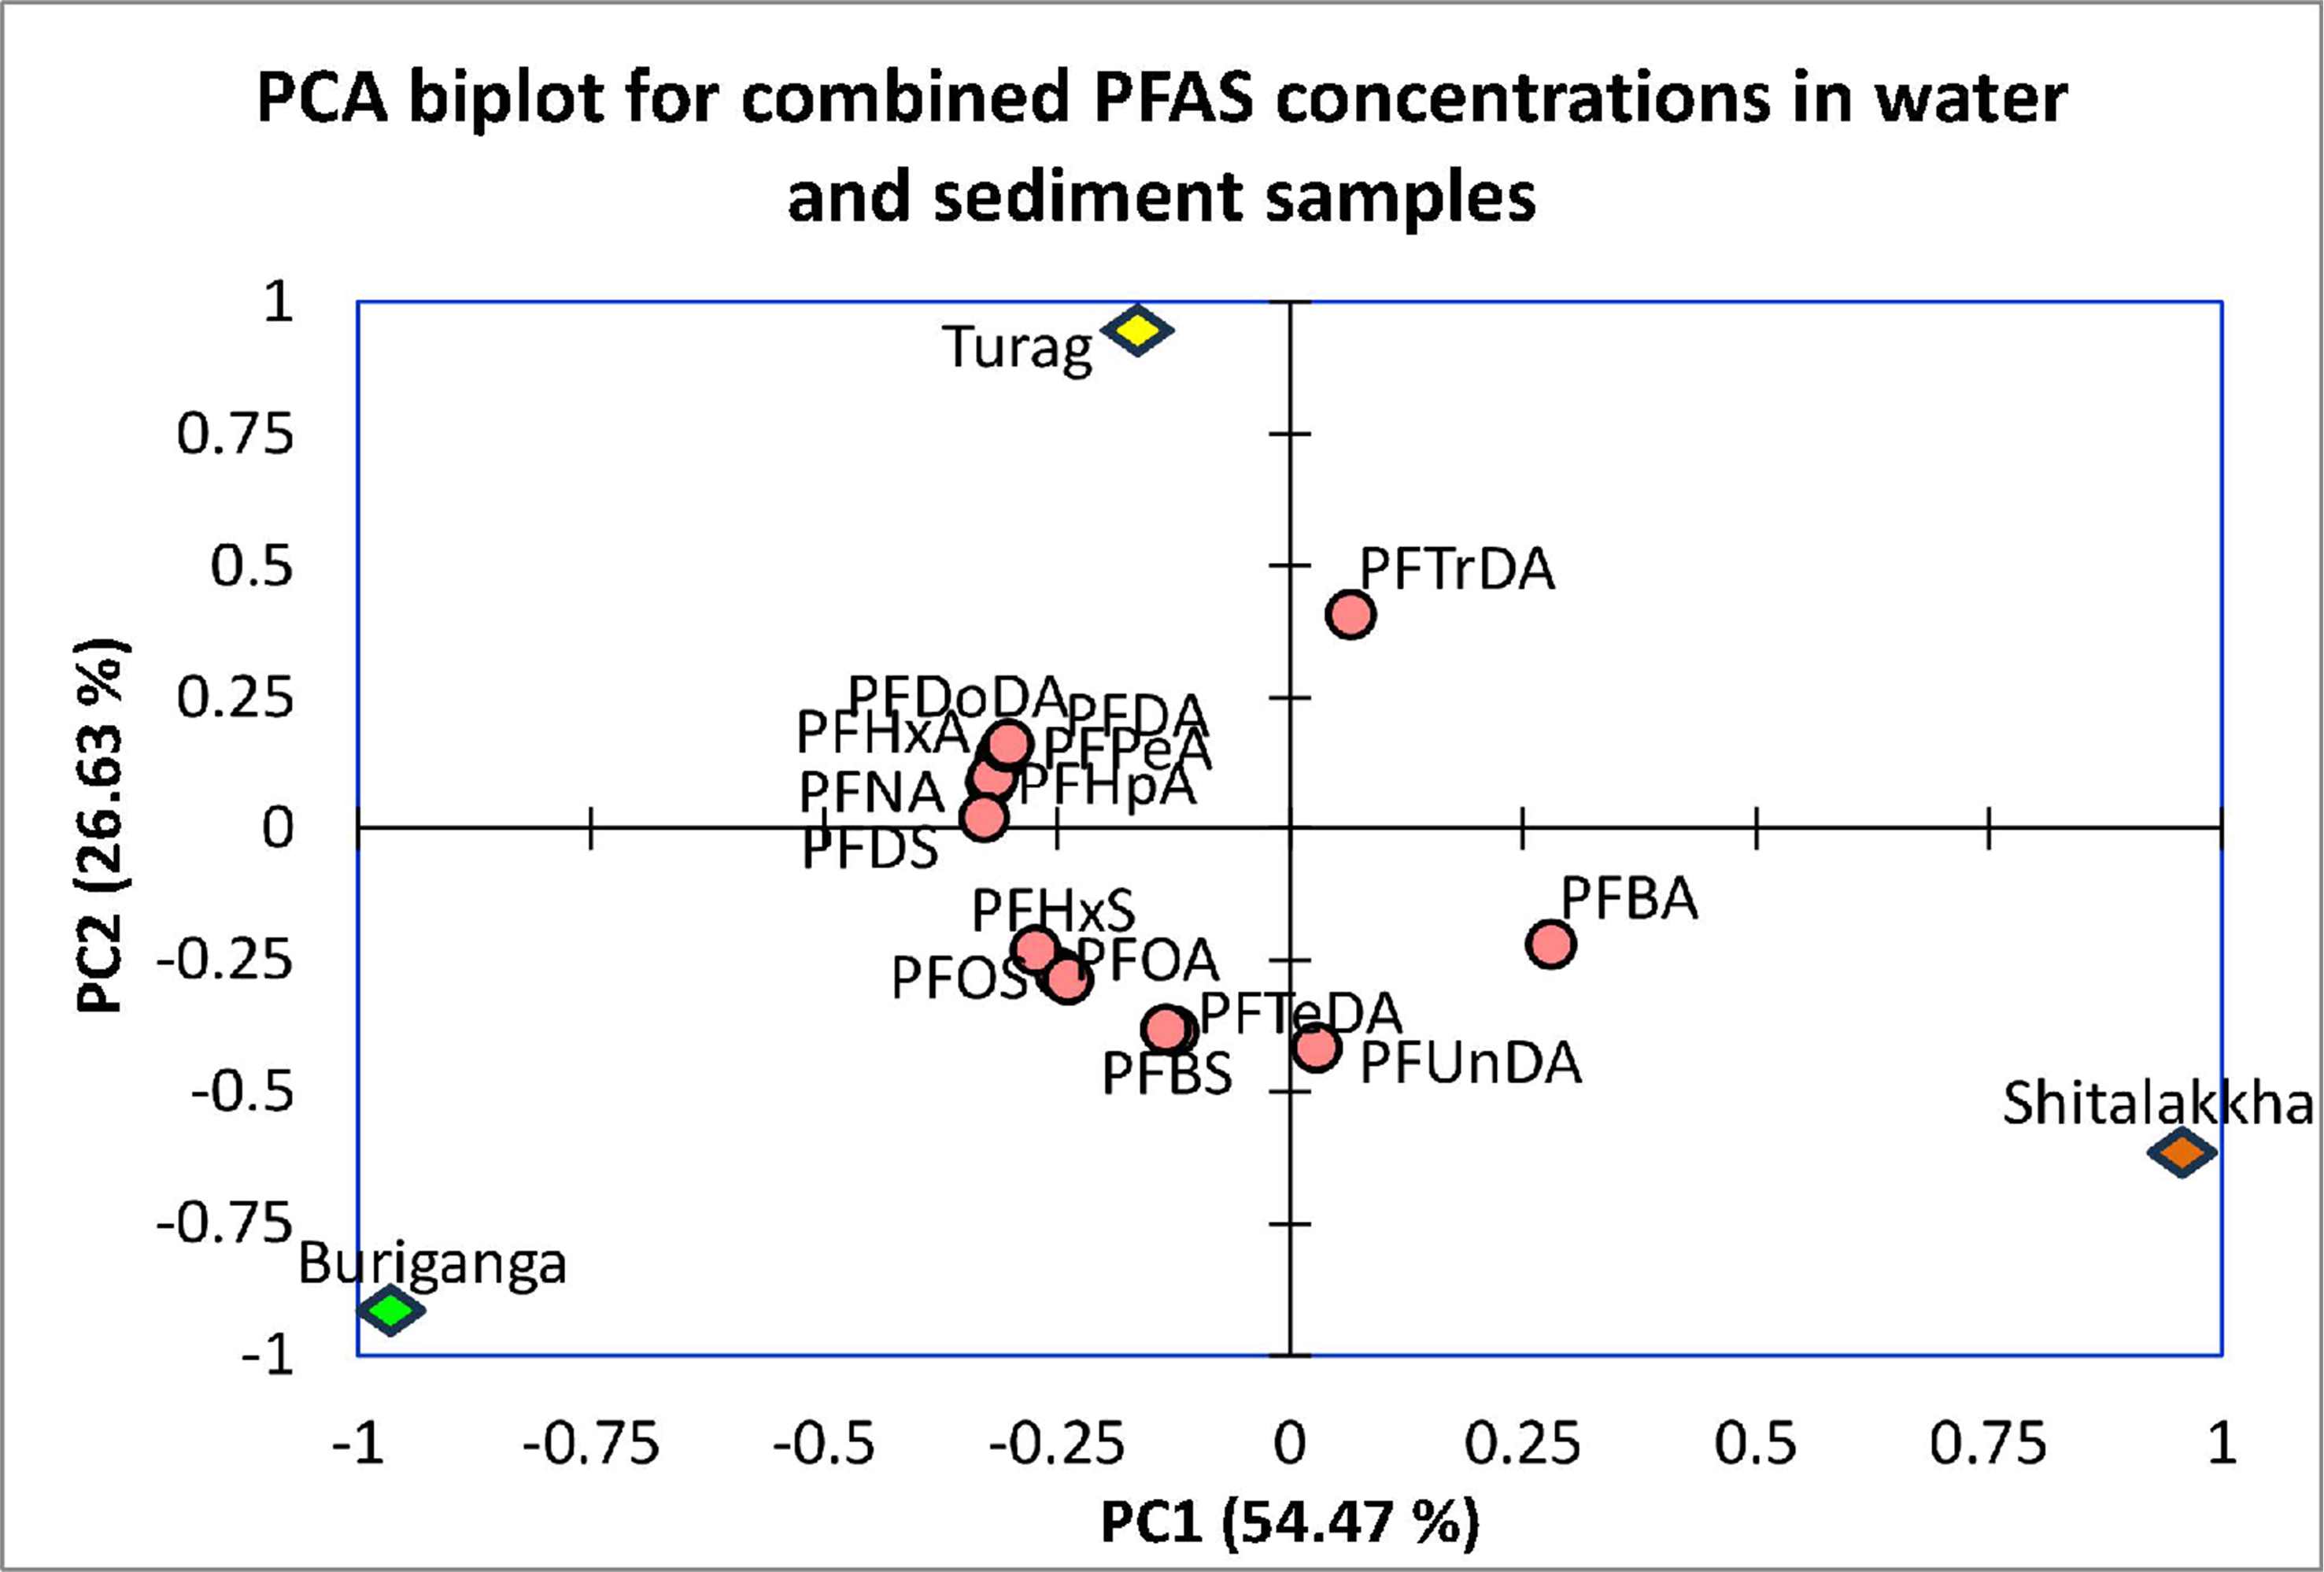
Figure 6. PCA biplot of PFAS concentrations in water and sediment, illustrating spatial clustering of sampling sites (Buriganga, Turag and Shitalakkha) and associations with specific PFAS compounds. PCA: Principal component analysis; PFAS: per- and polyfluoroalkyl substance.
The PCA biplot revealed clear spatial clustering of river systems. Buriganga was situated on the negative axes of both PC1 and PC2, influenced by sediment-associated legacy PFASs (e.g., PFOS, PFHxS, PFNA), consistent with long-standing industrial pollution. This aligns with the role of the Buriganga River as the primary recipient of untreated industrial and domestic wastewater in Dhaka[68,69]. The river is flanked by tanneries, dyeing plants, metal workshops, and plastic manufacturers[70], with significant PFAS input likely from textile and garment processing. The lack of adequate waste management exacerbates PFAS accumulation and sediment resuspension continues to release these legacy contaminants[71].
Shitalakkha River clustered strongly on the positive side of PC1, driven by short-chain PFASs (PFBA, PFUnDA) predominantly in water. This composition indicates recent inputs of alternative PFASs used in modern consumer and industrial goods. The river flows through industrial zones in Narayanganj where textile, chemical, paper, and food processing units discharge effluents - often untreated - into the water system. Although less industrialized than Buriganga or Turag, persistent discharges and lack of centralized treatment contribute to measurable PFAS levels. Turag River, moderately negative on PC1 and strongly positive on PC2, exhibited a unique profile dominated by mid-chain PFASs such as PFPeA, PFDoDA, and PFTrDA. These compounds may originate from specialized or emerging sources including electronics or high-performance coatings. The Turag receives discharges from various industries in the Tongi-Gazipur zone, including tanneries and textile factories, as well as emissions from brick kilns that partially combust PFAS-containing waste[72]. Drainage channels carrying industrial effluents directly into the river further increase contamination risks[73].
The spatial variation in PFAS composition across the rivers supports the conclusion that localized industrial practices are key determinants of PFAS signatures. Legacy long-chain PFASs in Buriganga align with chronic contamination from historical industrial activity. Shitalakkha reflects a transition to short-chain alternatives, while Turag’s profile indicates inputs from emerging or niche PFAS sources.
Environmental implications
The compositional and statistical analysis of PFASs highlights significant differences in contamination profiles among the three rivers, reflecting both temporal shifts in PFAS usage and spatial heterogeneity in industrial activities. PFAS profile in Buriganga indicates historical accumulation of long-chain PFASs in sediments due to extensive legacy discharges. These pollutants are continually released into the water column via sediment resuspension, underscoring the need for sediment remediation and legacy pollutant management. Shitalakkha demonstrates increasing influence from short-chain PFASs, likely linked to contemporary industrial usage and consumer goods manufacturing. Regulatory monitoring and control of modern short-chain PFAS applications are crucial to preventing future contamination. Turag represents an intermediate case, with signatures pointing to specialized industrial inputs including mid-chain PFASs. Given its mixed-use industrial zones and emerging pollution sources like brick kilns and electronics manufacturing, proactive surveillance is necessary to identify and manage novel PFAS contributors. These findings emphasize the importance of localized, river-specific mitigation strategies: legacy pollution control in the Buriganga, regulatory oversight of short-chain PFASs in the Shitalakkha, and targeted monitoring of emerging PFAS sources in the Turag River basin.
Ecological risk assessment
In this study, the risk assessment of PFASs for aquatic organisms was conducted based on the RQ method. In surface water samples, most PFASs exhibited very low ecological risks, with RQ values generally below 0.01 across all sampling sites [Table 3]. However, PFUnDA presented moderate ecological concern at specific locations, particularly at station BR3, where the RQ reached 0.634. PFOA, a well-documented persistent pollutant with significant toxicological relevance, showed consistently higher RQs than other compounds, ranging between 0.0057 and 0.0369 - indicating low to potentially moderate risk. Other compounds, including PFDoDA and PFTrDA, also demonstrated elevated RQs at isolated sites, although these remained within the low-risk category. Sediment samples exhibited a similar risk pattern, with most PFASs presenting negligible ecological risk. Notably, PFOS posed a significant threat, with RQ values exceeding 1 at multiple locations and reaching a peak of 1.68 at station BR3, thus falling into the high-risk category [Table 3]. PFUnDA and PFDoDA also exhibited low to moderate risk, with RQs ranging from 0.0052 to 0.0373 and 0.0056 to 0.0085, respectively. Although PFOA was consistently detected in sediment, its RQ values (0.00013-0.00207) remained well below levels of concern.
RQ values of PFASs in water and sediment samples
| RQ | |||||||||
| Sites | BR1 | BR2 | BR3 | SR1 | SR2 | SR3 | TR1 | TR2 | TR3 |
| Water | |||||||||
| PFBA | 3.64E-08 | 9.39E-06 | 8.10E-06 | 3.64E-08 | 2.63E-05 | 3.64E-08 | 3.95E-06 | 4.21E-06 | 3.64E-08 |
| PFPeA | 7.19E-05 | 1.05E-04 | 6.73E-05 | 4.74E-05 | 1.88E-07 | 5.72E-05 | 4.72E-05 | 6.30E-05 | 1.27E-04 |
| PFHxA | 1.36E-04 | 1.03E-04 | 1.27E-04 | 8.07E-05 | 5.80E-05 | 3.06E-05 | 3.39E-05 | 1.63E-04 | 1.29E-04 |
| PFHpA | 3.05E-04 | 4.12E-04 | 3.37E-04 | 2.11E-04 | 2.73E-04 | 3.27E-04 | 2.60E-04 | 3.00E-04 | 3.18E-04 |
| PFOA | 1.95E-02 | 3.69E-02 | 2.63E-02 | 9.55E-03 | 1.22E-02 | 1.77E-02 | 5.69E-03 | 1.29E-02 | 1.76E-02 |
| PFNA | 3.47E-06 | 3.59E-06 | 3.39E-06 | 1.13E-06 | 1.37E-06 | 1.43E-06 | 2.82E-06 | 3.21E-06 | 3.36E-06 |
| PFDA | 3.52E-02 | 4.12E-02 | 3.69E-02 | 1.11E-02 | 1.41E-02 | 3.85E-02 | 3.07E-02 | 4.15E-02 | 3.88E-02 |
| PFUnDA | 2.25E-03 | 2.57E-01 | 1.20E-01 | 4.10E-02 | 2.91E-01 | 5.97E-02 | 2.25E-03 | 2.25E-03 | 1.65E-01 |
| PFDoDA | 2.00E-02 | 5.56E-01 | 6.34E-01 | 2.00E-02 | 2.00E-02 | 2.00E-02 | 2.00E-02 | 6.34E-01 | 2.00E-02 |
| PFTrDA | 4.78E-03 | 2.21E-03 | 4.17E-03 | 3.14E-03 | 3.57E-03 | 4.55E-03 | 3.90E-03 | 5.21E-03 | 1.17E-04 |
| PFTeDA | 7.87E-03 | 8.96E-03 | 4.80E-03 | 2.78E-03 | 6.19E-03 | 3.77E-03 | 3.74E-03 | 6.84E-03 | 1.45E-04 |
| PFBS | 1.08E-07 | 1.08E-07 | 3.36E-06 | 1.52E-06 | 2.34E-06 | 3.51E-06 | 9.07E-07 | 9.95E-07 | 2.49E-06 |
| PFHxS | 1.01E-05 | 1.67E-05 | 5.50E-06 | 8.00E-08 | 8.00E-08 | 8.00E-08 | 4.87E-06 | 5.70E-07 | 9.98E-07 |
| PFOS | 3.01E-03 | 9.60E-03 | 1.55E-03 | 1.99E-03 | 5.89E-03 | 9.76E-03 | 2.48E-03 | 4.60E-03 | 2.65E-03 |
| PFDS | 2.95E-05 | 9.74E-07 | 4.86E-05 | 4.76E-05 | 9.74E-07 | 2.22E-05 | 3.73E-05 | 9.74E-07 | 9.74E-07 |
| Sediment | |||||||||
| PFBA | 3.05E-04 | 6.42E-05 | 6.42E-05 | 6.42E-05 | 6.42E-05 | 1.43E-04 | 6.42E-05 | 4.38E-04 | 3.05E-04 |
| PFPeA | 2.72E-04 | 6.60E-06 | 2.77E-04 | 6.60E-06 | 6.60E-06 | 1.41E-04 | 6.60E-06 | 3.29E-04 | 2.72E-04 |
| PFHxA | 3.74E-05 | 3.95E-05 | 2.81E-05 | 3.95E-05 | 1.81E-05 | 2.65E-05 | 3.32E-05 | 1.43E-04 | 3.74E-05 |
| PFHpA | 8.17E-04 | 9.35E-05 | 2.84E-04 | 7.93E-05 | 3.79E-04 | 1.30E-04 | 1.99E-06 | 8.64E-04 | 8.17E-04 |
| PFOA | 1.20E-03 | 2.07E-03 | 6.90E-04 | 1.01E-03 | 1.66E-03 | 1.79E-03 | 1.93E-03 | 1.34E-04 | 1.20E-03 |
| PFNA | 1.16E-06 | 1.16E-06 | 9.29E-07 | 1.58E-06 | 1.21E-06 | 9.29E-07 | 1.07E-06 | 1.25E-06 | 1.16E-06 |
| PFDA | 6.45E-03 | 5.76E-03 | 3.00E-03 | 6.92E-03 | 5.99E-03 | 5.53E-03 | 5.30E-03 | 5.07E-03 | 6.45E-03 |
| PFUnDA | 7.80E-03 | 1.47E-02 | 5.20E-03 | 3.73E-02 | 1.07E-02 | 1.24E-02 | 1.21E-02 | 8.38E-03 | 7.80E-03 |
| PFDoDA | 5.56E-03 | 8.52E-03 | 6.30E-03 | 6.67E-03 | 7.78E-03 | 6.67E-03 | 7.41E-03 | 5.93E-03 | 5.56E-03 |
| PFTrDA | 2.87E-06 | 5.80E-06 | 8.38E-06 | 5.13E-06 | 7.39E-06 | 1.41E-07 | 3.08E-06 | 1.41E-07 | 2.87E-06 |
| PFTeDA | 3.89E-06 | 5.06E-06 | 2.61E-08 | 2.61E-08 | 8.53E-06 | 2.61E-08 | 2.61E-08 | 3.93E-06 | 3.89E-06 |
| PFBS | 5.22E-06 | 2.34E-04 | 1.17E-04 | 6.89E-05 | 5.22E-06 | 5.78E-05 | 5.22E-06 | 5.22E-06 | 5.22E-06 |
| PFHxS | 1.54E-08 | 1.54E-08 | 2.94E-06 | 6.35E-07 | 1.43E-06 | 1.54E-08 | 1.54E-08 | 3.47E-07 | 1.54E-08 |
| PFOS | 6.25E-01 | 1.48E-01 | 1.68E+00 | 6.78E-02 | 4.09E-01 | 2.23E-01 | 4.36E-02 | 8.43E-01 | 6.25E-01 |
| PFDS | 1.19E-03 | 6.65E-06 | 5.71E-04 | 5.17E-04 | 4.58E-04 | 6.65E-06 | 3.27E-04 | 6.65E-06 | 1.19E-03 |
The spatial distribution of elevated RQs, particularly at station BR3, suggests the presence of localized point-source contamination. This pattern aligns with intensive industrial activity near the sampling locations, including garment washing, textile dyeing, tanning, and metal processing facilities - many of which are known to discharge PFAS-containing effluents directly into the river systems[74,75]. High concentrations of PFDoDA in water and PFOS in sediment at these sites point to persistent industrial discharges and poor wastewater management.
Although the majority of PFASs did not individually exceed ecological risk thresholds, the presence of PFOS and PFOA at elevated levels in both environmental compartments raises concerns due to their well-established persistence, bioaccumulative potential, and toxicity to aquatic biota[76,77]. Specific ecological impacts include endocrine disruption in fish by PFOS/PFOA, causing altered hormones, impaired reproduction, and developmental defects[78,79]. Aquatic invertebrates exhibit reduced growth, survival, and feeding rates under PFAS exposure[80]. Such effects threaten species survival and may disrupt trophic dynamics and community structures in freshwater ecosystems. Moreover, the risk associated with chronic, low-level exposure and mixture effects may not be adequately captured by traditional RQ-based assessments. Limited toxicity data for emerging PFASs, combined with uncertainty in PNEC derivation, further complicates accurate risk characterization[81]. To address these limitations, future assessments should incorporate more comprehensive toxicological datasets, consider sublethal and chronic exposure scenarios, and employ probabilistic and mixture-based frameworks to better account for cumulative effects[82,83]. Long-term monitoring and regulatory interventions are essential to manage and mitigate the ecological risks posed by PFASs in freshwater ecosystems, particularly in urban areas experiencing rapid industrial expansion.
Additionally, the ecological risk assessment of PFASs in the studied rivers highlights not only the threat to aquatic organisms but also the potential implications for human health. As PFASs are highly persistent and bioaccumulative, their presence in water and sediment may lead to trophic transfer through aquatic food webs, ultimately reaching humans via the consumption of contaminated fish and other consumable aquatic organisms. Additionally, direct exposure pathways such as the use of river water for irrigation, bathing, or other domestic purposes may increase the likelihood of human exposure. Extensive epidemiological studies link PFAS exposure (notably PFOA/PFOS) to adverse human health outcomes, including elevated cholesterol, hypertension, altered liver enzymes, reduced vaccine response, thyroid disruption, and reproductive effects (e.g., lower fertility and birth weight)[84,85]. Long-term exposure correlates with kidney and testicular cancers[86], underscoring the need to monitor freshwater systems that serve as indirect exposure pathways.
Limitations of the study
While this study provides critical baseline data on PFAS contamination in urban rivers of Dhaka, several limitations should be acknowledged. First, sampling was conducted only once during the dry season, which precludes assessment of temporal or seasonal variability in PFAS concentrations. Second, although 15 PFAS compounds were analyzed, only five isotope-labeled internal standards were used as surrogates; while this approach is widely accepted, it may introduce uncertainty for compounds lacking compound-specific surrogates. Third, key sediment characteristics such as total organic carbon content and grain size distribution - both of which influence PFAS sorption - were not measured, limiting our ability to fully interpret the spatial patterns in sediment contamination. Finally, while the study focused on a representative set of legacy and emerging PFASs, a broader suite of PFASs and their precursors remains uncharacterized. These limitations highlight the need for more comprehensive, long-term studies incorporating seasonal sampling, expanded PFAS analyte lists, and additional environmental parameters to better understand the fate and transport of PFASs in urban aquatic systems.
CONCLUSIONS
This study provides the first comprehensive assessment of PFAS contamination in major urban rivers in and around Dhaka city, revealing widespread presence of both legacy and emerging PFAS compounds. The Buriganga River, receiving untreated industrial effluents, showed the highest PFAS levels, with PFOA dominating water (mean: 39.34 ng/L) and PFOS sediment (mean: 4.01 ng/g dw). Spatial analysis linked contamination to textile, tannery, and chemical industries, while PCA highlighted distinct PFAS profiles reflecting historical vs. recent inputs. Ecological risk assessment identified PFOS in sediments as a high-risk pollutant, underscoring the legacy of persistent compounds. Despite lower PFAS levels compared to heavily industrialized regions globally, urban waterways in Dhaka exceed contamination benchmarks for less urbanized areas, signaling significant anthropogenic pressure. To address this, enforcing stringent industrial discharge regulations, upgrading wastewater treatment infrastructure, and implementing continuous monitoring are imperative. This work advances the understanding of PFAS dynamics in rapidly urbanizing regions and emphasizes the need for transboundary collaboration to manage these “forever chemicals”, aligning with global sustainability agendas to protect freshwater ecosystems and public health.
DECLARATIONS
Authors’ contributions
Methodology, data analysis, and draft preparation: Habibullah-Al-Mamun, M.
Sampling and methodology: Habibullah-Al-Mamun, M.; Islam, M. M.
Data analysis: Habibullah-Al-Mamun, M.; Islam, M. M.; Sakib, S.; Islam, S.; Ali, M. M.; Faruque, M. H.
Review and editing: Habibullah-Al-Mamun, M.; Islam, M. M.; Sakib, S.; Islam, S.; Ali, M. M.; Faruque, M. H.
Availability of data and materials
Information related to this article can be found in the Supplementary Materials. Further data are available from the corresponding author upon reasonable request.
Financial support and sponsorship
This work was partially supported by the Special Research Grant (No. 39.00.0000.09.06.79.2017/2) from the Ministry of Science and Technology, the Government of the People’s Republic of Bangladesh.
Conflicts of interest
Habibullah-Al-Mamun, M. is an Editorial Board member of Journal of Environmental Exposure Assessment. Habibullah-Al-Mamun, M. was not involved in any steps of editorial processing, notably including reviewer selection, manuscript handling, or decision making. The other authors declared that there are no conflicts of interest.
Ethical approval and consent to participate
Not applicable.
Consent for publication
Not applicable.
Copyright
© The Author(s) 2025.
Supplementary Materials
REFERENCES
1. Buck, R. C.; Franklin, J.; Berger, U.; et al. Perfluoroalkyl and polyfluoroalkyl substances in the environment: terminology, classification, and origins. Integr. Environ. Assess. Manag. 2011, 7, 513-41.
2. Brendel, S.; Fetter, É.; Staude, C.; Vierke, L.; Biegel-Engler, A. Short-chain perfluoroalkyl acids: environmental concerns and a regulatory strategy under REACH. Environ. Sci. Eur. 2018, 30, 9.
3. OECD. Summary report on the new comprehensive global database of Per- and Polyfluoroalkyl Substances (PFASs). 2018. https://www.oecd.org/en/publications/summary-report-on-the-new-comprehensive-global-database-of-per-and-polyfluoroalkyl-substances-pfass_1a14ad6c-en.html. (accessed 14 Aug 2025).
4. Giesy, J. P.; Kannan, K. Global distribution of perfluorooctane sulfonate in wildlife. Environ. Sci. Technol. 2001, 35, 1339-42.
5. Liu, M.; Zhang, G.; Meng, L.; et al. Associations between novel and legacy per- and polyfluoroalkyl substances in human serum and thyroid cancer: a case and healthy population in Shandong Province, East China. Environ. Sci. Technol. 2022, 56, 6144-51.
6. Faust, J. A. PFAS on atmospheric aerosol particles: a review. Environ. Sci. Process. Impacts. 2023, 25, 133-50.
7. Fenton, S. E.; Ducatman, A.; Boobis, A.; et al. Per- and polyfluoroalkyl substance toxicity and human health review: current state of knowledge and strategies for informing future research. Environ. Toxicol. Chem. 2021, 40, 606-30.
8. Habibullah-Al-Mamun, M.; Ahmed, M. K.; Raknuzzaman, M.; et al. Occurrence and assessment of perfluoroalkyl acids (PFAAs) in commonly consumed seafood from the coastal area of Bangladesh. Mar. Pollut. Bull. 2017, 124, 775-85.
9. Ahrens, L. Polyfluoroalkyl compounds in the aquatic environment: a review of their occurrence and fate. J. Environ. Monit. 2011, 13, 20-31.
10. Wang, X.; Schuster, J.; Jones, K. C.; Gong, P. Occurrence and spatial distribution of neutral perfluoroalkyl substances and cyclic volatile methylsiloxanes in the atmosphere of the Tibetan Plateau. Atmos. Chem. Phys. 2018, 18, 8745-55.
11. Galloway, J. E.; Moreno, A. V. P.; Lindstrom, A. B.; et al. Evidence of air dispersion: HFPO-DA and PFOA in Ohio and West Virginia surface water and soil near a fluoropolymer production facility. Environ. Sci. Technol. 2020, 54, 7175-84.
12. Brusseau, M. L. Assessing the potential contributions of additional retention processes to PFAS retardation in the subsurface. Sci. Total. Environ. 2018, 613-4, 176-85.
13. Stockholm Convention. The new POPs under the Stockholm Convention. Stockholm Convention Secretariat, United Nations Environment, Geneva, Switzerland. 2017. https://www.pops.int/TheConvention/ThePOPs/TheNewPOPs/tabid/2511/Default.aspx. (accessed 14 Aug 2025).
14. Schulz, K.; Silva, M. R.; Klaper, R. Distribution and effects of branched versus linear isomers of PFOA, PFOS, and PFHxS: a review of recent literature. Sci. Total. Environ. 2020, 733, 139186.
15. USEPA. New chemical program review of alternatives for PFOA and related chemicals. https://www.epa.gov/assessing-and-managing-chemicals-under-tsca/new-chemicals-program-review-alternatives-pfoa-and. (Accessed 14 Aug 2025).
16. Brennan, N. M.; Evans, A. T.; Fritz, M. K.; Peak, S. A.; von Holst, H. E. Trends in the regulation of per- and polyfluoroalkyl substances (PFAS): a scoping review. Int. J. Environ. Res. Public. Health. 2021, 18, 10900.
17. Guruge, K.; Taniyasu, S.; Yamashita, N.; Pathmalal, M. Fluoroalkyl surfactants in fish and water from Sri Lanka: an estimation of PFOS and PFOA intake via fish. In: Persistent organic pollutants (POP) research in Asia. 2008. pp. 167-72. https://www.researchgate.net/publication/283892588_FLUOROALKYL_SURFACTANTS_IN_FISH_AND_WATER_FROM_SRI_LANKA_AN_ESTIMATION_OF_PFOS_AND_PFOA_INTAKE_VIA_FISH. (accessed 14 Aug 2025).
18. Vassiliadou, I.; Costopoulou, D.; Kalogeropoulos, N.; et al. Levels of perfluorinated compounds in raw and cooked Mediterranean finfish and shellfish. Chemosphere 2015, 127, 117-26.
19. Hossain, S.; Strakova, J.; Sultana, S.; et al. Persistent threat: PFAS in textiles and water in Bangladesh. 2024. https://ipen.org/documents/persistent-threat-pfas-textiles-and-water-bangladesh. (accessed 14 Aug 2025).
20. Habibullah-Al-Mamun, M.; Ahmed, M. K.; Raknuzzaman, M.; et al. Occurrence and distribution of perfluoroalkyl acids (PFAAs) in surface water and sediment of a tropical coastal area (Bay of Bengal coast, Bangladesh). Sci. Total. Environ. 2016, 571, 1089-104.
21. Cao, X.; Wang, C.; Lu, Y.; et al. Occurrence, sources and health risk of polyfluoroalkyl substances (PFASs) in soil, water and sediment from a drinking water source area. Ecotoxicol. Environ. Saf. 2019, 174, 208-17.
22. Hu, X. C.; Andrews, D. Q.; Lindstrom, A. B.; et al. Detection of poly- and perfluoroalkyl substances (PFASs) in U.S. drinking water linked to industrial sites, military fire training areas, and wastewater treatment plants. Environ. Sci. Technol. Lett. 2016, 3, 344-50.
23. Martin, J. W.; Smithwick, M. M.; Braune, B. M.; Hoekstra, P. F.; Muir, D. C.; Mabury, S. A. Identification of long-chain perfluorinated acids in biota from the Canadian Arctic. Environ. Sci. Technol. 2004, 38, 373-80.
24. Shi, Y.; Pan, Y.; Yang, R.; Wang, Y.; Cai, Y. Occurrence of perfluorinated compounds in fish from Qinghai-Tibetan Plateau. Environ. Int. 2010, 36, 46-50.
25. Becker, A. M.; Suchan, M.; Gerstmann, S.; Frank, H. Perfluorooctanoic acid and perfluorooctane sulfonate released from a waste water treatment plant in Bavaria, Germany. Environ. Sci. Pollut. Res. Int. 2010, 17, 1502-7.
26. Chen, S.; Zhou, Y.; Meng, J.; Wang, T. Seasonal and annual variations in removal efficiency of perfluoroalkyl substances by different wastewater treatment processes. Environ. Pollut. 2018, 242, 2059-67.
27. Franke, V.; Mccleaf, P.; Lindegren, K.; Ahrens, L. Efficient removal of per- and polyfluoroalkyl substances (PFASs) in drinking water treatment: nanofiltration combined with active carbon or anion exchange. Environ. Sci. Water. Res. Technol. 2019, 5, 1836-43.
28. United Nations. Dhaka Population 2025. World Population Prospects. 2024. https://worldpopulationreview.com/cities/bangladesh/dhaka. (accessed 14 Aug 2025).
29. Islam, M.; Uddin, M.; Tareq, S.; et al. Alteration of water pollution level with the seasonal changes in mean daily discharge in three main rivers around Dhaka City, Bangladesh. Environments 2015, 2, 280-94.
30. Department of Environment, Ministry of Environment and Forest, Government of the people’s republic of Bangladesh. Surface and Ground Water Quality Report 2016. https://doe.portal.gov.bd/sites/default/files/files/doe.portal.gov.bd/publications/d5bb5df3_3e3e_40f9_bdd3_9a72d29c16b5/Surface%20and%20Ground%20Water%20Quality%20Report%202016-.pdf. (accessed 14 Aug 2025).
31. Uddin, M. J.; Jeong, Y. K. Urban river pollution in Bangladesh during last 40 years: potential public health and ecological risk, present policy, and future prospects toward smart water management. Heliyon 2021, 7, e06107.
32. United Nations. SDG Goal 6. Ensure availability and sustainable management of water and sanitation for all. https://sdgs.un.org/goals/goal6. (accessed 14 Aug 2025).
33. United Nations. SDG Goal 11. Make cities and human settlements inclusive, safe, resilient and sustainable. https://sdgs.un.org/goals/goal11. (accessed 14 Aug 2025).
34. Ahmad, M. K.; Islam, S.; Rahman, M. S.; Haque, M. R.; Islam, M. M. Heavy metals in water, sediment and some fishes of Buriganga River, Bangladesh. Int. J. Environ. Res. 2010, 4, 321-32.
35. Gałęzowska, G.; Rogowska, J.; Olkowska, E.; Ratajczyk, W.; Wolska, L. Environmental risk assessment resulting from sediment contamination with perfluoroalkyl substances. Molecules 2020, 26, 116.
36. Bao, L.; Xu, C.; Zhang, C.; et al. Occurrence and risk assessment of per- and polyfluoroalkyl substances (PFASs) in water, sediment, soil, and moss: an environmental media study in Caohai, China. Emerg. Contam. 2025, 11, 100489.
37. Wang, Q.; Tsui, M. M. P.; Ruan, Y.; et al. Occurrence and distribution of per- and polyfluoroalkyl substances (PFASs) in the seawater and sediment of the South China sea coastal region. Chemosphere 2019, 231, 468-77.
38. Bao, J.; Liu, W.; Liu, L.; Jin, Y.; Ran, X.; Zhang, Z. Perfluorinated compounds in urban river sediments from Guangzhou and Shanghai of China. Chemosphere 2010, 80, 123-30.
39. Brooke, D.; Footitt, A.; Nwaogu, T. A. Environmental risk evaluation report: perfluorooctane-sulphonate (PFOS). Environment Agency; 2004. https://www.pops.int/Portals/0/docs/from_old_website/documents/meetings/poprc/meeting_docs/en/POPRC1-INF9-e.pdf. (accessed 14 Aug 2025).
40. Hansen, K. J.; Johnson, H. O.; Eldridge, J. S.; Butenhoff, J. L.; Dick, L. A. Quantitative characterization of trace levels of PFOS and PFOA in the Tennessee River. Environ. Sci. Technol. 2002, 36, 1681-5.
41. So, M. K.; Miyake, Y.; Yeung, W. Y.; et al. Perfluorinated compounds in the Pearl River and Yangtze River of China. Chemosphere 2007, 68, 2085-95.
42. Ahrens, L.; Yamashita, N.; Yeung, L. W.; et al. Partitioning behavior of per- and polyfluoroalkyl compounds between pore water and sediment in two sediment cores from Tokyo Bay, Japan. Environ. Sci. Technol. 2009, 43, 6969-75.
43. Campo, J.; Lorenzo, M.; Pérez, F.; Picó, Y.; Farré, Ml.; Barceló, D. Analysis of the presence of perfluoroalkyl substances in water, sediment and biota of the Jucar River (E Spain). Sources, partitioning and relationships with water physical characteristics. Environ. Res. 2016, 147, 503-12.
44. An, X.; Lei, H.; Lu, Y.; et al. Per- and polyfluoroalkyl substances (PFASs) in water and sediment from a temperate watershed in China: occurrence, sources, and ecological risks. Sci. Total. Environ. 2023, 890, 164207.
45. Hong, S.; Khim, J. S.; Wang, T.; et al. Bioaccumulation characteristics of perfluoroalkyl acids (PFAAs) in coastal organisms from the west coast of South Korea. Chemosphere 2015, 129, 157-63.
46. Zhao, Z.; Xie, Z.; Tang, J.; et al. Seasonal variations and spatial distributions of perfluoroalkyl substances in the rivers Elbe and lower Weser and the North Sea. Chemosphere 2015, 129, 118-25.
47. Novak, P. A.; Hoeksema, S. D.; Thompson, S. N.; Trayler, K. M. Per- and polyfluoroalkyl substances (PFAS) contamination in a microtidal urban estuary: sources and sinks. Mar. Pollut. Bull. 2023, 193, 115215.
48. Lewis, A. J.; Yun, X.; Spooner, D. E.; Kurz, M. J.; McKenzie, E. R.; Sales, C. M. Exposure pathways and bioaccumulation of per- and polyfluoroalkyl substances in freshwater aquatic ecosystems: key considerations. Sci. Total. Environ. 2022, 822, 153561.
49. Chu, K.; Lu, Y.; Hua, Z.; et al. Perfluoroalkyl acids (PFAAs) in the aquatic food web of a temperate urban lake in East China: bioaccumulation, biomagnification, and probabilistic human health risk. Environ. Pollut. 2022, 296, 118748.
50. Li, F.; Duan, J.; Tian, S.; et al. Short-chain per- and polyfluoroalkyl substances in aquatic systems: occurrence, impacts and treatment. Chem. Eng. J. 2020, 380, 122506.
51. Wang, P.; Lu, Y.; Wang, T.; et al. Occurrence and transport of 17 perfluoroalkyl acids in 12 coastal rivers in south Bohai coastal region of China with concentrated fluoropolymer facilities. Environ. Pollut. 2014, 190, 115-22.
52. Si, Y.; Huang, J.; Liang, Z.; et al. Occurrence and ecological risk assessment of perfluoroalkyl substances (PFASs) in water and sediment from an urban river in South China. Arch. Environ. Contam. Toxicol. 2021, 81, 133-41.
53. Munoz, G.; Fechner, L. C.; Geneste, E.; Pardon, P.; Budzinski, H.; Labadie, P. Spatio-temporal dynamics of per and polyfluoroalkyl substances (PFASs) and transfer to periphytic biofilm in an urban river: case-study on the River Seine. Environ. Sci. Pollut. Res. Int. 2018, 25, 23574-82.
54. Zarębska, M.; Bajkacz, S.; Hordyjewicz-Baran, Z. Assessment of legacy and emerging PFAS in the Oder River: occurrence, distribution, and sources. Environ. Res. 2024, 251, 118608.
55. De Silva, A. O.; Spencer, C.; Scott, B. F.; Backus, S.; Muir, D. C. Detection of a cyclic perfluorinated acid, perfluoroethylcyclohexane sulfonate, in the Great Lakes of North America. Environ. Sci. Technol. 2011, 45, 8060-6.
56. Zhao, Z.; Tang, J.; Mi, L.; et al. Perfluoroalkyl and polyfluoroalkyl substances in the lower atmosphere and surface waters of the Chinese Bohai Sea, Yellow Sea, and Yangtze River estuary. Sci. Total. Environ. 2017, 599-600, 114-23.
57. Niisoe, T.; Senevirathna, S. T.; Harada, K. H.; et al. Perfluorinated carboxylic acids discharged from the Yodo River Basin, Japan. Chemosphere 2015, 138, 81-8.
58. Bai, X.; Son, Y. Perfluoroalkyl substances (PFAS) in surface water and sediments from two urban watersheds in Nevada, USA. Sci. Total. Environ. 2021, 751, 141622.
59. Guo, C.; Zhang, Y.; Zhao, X.; et al. Distribution, source characterization and inventory of perfluoroalkyl substances in Taihu Lake, China. Chemosphere 2015, 127, 201-7.
60. Sharma, B. M.; Bharat, G. K.; Tayal, S.; et al. Perfluoroalkyl substances (PFAS) in river and ground/drinking water of the Ganges River basin: emissions and implications for human exposure. Environ. Pollut. 2016, 208, 704-13.
61. Cai, L.; Hu, J.; Li, J.; Cao, X.; Lyu, Y.; Sun, W. Occurrence, source apportionment, and pollution assessment of per- and polyfluoroalkyl substances in a river across rural and urban areas. Sci. Total. Environ. 2022, 835, 155505.
62. Zhao, Z.; Tang, J.; Xie, Z.; et al. Perfluoroalkyl acids (PFAAs) in riverine and coastal sediments of Laizhou Bay, North China. Sci. Total. Environ. 2013, 447, 415-23.
63. Labadie, P.; Chevreuil, M. Partitioning behaviour of perfluorinated alkyl contaminants between water, sediment and fish in the Orge River (nearby Paris, France). Environ. Pollut. 2011, 159, 391-7.
64. Lasier, P. J.; Washington, J. W.; Hassan, S. M.; Jenkins, T. M. Perfluorinated chemicals in surface waters and sediments from northwest Georgia, USA, and their bioaccumulation in Lumbriculus variegatus. Environ. Toxicol. Chem. 2011, 30, 2194-201.
65. Senthil Kumar, K.; Zushi, Y.; Masunaga, S.; Gilligan, M.; Pride, C.; Sajwan, K. S. Perfluorinated organic contaminants in sediment and aquatic wildlife, including sharks, from Georgia, USA. Mar. Pollut. Bull. 2009, 58, 621-9.
66. Pico, Y.; Blasco, C.; Farré, M.; Barceló, D. Occurrence of perfluorinated compounds in water and sediment of L’Albufera Natural Park (València, Spain). Environ. Sci. Pollut. Res. Int. 2012, 19, 946-57.
67. Senthilkumar, K.; Ohi, E.; Sajwan, K.; Takasuga, T.; Kannan, K. Perfluorinated compounds in river water, river sediment, market fish, and wildlife samples from Japan. Bull. Environ. Contam. Toxicol. 2007, 79, 427-31.
68. Paul, R.; Haq, A. Challenges of water quality management: case of peripheral Rivers in Dhaka Mega City. Presentation from the world water week in Stockholm. 2010. https://www.slideshare.net/slideshow/challenges-of-water-quality-management-case-of-peripheral-rivers-in-dhaka-mega-city-presented-by-reba-paul-executive-secretary-bwp-and-azharul-haq-former-managing-director-dhaka-wasa-at-world-water-week-2010/5352131. (accessed 14 Aug 2025).
69. Akbor, M. A.; Rahman, M. M.; Bodrud-Doza, M.; et al. Metal pollution in water and sediment of the Buriganga River, Bangladesh: an ecological risk perspective. Desalination. Water. Treat. 2020, 193, 284-301.
70. Gaines, L. G. T. Historical and current usage of per- and polyfluoroalkyl substances (PFAS): a literature review. Am. J. Ind. Med. 2023, 66, 353-78.
71. Jian, J. M.; Zhang, C.; Wang, F.; Lu, X.; Wang, F.; Zeng, E. Y. Effect of solution chemistry and aggregation on adsorption of perfluorooctanesulphonate (PFOS) to nano-sized alumina. Environ. Pollut. 2019, 251, 425-33.
72. Baqar, M.; Saleem, R.; Zhao, M.; et al. Combustion of high-calorific industrial waste in conventional brick kilns: an emerging source of PFAS emissions to agricultural soils. Sci. Total. Environ. 2024, 906, 167612.
73. Saha, P. K.; Hossain, M. D. Geochemical and ecotoxicological approach for evaluation of heavy metal pollution in the Buriganga River Sediment. In: Proceedings of Bangladesh geotechnical conference. 2010. https://www.scirp.org/reference/referencespapers?referenceid=733268. (accessed 14 Aug 2025).
74. Ahrens, L.; Bundschuh, M. Fate and effects of poly- and perfluoroalkyl substances in the aquatic environment: a review. Environ. Toxicol. Chem. 2014, 33, 1921-9.
75. Guerra, P.; Kim, M.; Kinsman, L.; Ng, T.; Alaee, M.; Smyth, S. A. Parameters affecting the formation of perfluoroalkyl acids during wastewater treatment. J. Hazard. Mater. 2014, 272, 148-54.
76. Giesy, J. P.; Kannan, K. Perfluorochemical surfactants in the environment. Environ. Sci. Technol. 2002, 36, 146A-52A.
77. Houde, M.; Martin, J. W.; Letcher, R. J.; Solomon, K. R.; Muir, D. C. Biological monitoring of polyfluoroalkyl substances: a review. Environ. Sci. Technol. 2006, 40, 3463-73.
78. Du, G.; Huang, H.; Hu, J.; et al. Endocrine-related effects of perfluorooctanoic acid (PFOA) in zebrafish, H295R steroidogenesis and receptor reporter gene assays. Chemosphere 2013, 91, 1099-106.
79. Huang, Y.; Wang, X. L.; Zhang, J. W.; Wu, K. S. Impact of endocrine-disrupting chemicals on reproductive function in zebrafish (Danio rerio). Reprod. Domest. Anim. 2015, 50, 1-6.
80. Ma, T.; Ye, C.; Wang, T.; Li, X.; Luo, Y. Toxicity of per- and polyfluoroalkyl substances to aquatic invertebrates, planktons, and microorganisms. Int. J. Environ. Res. Public. Health. 2022, 19, 16729.
81. Guo, R.; Liu, X.; Liu, J.; et al. Occurrence, partition and environmental risk assessment of per- and polyfluoroalkyl substances in water and sediment from the Baiyangdian Lake, China. Sci. Rep. 2020, 10, 4691.
82. Post, G. B.; Cohn, P. D.; Cooper, K. R. Perfluorooctanoic acid (PFOA), an emerging drinking water contaminant: a critical review of recent literature. Environ. Res. 2012, 116, 93-117.
83. Brack, W.; Dulio, V.; Ågerstrand, M.; et al. Towards the review of the European Union Water Framework Directive: recommendations for more efficient assessment and management of chemical contamination in European surface water resources. Sci. Total. Environ. 2017, 576, 720-37.
84. Lin, N.; Zhang, Y.; Su, S.; Feng, Y.; Wang, B.; Li, Z. Exposure characteristics of legacy and novel per- and polyfluoroalkyl substances in blood and association with hypertension among low-exposure population. J. Hazard. Mater. 2023, 459, 132185.
85. Zeng, Z.; Song, B.; Xiao, R.; et al. Assessing the human health risks of perfluorooctane sulfonate by in vivo and in vitro studies. Environ. Int. 2019, 126, 598-610.
Cite This Article
How to Cite
Download Citation
Export Citation File:
Type of Import
Tips on Downloading Citation
Citation Manager File Format
Type of Import
Direct Import: When the Direct Import option is selected (the default state), a dialogue box will give you the option to Save or Open the downloaded citation data. Choosing Open will either launch your citation manager or give you a choice of applications with which to use the metadata. The Save option saves the file locally for later use.
Indirect Import: When the Indirect Import option is selected, the metadata is displayed and may be copied and pasted as needed.
About This Article
Copyright

Data & Comments
Data
0


Comments
Comments must be written in English. Spam, offensive content, impersonation, and private information will not be permitted. If any comment is reported and identified as inappropriate content by OAE staff, the comment will be removed without notice. If you have any queries or need any help, please contact us at [email protected].