

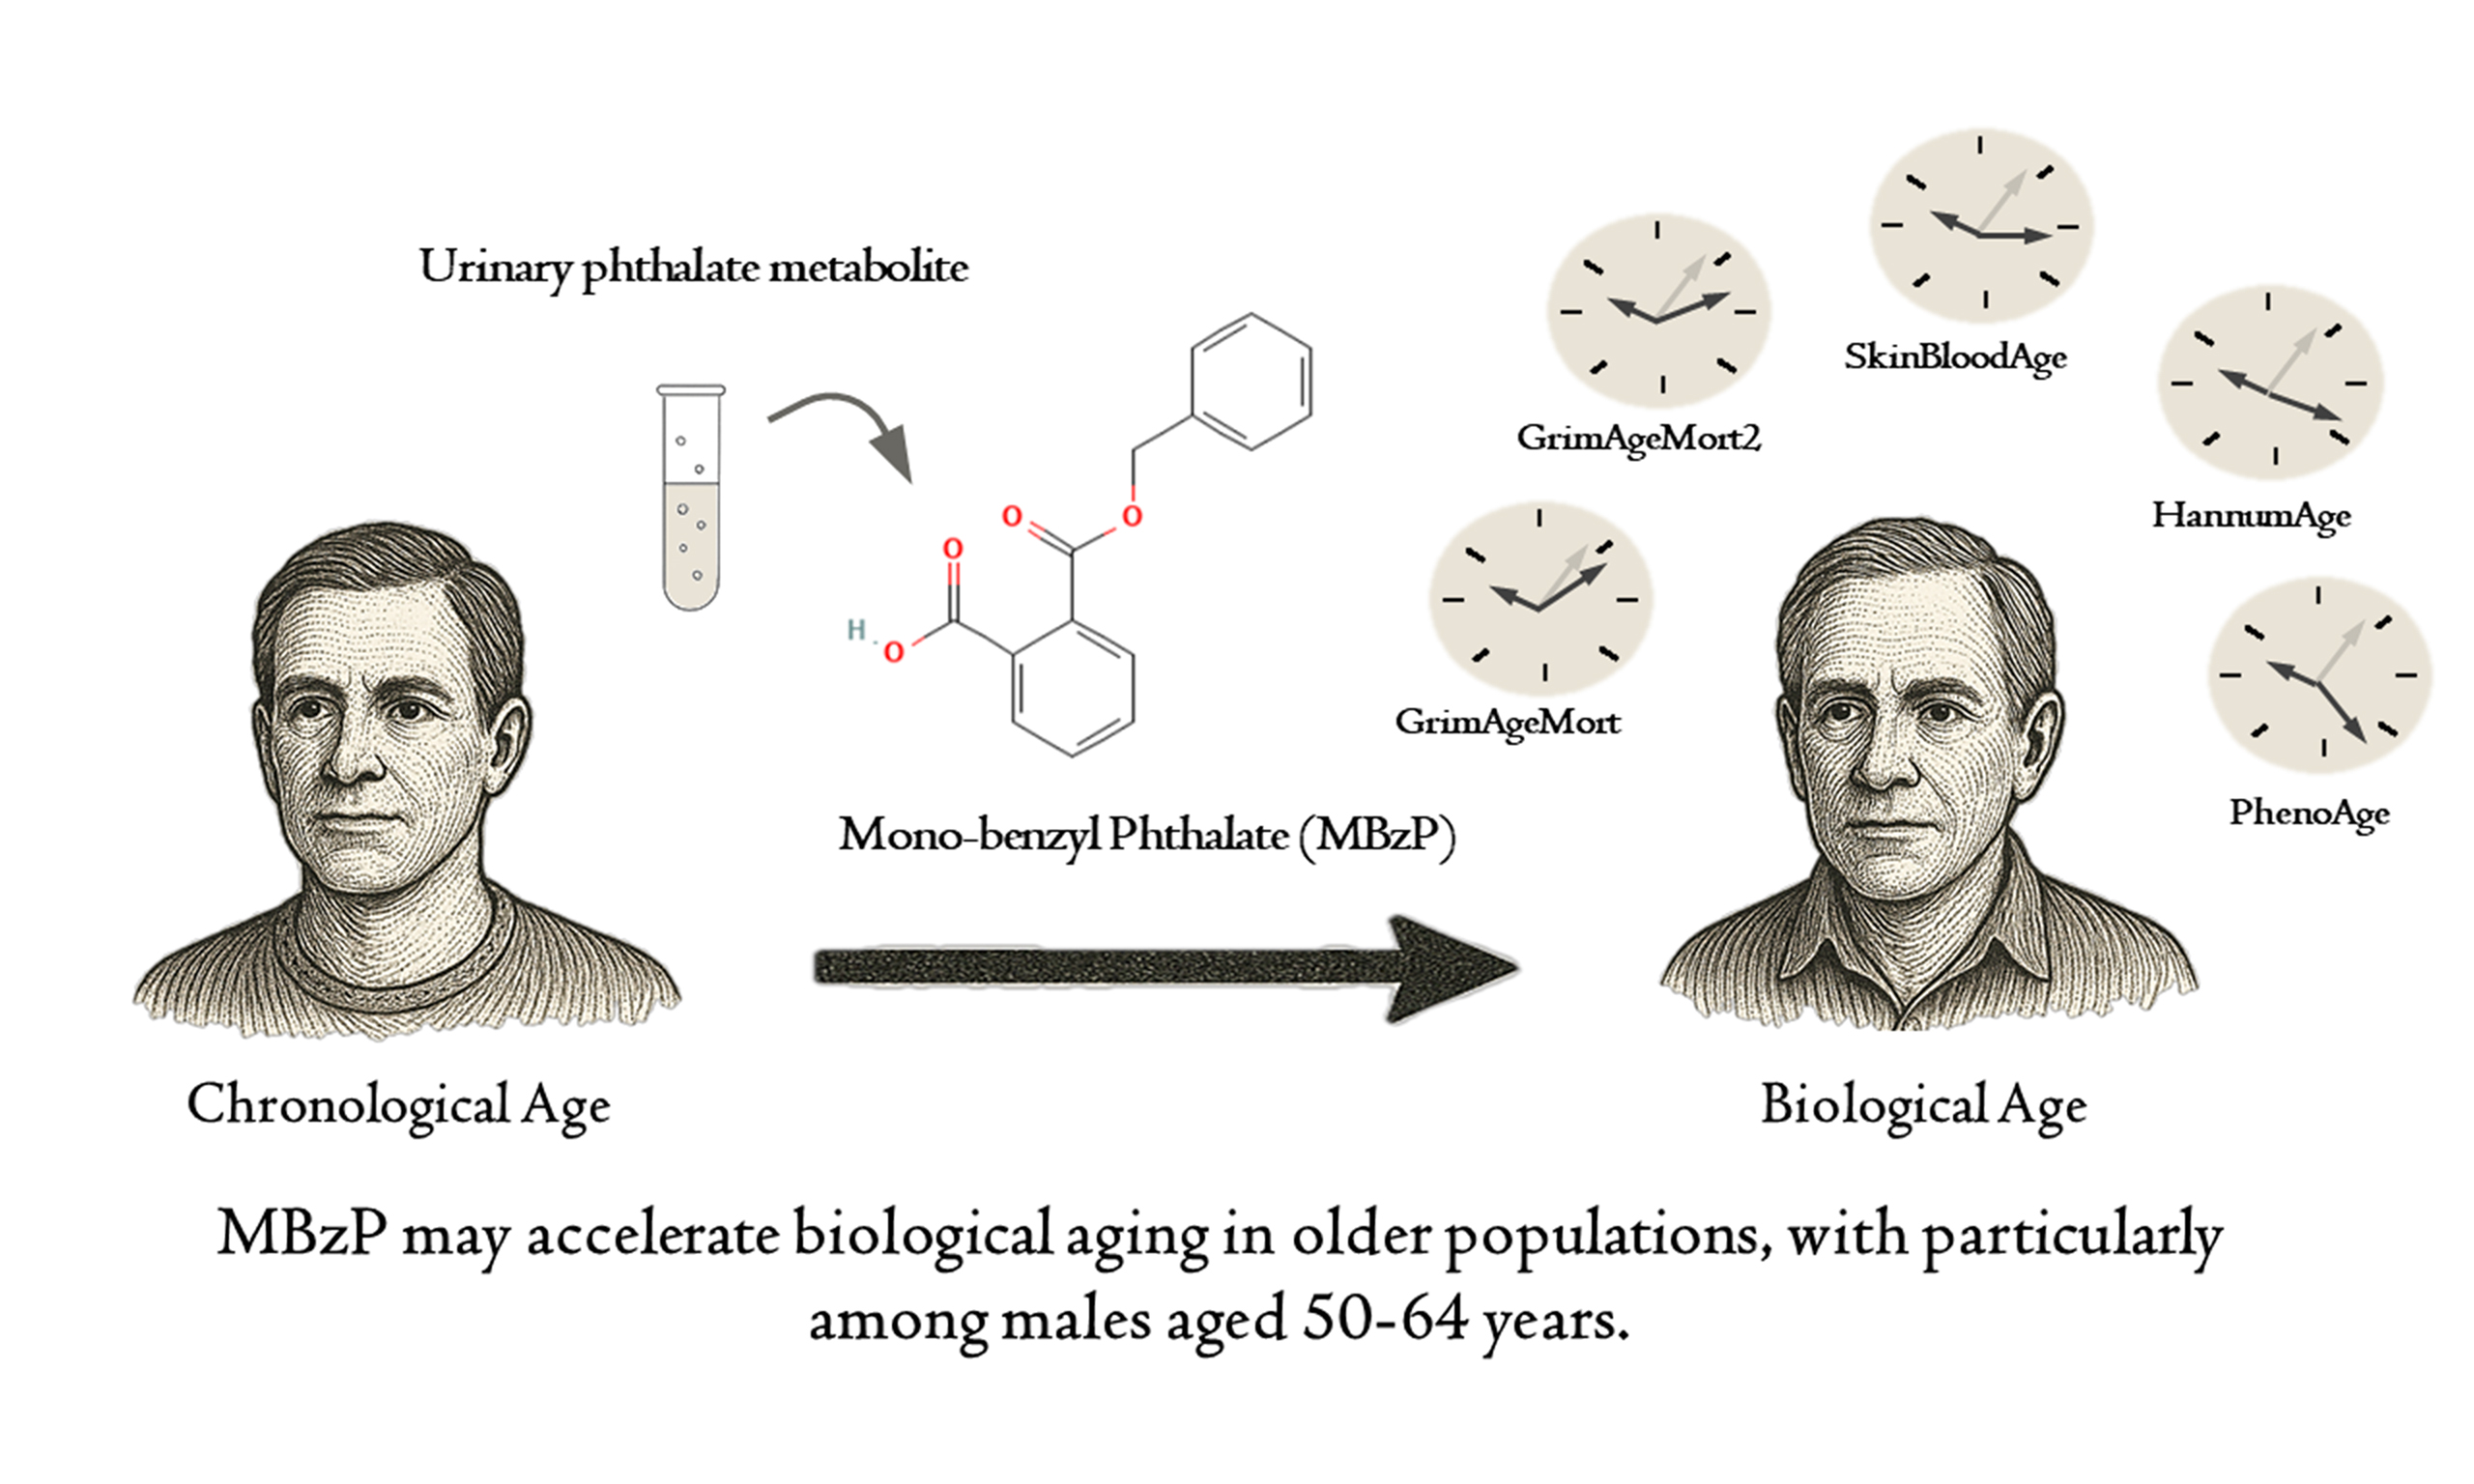
Associations of urinary phthalate metabolites with DNA methylation algorithms of aging among U.S. adults: 1999-2002 NHANES data
 0
0 Abstract
Urinary phthalate (PAE) metabolites are prevalent environmental pollutants linked to various health risks. Although several promising DNA methylation (DNAm) algorithms have emerged as strong predictors of biological age and adverse health outcomes in older adults, the specific relationship between exposure to these chemical contaminants and DNAm algorithms remains largely unexplored. This study aimed to evaluate this association of urinary PAE metabolites with five widely used DNAm-based aging signatures in a representative sample of U.S. adults. Data from the National Health and Nutrition Examination Survey 1999-2002 were analyzed, focusing on urine samples from 831 participants for seven PAE metabolites. Methylation data were generated using the EPIC array (Illumina, San Diego, CA, USA), and five DNAm-based aging signatures, the HannumAgeacc, SkinBloodAgeacc, PhenoAgeacc, GrimAgeMortacc, and GrimAge2Mortacc, were estimated and employed in linear models to investigate their relationships with urinary PAE metabolite concentrations. Significant associations (P-values: 0.0001-0.0393) were observed between MBzP and all five DNAm aging algorithms, with multivariable adjusted β values ranging from 0.22 (95%CI: 0.07-0.38) for GrimAgeMortacc to 0.68 (95%CI: 0.18-1.18) for PhenoAgeacc. In males, significant associations between MBzP and PhenoAgeacc, GrimAgeMortacc, and GrimAge2Mortacc were noted (P-values: 0.0027-0.0205). Among participants aged 50-64, MBzP exhibited significant associations with all five DNAm aging algorithms (P-values: 0.0012-0.0155), with multivariable adjusted β values ranging from 0.30 (95%CI: 0.10-0.51) for GrimAgeMortacc to 0.93 (95%CI: 0.34-1.52) for PhenoAgeacc. These findings suggest that MBzP may accelerate biological aging in older populations, particularly in males aged 50-64.
Keywords
INTRODUCTION
The accelerating trend of population aging imposes substantial demands on healthcare systems and societies worldwide, highlighting the need for advanced measures of aging[1-3]. Biological age, often quantified through biological aging clocks, has emerged as a valuable metric for assessing aging processes that extend beyond chronological age alone. By capturing complex biological mechanisms, biological age reflects the internal, external, and functional dimensions of aging that influence health and longevity[4-6].
Recently, several promising DNA methylation (DNAm) algorithms, such as DNAm phenotypic age
In addition to genetic and physiological factors, environmental exposures, particularly to prevalent pollutants, may significantly impact DNAm algorithms[20-22]. Phthalates (PAEs), a series of synthetic compounds widely used as plasticizers in various consumer products, are pervasive environmental contaminants with an annual U.S. production volume exceeding 470 million pounds[23]. Known endocrine disruptors such as PAEs and their metabolites have been linked to adverse health effects, including carcinogenicity, reproductive toxicity, and developmental abnormalities[24-26]. Epidemiological evidence also links PAE exposure to health issues such as neurobehavioral disorders and diminished physical function[27,28], suggesting PAEs may influence biological aging through epigenetic alterations. Growing evidence from human populations supports this epigenetic link. Studies have demonstrated that prenatal PAE exposure alters placental miRNA expression, potentially disrupting developmental pathways[29]. In adults, PAE metabolites (e.g., MEHHP, MiBP) interact with site-specific DNAm (e.g., DRD4 CpG sites), exacerbating neurobehavioral deficits in sensitive populations[30]. Critically, recent multi-cohort studies of reproductive-aged men revealed that preconception PAE exposure is associated with accelerated sperm epigenetic aging (SEA) and widespread differential methylation in genes regulating spermatogenesis and embryonic development[31,32]. Despite growing evidence, the relationship between PAE exposure and DNAm-based aging algorithms remains underexplored.
To address this research gap, we leveraged data from the National Health and Nutrition Examination Survey (NHANES) 1999-2002 to explore the associations between PAE metabolites (all with > 75% detection frequency) and five widely used DNAm-based algorithms in a representative sample of U.S. adults aged ≥ 50 years (n = 831). Additionally, analyses stratified by sex and age provide insights into demographic-specific associations that may further clarify the impact of PAEs on biological aging.
EXPERIMENTAL
Study participants
NHANES is an annual, nationally representative survey of non-institutionalized civilians in the U.S., conducted by the Centers for Disease Control and Prevention (CDC) through the National Center for Health Statistics (NCHS)[33]. Utilizing a complex sampling design that includes oversampling of specific subgroups[34], NHANES gathers demographic and health data from participants who provide blood and urine samples at mobile examination centers and give written consent[35]. For our study, we combined data from two cycles (1999-2002) in accordance with NCHS recommendations.
Quantification of urinary PAE metabolite concentrations
Using data from the publicly available NHANES database, we analyzed urinary concentrations of several PAE metabolites: mono-ethyl phthalate (MEP), mono-n-butyl phthalate (MBP), mono-cyclohexyl phthalate (MCHP), mono-(2-ethyl) hexyl phthalate (MEHP), mono-n-octyl phthalate (MOP), mono-benzyl phthalate (MBzP), mono-isononyl phthalate (MiNP), mono-(2-ethyl-5-hydroxyhexyl) phthalate (MEHHP), mono-(2-ethyl-5-oxohexyl) phthalate (MEOHP), mono-(3-carboxypropyl) phthalate (MCPP), and mono-isobutyl phthalate (MiBP). Quantification of urinary PAE metabolite concentrations followed NHANES guidelines[36,37]. In summary, urine samples underwent enzymatic deconjugation of glucuronides, followed by solid-phase extraction. Chromatographic separation of PAE metabolites was achieved using reversed-phase high-performance liquid chromatography (HPLC), with detection performed using atmospheric pressure chemical ionization tandem mass spectrometry (APCI-MS/MS). Metabolites were quantified through isotope dilution, and assay precision was enhanced by incorporating 13C4-labeled internal standards for each analyte, along with a conjugated internal standard to assess deconjugation efficiency. Urinary concentrations of the PAEs below the level of detection (LOD) were assigned the limit of detection divided by the square root of two as recommended by NHANES[38]. This standardized approach, consistently adopted in peer-reviewed analyses of NHANES 1999-2002 biomarker data[39], ensures methodological alignment with established protocols for handling left-censored observations in this cohort. We included only PAE metabolites with detection frequencies ≥ 75%. This detection frequency (75%) was selected following the established methodology for urinary PAE analyses in the NHANES 1999-2002 dataset, as implemented in the study of PAEs and leukocyte telomere length[39].
DNAm aging algorithm measurements
Following NHANES DNA Methylation Array and Epigenetic Biomarkers Data Documentation[40], we assessed DNAm using blood samples from adults aged ≥ 50 years. These samples were collected during the 1999-2000 and 2001-2002 survey cycles. Methylation profiling employed the Illumina EPIC array (San Diego, CA, USA), with preprocessing and normalization conducted per manufacturer protocols in Dr. Yongmei Liu’s laboratory at Duke University.
We computed five established epigenetic aging biomarkers: HannumAge[41], SkinBloodAge[42], PhenoAge[43], GrimAge[44], and GrimAge2[45]. For each algorithm, we calculated age-adjusted residuals (epigenetic age acceleration metrics) to quantify deviations from chronological age. Designated as HorvathAgeacc, SkinBloodAgeacc, PhenoAgeacc, GrimAgeMortacc, and GrimAge2Mortacc, these metrics indicate accelerated or decelerated aging, providing insight into biological aging relative to chronological age.
Covariates
To control for potential confounders, we included the following covariates: demographic characteristics (age in years, continuous; sex), lifestyle factors (smoking pack-years and alcohol consumption), leukocyte composition, urine creatinine, and C-reactive protein levels, along with survey years. As previously described[46,47], age, sex, and alcohol consumption data were collected through self-report questionnaires. We categorized alcohol consumption as Never, Ever, Current, and Don’t Know based on the question: “In any one year, have you had at least 12 drinks of any type of alcoholic beverage?” Smoking pack-years were estimated using a DNAm-based method[44], while leukocyte composition was determined via the Houseman algorithm[48]. Urinary creatinine (ng/mL) was measured via a Jaffe rate reaction on a CX3 analyzer and entered into models as a natural log-transformed variable.
Statistical analysis
We summarized baseline demographic characteristics using standard descriptive methods, with analyses weighted for urinary PAE subsamples per NCHS recommendations. Using Spearman correlation coefficients, we assessed correlations among age, urinary PAE metabolites, and the five DNAm aging algorithms, presenting results in a correlation matrix plot.
We examined associations between urinary PAE metabolites and DNAm aging algorithms using linear regressions. Model 1 was adjusted for age, sex, leukocyte composition, and survey years, while Model 2 included additional adjustments for smoking pack-years, alcohol consumption, natural log-transformed urine creatinine, and natural log-transformed C-reactive protein. We also stratified analyses by sex and age to explore demographic-specific associations specific to demographic groups, which could further elucidate how PAEs impact biological aging. To rigorously evaluate the assumption of linear dose-response relationships between PAEs and DNAm aging algorithms, we employed generalized additive models (GAMs) using the “mgcv” package (v1.8-42) in R.
All analyses were performed using SAS, version 9.4 (SAS Institute, Inc., Cary, NC) and R, version 4.3.1. Statistical significance was defined as a two-sided P-value < 0.05.
RESULTS AND DISCUSSION
Population characteristics
Table 1 presents the characteristics of the study population, which consists of 831 participants with an equal distribution of males and females. The average age was 66.66 years in the 1999-2000 cycle and 65.13 years in the 2001-2002 cycle, with no significant difference between the two cycles. Additionally, alcohol consumption, body mass index, smoking pack-years, and C-reactive protein levels were comparable across the two cycles.
Characteristics of the study population
| Characteristics | 1999-2000 (n = 389) | 2001-2002 (n = 442) | P-value |
| Age (years, mean ± SD) | 66.66 ± 9.64 | 65.13 ± 10.19 | 0.1313 |
| Sex (N/%) | 0.6285 | ||
| Men | 195 (50.13) | 229 (51.81) | |
| Women | 194 (49.87) | 213 (48.19) | |
| Race/ethnicity, N (%) | < 0.0001 | ||
| Non-Hispanic White | 148 (38.05) | 202 (45.70) | |
| Non-Hispanic Black | 68 (17.48) | 108 (24.43) | |
| Mexican American | 134 (34.45) | 91 (20.59) | |
| Other Races-Including Multi-Racial | 8 (2.06) | 17 (3.85) | |
| Other Hispanic | 31 (7.97) | 24 (5.43) | |
| Educational levels (N/%)a | < 0.0001 | ||
| Low (≤ 9 years) | 213 (54.76) | 159 (35.97) | |
| Intermediate (10-11 years) | 67 (17.22) | 95 (21.49) | |
| High (≥ 12 years) | 109 (28.02) | 188 (42.53) | |
| Body mass index (kg/m2, mean ± SD)b | 28.68 ± 5.53 | 28.49 ± 5.27 | 0.4701 |
| Smoking pack-years (pack-year, mean ± SD) | 19.77 ± 13.25 | 18.79 ± 13.84 | 0.4029 |
| Alcohol consumption (N/%)c | 0.9384 | ||
| Never | 73 (18.77) | 77 (17.42) | |
| Ever | 70 (17.99) | 77 (17.42) | |
| Current | 226 (58.10) | 266 (60.18) | |
| Don’t know | 20 (5.14) | 22 (4.98) | |
| Creatinine, urine (mg/dL) | 116.96 ±7 4.8 | 115.20 ± 66.16 | 0.0409 |
| C-reactive protein (mg/dL) | 0.71 ± 1.84 | 0.59 ± 1.28 | 0.4236 |
Profiles of PAE metabolites in urine
Table 2 summarizes the distribution of urinary PAE metabolites in the study population and lists the LOD values provided by NHANES[49]. MEP, MEHP, MBzP, and MBP were highly detectable across all participants, with detection frequencies of 99%, 78%, 96%, and 99%, respectively. The average concentrations of MEP, MEHP, MBzP, and MBP were 551.86, 6.31, 16.26, and 40.39 ng/mL, respectively. MEP and MBzP concentrations were significantly higher in males than in females. MEP levels also differed significantly between participants aged 50-64 years (average: 669.55 ng/mL) and those aged ≥ 65 years (average: 443.97 ng/mL). This finding aligns with a notable negative correlation between age and MEP (P-value = 0.0005, r = -0.12), suggesting that MEP exposure declines with increasing age [Figure 1]. These results indicate that MEP is the predominant PAE metabolite in humans, and males aged 50-64 years may face greater health risks from MEP exposure.
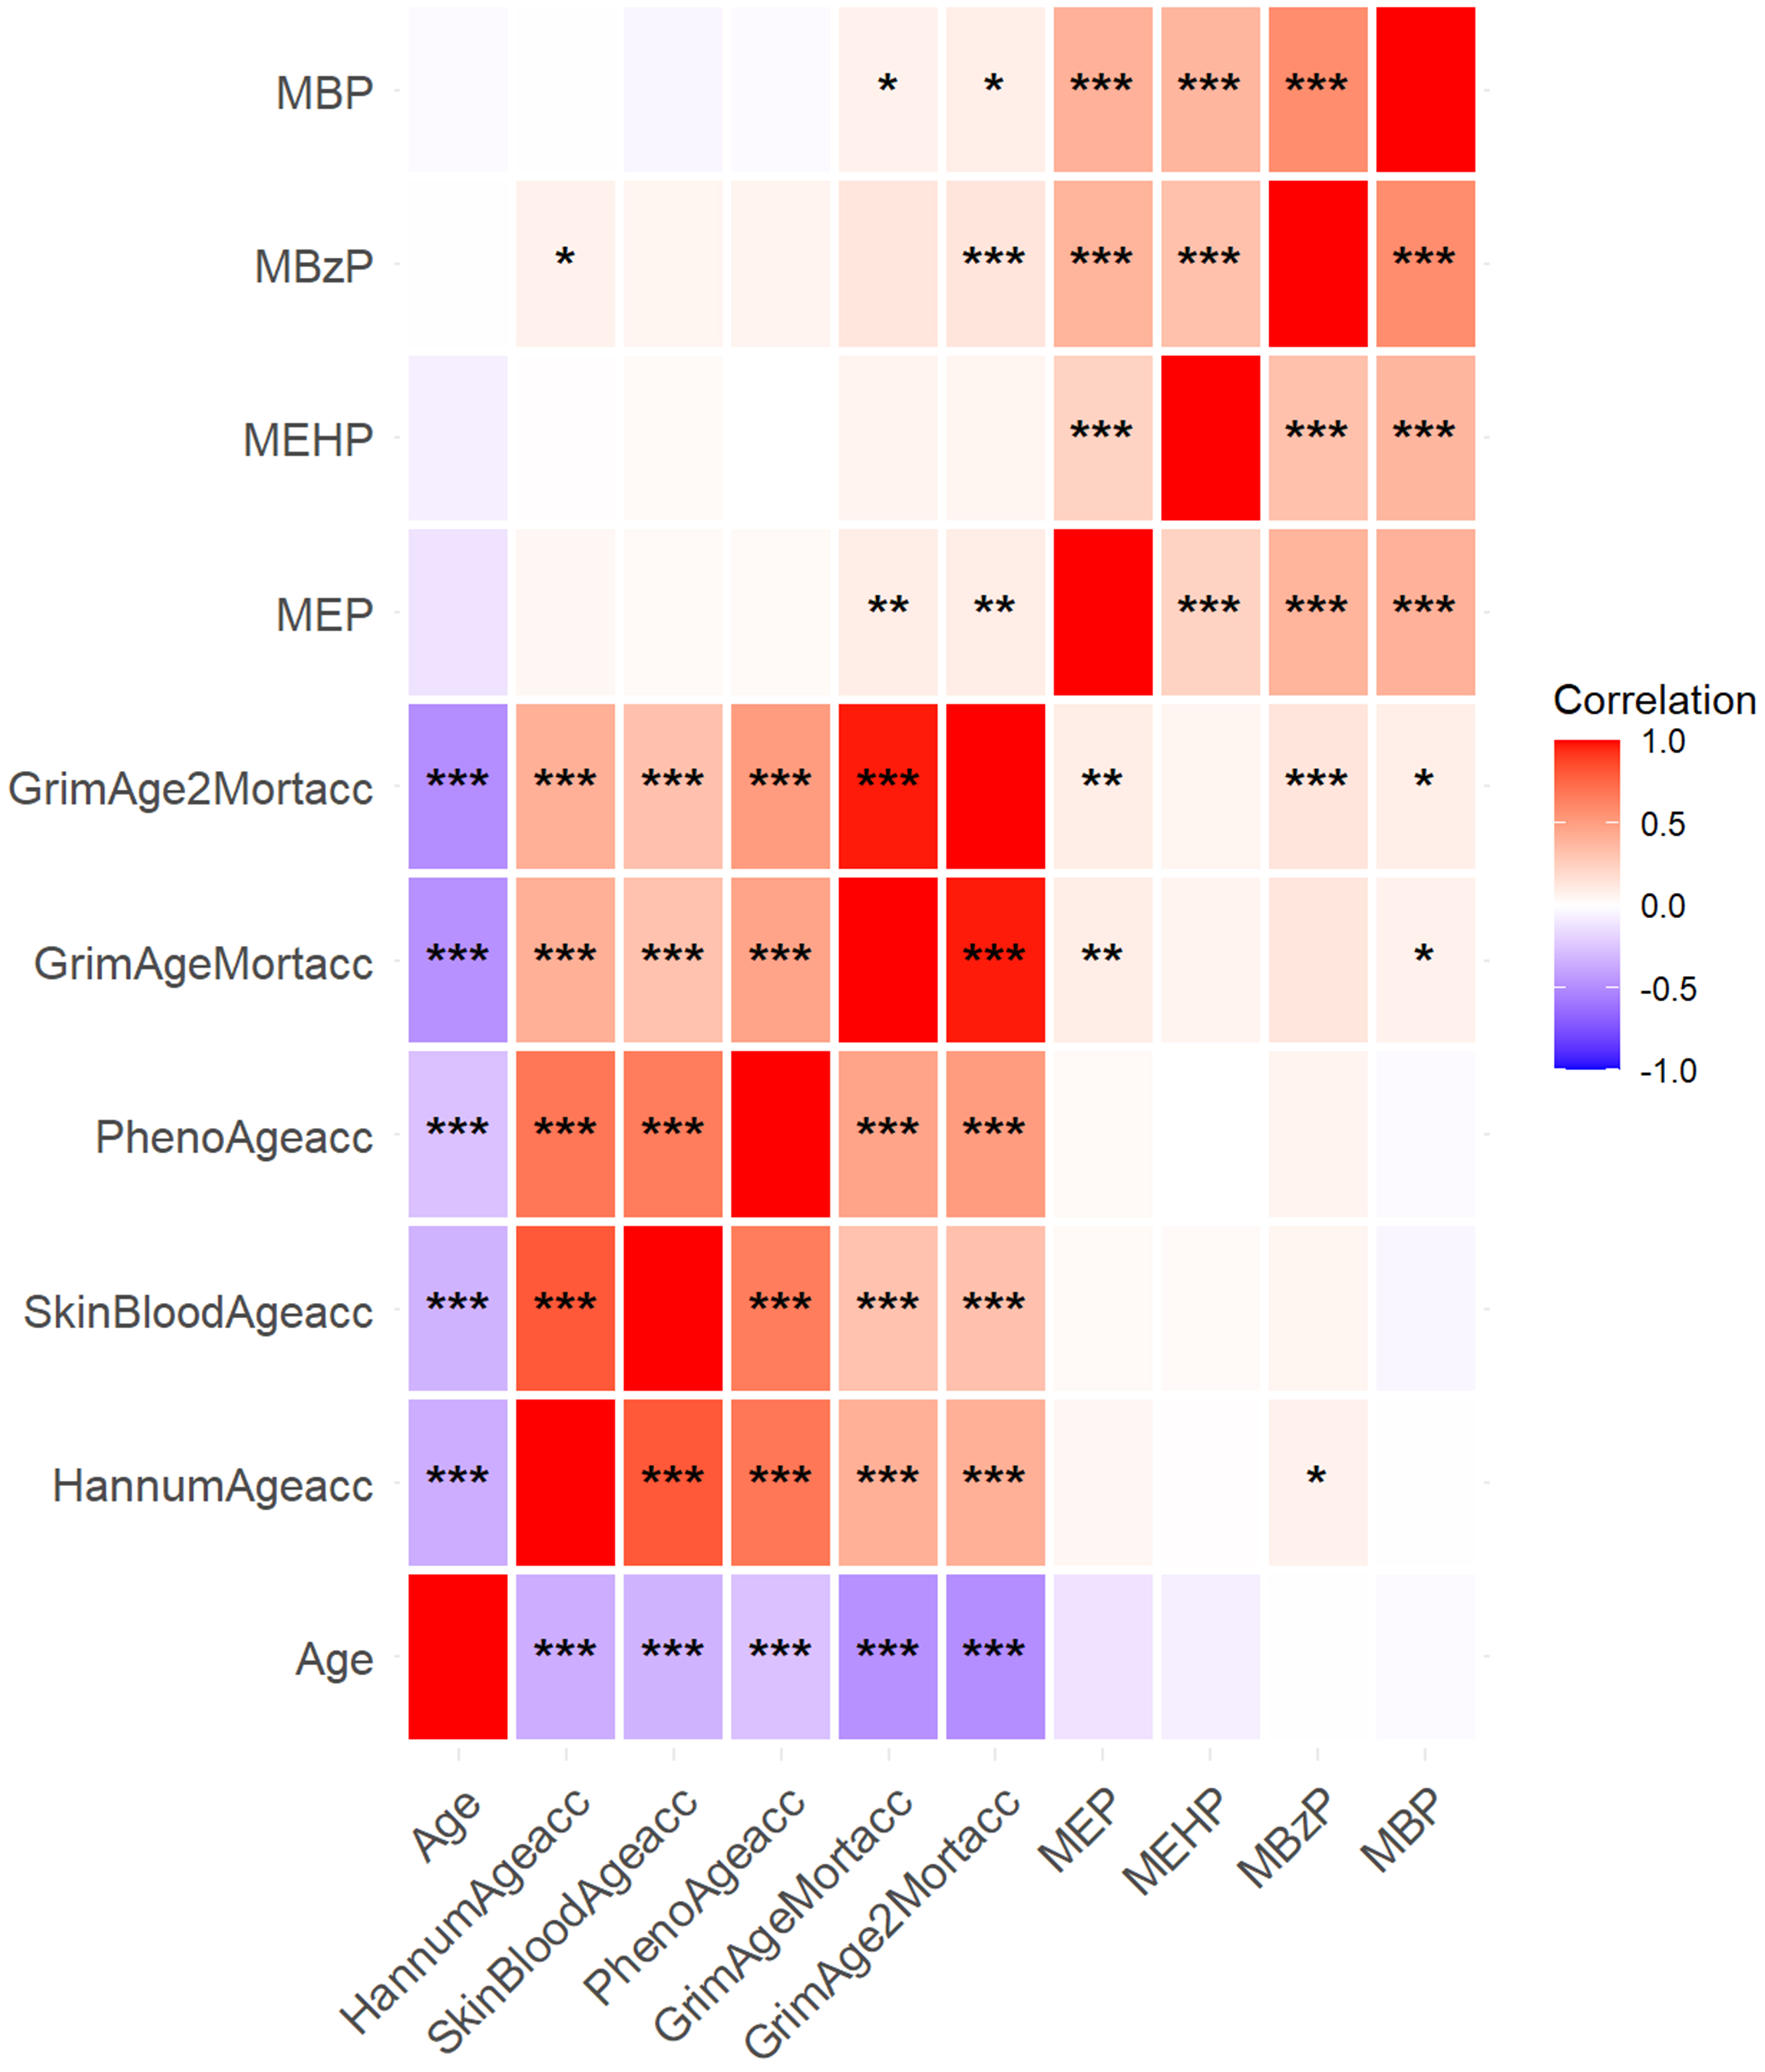
Figure 1. Spearman correlation among age, urinary phthalate metabolites, and the five DNAm aging algorithms in the entire participant population. ***P < 0.001; **P < 0.01; and *P < 0.05. DNAm: DNA methylation.
Distribution of urinary phthalate metabolites in all participants, categorized by sex and age
| Phthalate metabolite (ng/mL) | Abbr. | LOD | All (N = 831) | By sex | By age | ||||
| Males (n = 424) | Females (n = 407) | P-value | 50-64 years (n = 396) | ≥ 65 years (n = 435) | P-value | ||||
| Mono-ethyl phthalatea | MEP | 1.21 | 551.86 ± 1,421.32 | 697.66 ± 1,671.65b | 399.58 ± 1,082.09c | 0.0025 | 669.55 ± 1,658.36d | 443.97 ± 1,153.87e | 0.0224 |
| Mono-(2-ethyl)-hexyl phthalate | MEHP | 0.86 | 6.31 ± 12.42 | 6.41 ± 10.09 | 6.21 ± 14.47 | 0.8084 | 6.66 ± 12.36 | 6.00 ± 12.48 | 0.4427 |
| Mono-benzyl phthalate | MBzP | 0.47 | 16.26 ± 40.24 | 20.06 ± 52.35 | 12.29 ± 20.57 | 0.0053 | 17.67 ± 51.38 | 14.97 ± 26.26 | 0.3330 |
| Mono-cyclohexyl phthalate | MCHP | 0.93 | 1.02 ± 1.28 | 1.08 ± 1.44 | 0.96 ± 1.08 | 0.1825 | 1.02 ± 1.57 | 1.02 ± 0.94 | 0.9681 |
| Mono-isononyl phthalate | MiNP | 0.79 | 1.15 ± 2.34 | 1.19 ± 2.91 | 1.11 ± 1.54 | 0.6261 | 1.15 ± 2.12 | 1.15 ± 2.52 | 0.9953 |
| Mono-n-octyl phthalate | MOP | 0.77 | 1.46 ± 3.23 | 1.58 ± 4.40 | 1.33 ± 1.08 | 0.2509 | 1.37 ± 2.54 | 1.54 ± 3.76 | 0.4464 |
| Mono-n-butyl phthalate | MBP | 0.94 | 40.39 ± 163.42 | 44.98 ± 221.13 | 35.61 ± 60.06 | 0.4090 | 36.40 ± 66.32 | 44.03 ± 216.89 | 0.5013 |
| Mono-(2-ethyl-5-hydroxyhexyl) phthalatef | MEHHP | / | 35.55 ± 80.48 | 36.25 ± 85.50g | 34.79 ± 74.9h | 0.8489 | 35.60 ± 84.68i | 35.48 ± 75.86j | 0.9877 |
| Mono-(2-ethyl-5-oxohexyl) phthalate | MEOHP | / | 23.63 ± 57.43 | 24.46 ± 62.40 | 22.73 ± 51.68 | 0.7525 | 23.50 ± 61.19 | 23.77 ± 53.19 | 0.9599 |
| Mono-(3-carboxypropyl) phthalate | MCPP | / | 4.84 ± 15.17 | 5.61 ± 19.49 | 4.00 ± 8.32 | 0.2661 | 4.39 ± 13.85 | 5.32 ± 16.51 | 0.5225 |
| Mono-isobutyl phthalate | MiBP | 0.70 | 4.29 ± 6.57 | 4.12 ± 5.29 | 4.46 ± 7.72 | 0.5841 | 4.46 ± 6.05 | 4.10 ± 7.1 | 0.5680 |
Correlations of age, PAE metabolites, and DNAm algorithms
Assessments of acceleration values from the five DNAm algorithms showed 0.89 for HannumAgeacc, -1.50 for SkinBloodAgeacc, -10.47 for PhenoAgeacc, 0.31 for GrimAgeMortacc, and 6.15 for GrimAge2Mortacc [Table 3]. Significant differences were observed: HannumAgeacc, GrimAgeMortacc, and GrimAge2Mortacc were higher in males than in females, and individuals aged 50-64 years exhibited greater accelerations compared to those aged ≥ 65 years. MBzP showed notable correlations with GrimAgeMortacc (P-values = 0.0001, r = 0.13) and GrimAge2Mortacc (P-values < 0.0001, r = 0.14) [Figure 1].
Five DNAm aging algorithms for all participants, categorized by sex and age
| Total (N = 831) | By sex | By age | |||||
| Males (n = 424) | Females (n = 407) | P-value | Aged 50-64 years (n = 396) | Aged ≥ 65 years (n = 435) | P-value | ||
| HannumAgeacc | 0.89 ± 6.31 | 1.6 ± 5.98 | 0.15 ± 6.57 | 0.0009 | 2.73 ± 5.31 | -0.79 ± 6.68 | < 0.0001 |
| SkinBloodAgeacc | -1.50 ± 5.73 | -1.21 ± 5.49 | -1.80 ± 5.96 | 0.1407 | 0.06 ± 4.40 | -2.92 ± 6.40 | < 0.0001 |
| PhenoAgeacc | -10.47 ± 7.55 | -10.27 ± 7.17 | -10.69 ± 7.92 | 0.4198 | -8.79 ± 6.29 | -12.00 ± 8.24 | < 0.0001 |
| GrimAgeMortacc | 0.31 ± 5.61 | 2.16 ± 5.53 | -1.62 ± 5.02 | < 0.0001 | 2.51 ± 5.21 | -1.69 ± 5.20 | < 0.0001 |
| GrimAge2Mortacc | 6.15 ± 6.14 | 7.68 ± 6.17 | 4.54 ± 5.70 | < 0.0001 | 8.63 ± 5.69 | 3.88 ± 5.66 | < 0.0001 |
Associations between PAE metabolites and acceleration of DNAm algorithms
Table 4 presents the associations between MEP, MEHP, MBzP, and MBP with the five DNAm algorithms. After multivariable adjustments, MBzP exhibited significant associations with all DNAm algorithms, with
Associations of urinary phthalate metabolites with five DNAm algorithms of aging
| Phthalate metabolite | Model 1 | Model 2 | ||
| β (95%CI) | P-value | β (95%CI) | P-value | |
| MEP | ||||
| HannumAgeacc | 0.01 (-0.22-0.23) | 0.9593 | 0.01 (-0.23-0.26) | 0.9192 |
| SkinBloodAgeacc | -0.02 (-0.24-0.20) | 0.8709 | 0.01 (-0.23-0.25) | 0.9571 |
| PhenoAgeacc | 0.11 (-0.17-0.38) | 0.4593 | 0.13 (-0.17-0.42) | 0.3973 |
| GrimAgeMortacc | 0.06 (-0.13-0.25) | 0.5266 | -0.04 (-0.14-0.05) | 0.3735 |
| GrimAge2Mortacc | 0.11 (-0.09-0.32) | 0.2819 | -0.01 (-0.13-0.11) | 0.8958 |
| MEHP | ||||
| HannumAgeacc | -0.10 (-0.53-0.33) | 0.6576 | -0.08 (-0.53-0.38) | 0.7440 |
| SkinBloodAgeacc | 0.02 (-0.40-0.44) | 0.9302 | 0.09 (-0.36-0.53) | 0.7081 |
| PhenoAgeacc | -0.13 (-0.66-0.39) | 0.6227 | -0.14 (-0.69-0.41) | 0.6161 |
| GrimAgeMortacc | 0.10 (-0.25-0.46) | 0.5633 | -0.06 (-0.23-0.11) | 0.4946 |
| GrimAge2Mortacc | 0.14 (-0.25-0.53) | 0.4752 | -0.07 (-0.29-0.15) | 0.5245 |
| MBzP | ||||
| HannumAgeacc | 0.39 (0.03-0.74) | 0.0326 | 0.52 (0.11-0.94) | 0.0142 |
| SkinBloodAgeacc | 0.27 (-0.08-0.61) | 0.1296 | 0.43 (0.02-0.84) | 0.0393 |
| PhenoAgeacc | 0.53 (0.09-0.96) | 0.0173 | 0.68 (0.18-1.18) | 0.0079 |
| GrimAgeMortacc | 0.52 (0.24-0.81) | 0.0004 | 0.22 (0.07-0.38) | 0.0058 |
| GrimAge2Mortacc | 0.68 (0.37-1.00) | < 0.0001 | 0.39 (0.19-0.58) | 0.0001 |
| MBP | ||||
| HannumAgeacc | 0.06 (-0.30-0.41) | 0.7544 | 0.10 (-0.34-0.53) | 0.6714 |
| SkinBloodAgeacc | -0.14 (-0.49-0.20) | 0.4141 | -0.14 (-0.57-0.29) | 0.5210 |
| PhenoAgeacc | 0.00 (-0.43-0.44) | 0.9926 | -0.06 (-0.58-0.47) | 0.8366 |
| GrimAgeMortacc | 0.38 (0.09-0.67) | 0.0099 | 0.06 (-0.10-0.23) | 0.4635 |
| GrimAge2Mortacc | 0.53 (0.21-0.84) | 0.0013 | 0.19 (-0.02-0.40) | 0.0778 |
Sex-stratified analyses [Table 5] revealed that MBzP was significantly associated with PhenoAgeacc, GrimAgeMortacc, and GrimAge2Mortacc in males, with the strongest effect observed for PhenoAgeacc (β = 0.75, 95%CI: 0.12-1.38, P-value = 0.0205). Among females, a significant association was identified only between MBzP and GrimAge2Mortacc (β = 0.36, 95%CI: 0.05-0.66, P-value = 0.0250). These findings are corroborated by Supplementary Figure 1, which illustrates that MBzP and other metabolites correlate with GrimAgeMortacc and GrimAge2Mortacc in males [Supplementary Figure 1A], whereas no associations were observed in females [Supplementary Figure 1B].
Associations of urinary phthalate metabolites with five DNAm algorithms of aging by sex
| Phthalate metabolite | Males | Females | P interaction | ||
| β (95%CI) | P-value | β (95%CI) | P-value | ||
| MEP | |||||
| HannumAgeacc | 0.10 (-0.20-0.40) | 0.5046 | -0.17 (-0.59-0.25) | 0.4255 | 0.6132 |
| SkinBloodAgeacc | 0.06 (-0.24-0.36) | 0.6913 | -0.11 (-0.51-0.30) | 0.6073 | 0.6662 |
| PhenoAgeacc | 0.08 (-0.29-0.45) | 0.6731 | 0.28 (-0.21-0.77) | 0.2582 | 0.0012 |
| GrimAgeMortacc | 0.03 (-0.09-0.15) | 0.6782 | -0.12 (-0.27-0.04) | 0.1319 | < 0.0001 |
| GrimAge2Mortacc | 0.07 (-0.08-0.23) | 0.3634 | -0.10 (-0.29-0.09) | 0.2874 | 0.0780 |
| MEHP | |||||
| HannumAgeacc | -0.24 (-0.82-0.34) | 0.4109 | -0.09 (-0.82-0.63) | 0.8066 | 0.7387 |
| SkinBloodAgeacc | 0.00 (-0.58-0.59) | 0.9922 | 0.07 (-0.63-0.77) | 0.8512 | 0.4470 |
| PhenoAgeacc | -0.20 (-0.91-0.51) | 0.5861 | -0.17 (-1.01-0.67) | 0.6959 | 0.1848 |
| GrimAgeMortacc | -0.07 (-0.31-0.16) | 0.5283 | -0.09 (-0.35-0.17) | 0.5040 | 0.0005 |
| GrimAge2Mortacc | -0.07 (-0.37-0.23) | 0.6607 | -0.11 (-0.43-0.21) | 0.5041 | 0.1489 |
| MBzP | |||||
| HannumAgeacc | 0.46 (-0.05-0.98) | 0.0798 | 0.51 (-0.19-1.21) | 0.1572 | 0.0087 |
| SkinBloodAgeacc | 0.39 (-0.13-0.91) | 0.1417 | 0.38 (-0.29-1.06) | 0.2676 | 0.0307 |
| PhenoAgeacc | 0.75 (0.12-1.38) | 0.0205 | 0.46 (-0.36-1.28) | 0.2694 | < 0.0001 |
| GrimAgeMortacc | 0.32 (0.11-0.52) | 0.0027 | 0.11 (-0.15-0.37) | 0.3992 | 0.0423 |
| GrimAge2Mortacc | 0.41 (0.14-0.68) | 0.0027 | 0.36 (0.05-0.66) | 0.0250 | 0.1049 |
| MBP | |||||
| HannumAgeacc | 0.32 (-0.27-0.90) | 0.2892 | -0.24 (-0.92-0.44) | 0.4939 | 0.4182 |
| SkinBloodAgeacc | -0.14 (-0.73-0.45) | 0.6360 | -0.26 (-0.92-0.40) | 0.4382 | 0.8257 |
| PhenoAgeacc | 0.11 (-0.61-0.83) | 0.7621 | -0.34 (-1.13-0.45) | 0.4014 | 0.0116 |
| GrimAgeMortacc | 0.13 (-0.10-0.37) | 0.2654 | 0.00 (-0.25-0.24) | 0.9810 | < 0.0001 |
| GrimAge2Mortacc | 0.26 (-0.05-0.56) | 0.0999 | 0.11 (-0.19-0.41) | 0.4685 | 0.6109 |
Age-stratified analyses [Table 6] indicated significant associations between MBzP and all five DNAm algorithms in participants aged 50-64 years (P-values = 0.0012-0.0155), with β values ranging from 0.30 (95%CI: 0.10-0.51) for GrimAgeMortacc to 0.93 (95%CI: 0.34-1.52) for PhenoAgeacc. In the ≥ 65 age group, significant associations were observed between MEP and GrimAgeMortacc (β = -0.17, 95%CI: -0.31 to -0.03, P-values = 0.0212) and between MBzP and GrimAge2Mortacc (β = 0.33, 95%CI: 0.05-0.62, P-values = 0.0239). These associations are emphasized in Supplementary Figure 2, which shows correlations for MBzP across all five DNAm algorithms in the 50-64 age group [Supplementary Figure 2A]. Overall, significant associations between GrimAge2Mortacc and MBzP were observed in the general sample, with particularly stronger correlations between PhenoAgeacc and MBzP among males (P-interaction < 0.0001) and those aged 50-64 (P-interaction < 0.0001). GAMs detected no significant nonlinearity in the associations between PAEs and epigenetic aging (all nonlinearity P > 0.05), validating the use of linear regression in this analysis.
Associations of urinary phthalate metabolites with five DNAm algorithms of aging by age
| Phthalate metabolite | 50-64 years | ≥ 65 years | P interaction | ||
| β (95%CI) | P-value | β (95%CI) | P-value | ||
| MEP | |||||
| HannumAgeacc | 0.10 (-0.20-0.39) | 0.5239 | -0.07 (-0.46-0.32) | 0.7326 | < 0.0001 |
| SkinBloodAgeacc | 0.12 (-0.15-0.39) | 0.3671 | -0.08 (-0.48-0.32) | 0.6971 | < 0.0001 |
| PhenoAgeacc | 0.30 (-0.05-0.65) | 0.0896 | -0.01 (-0.49-0.47) | 0.9662 | < 0.0001 |
| GrimAgeMortacc | 0.10 (-0.02-0.22) | 0.1141 | -0.17 (-0.31-0.03) | 0.0212 | < 0.0001 |
| GrimAge2Mortacc | 0.13 (-0.03-0.29) | 0.1108 | -0.13 (-0.30-0.04) | 0.1493 | < 0.0001 |
| MEHP | |||||
| HannumAgeacc | -0.25 (-0.81-0.30) | 0.3673 | -0.02 (-0.75-0.70) | 0.9506 | < 0.0001 |
| SkinBloodAgeacc | 0.12 (-0.38-0.63) | 0.6316 | -0.05 (-0.79-0.68) | 0.8905 | 0.0003 |
| PhenoAgeacc | -0.07 (-0.72-0.57) | 0.8229 | -0.27 (-1.15-0.61) | 0.5454 | < 0.0001 |
| GrimAgeMortacc | 0.03 (-0.19-0.26) | 0.7757 | -0.17 (-0.44-0.09) | 0.2008 | < 0.0001 |
| GrimAge2Mortacc | -0.01 (-0.32-0.29) | 0.9281 | -0.16 (-0.47-0.16) | 0.3277 | < 0.0001 |
| MBzP | |||||
| HannumAgeacc | 0.74 (0.23-1.24) | 0.0044 | 0.36 (-0.30-1.02) | 0.2835 | < 0.0001 |
| SkinBloodAgeacc | 0.57 (0.11-1.03) | 0.0155 | 0.38 (-0.29-1.05) | 0.2688 | < 0.0001 |
| PhenoAgeacc | 0.93 (0.34-1.52) | 0.0022 | 0.47 (-0.33-1.27) | 0.2494 | < 0.0001 |
| GrimAgeMortacc | 0.30 (0.10-0.51) | 0.0042 | 0.16 (-0.08-0.40) | 0.1942 | < 0.0001 |
| GrimAge2Mortacc | 0.46 (0.18-0.73) | 0.0012 | 0.33 (0.05-0.62) | 0.0239 | < 0.0001 |
| MBP | |||||
| HannumAgeacc | 0.21 (-0.36-0.79) | 0.4641 | 0.00 (-0.65-0.66) | 0.9932 | < 0.0001 |
| SkinBloodAgeacc | 0.15 (-0.37-0.67) | 0.5765 | -0.38 (-1.04-0.28) | 0.2604 | < 0.0001 |
| PhenoAgeacc | 0.49 (-0.18-1.16) | 0.1514 | -0.54 (-1.33-0.25) | 0.1845 | < 0.0001 |
| GrimAgeMortacc | 0.11 (-0.13-0.34) | 0.3748 | 0.01 (-0.23-0.24) | 0.9559 | < 0.0001 |
| GrimAge2Mortacc | 0.23 (-0.09-0.54) | 0.1564 | 0.16 (-0.13-0.44) | 0.2833 | < 0.0001 |
Discussion
Our study demonstrates that urinary MBzP is significantly associated with accelerated epigenetic aging, particularly affecting GrimAge-based algorithms in the overall population and PhenoAgeacc in males aged 50-64 years. This association persisted after multivariable adjustment and remained robust in age- and sex-stratified analyses. Notably, MBzP exerted stronger effects in males and middle-aged participants (50-64 years), suggesting demographic-specific susceptibility. In contrast, despite their high detection rates, MEP, MEHP, and MBP showed no significant associations with DNAm aging biomarkers.
This demographic-specific association points to intersecting biological vulnerabilities. First, MBzP exposure is linked to anti-androgenic effects in humans, as evidenced by its correlation with delayed pubarche in girls[50]. This property may synergize with age-related testosterone decline in males, creating a unique window of susceptibility[51]. Second, MBzP directly induces oxidative stress in human erythrocytes by increasing reactive oxygen species (ROS) and hydroxyl radicals at concentrations ≥ 5 μg/mL, while simultaneously altering superoxide dismutase and glutathione peroxidase activity[52]. Middle-aged males demonstrate reduced plasma antioxidant capacity, which could exacerbate MBzP-induced DNA damage[53]. This is supported by epidemiological evidence showing that the association between MBzP and uterine fibroid risk is mediated by oxidatively generated DNA damage (8-OHdG)[54].
These findings provide context for prior research on PAE. While Oluwayiose et al. reported broad links between PAEs and epigenetic age in sperm, with MBzP showing only a non-significant positive trend (β = 0.24, P = 0.10)[32], our study identifies MBzP as a significant driver of systemic aging in blood-derived DNAm algorithms among vulnerable demographics. This divergence highlights tissue-specific effects and underscores MBzP’s distinct role in systemic biological aging. The association between MBzP and aging measures appears to vary across populations. In elderly Koreans (samples 2012-2014), MBzP had a lower detection frequency (731 out of 1,190) but a higher average urinary concentration (2,190 ng/mL)[54]. In this elderly group, linear correlations were observed between urinary MBzP quartiles and measures of physical performance[54]. In contrast, a recent study of children (2017-2019) reported a very high MBzP detection frequency (99.5%) with a lower average concentration (11.8 ng/mL)[55]. Furthermore, compounds with lower detection frequencies (< 75%) in our study (MEHHP, MEOHP, MCPP, MiBP) were highly detectable in children’s urine (100%, 100%, 99.4%, 100%) with average concentrations of 28.5, 6.42, 1.78, and 20.1 ng/mL, respectively[55]. The attenuated MBzP-aging association in elderly Koreans contrasts with heightened susceptibility in children, further emphasizing population-specific vulnerabilities, where age-dependent exposure sources and metabolic shifts modulate risks[55,56]. This aligns with observations of progressive declines in antioxidant capacity during aging, which could amplify susceptibility to MBzP-induced oxidative stress in midlife[53].
The mechanistic basis for MBzP’s potency involves its direct biological activities. First, MBzP induces oxidative stress by elevating ROS and hydroxyl radicals in human erythrocytes, leading to DNA damage (8-OHdG) that mediates disease pathogenesis[52,54]. Second, MBzP exposure elevates systemic inflammation markers (C-reactive protein and interleukin-6) and promotes hyperuricemia through immune inflammation mediation[57,58]. Third, MBzP correlates with altered DNAm patterns in human sperm and urine (this study), confirming its potential to disrupt epigenetic processes[31]. These pathways converge on epigenetic aging mechanisms, through which MBzP-induced inflammation promotes GrimAge acceleration, a recognized mediator of cognitive impairment[59]. The stronger association in males aged 50 to 64 likely reflects three synergistic factors: (1) Interaction between MBzP’s anti-androgenic effects and age-related hormonal changes[50,53]; (2) Compromised antioxidant defenses in midlife males[53]; and (3) Enhanced sensitivity to inflammaging, as GrimAge incorporates inflammatory mortality predictors[59]. These findings shift focus from general PAE exposure to specific risk scenarios: MBzP exposure during midlife in males represents a critical window for the acceleration of biological aging. Future studies should validate these associations longitudinally while measuring oxidative stress and inflammation biomarkers to confirm mechanistic pathways.
Several limitations should be considered when interpreting the findings. First, as an observational study, it is susceptible to potential biases, including reverse causality and the influence of unmeasured or residual confounding factors (such as diet, occupation, or other environmental/lifestyle factors). These limitations restrict the ability to establish causal relationships between urinary PAE metabolites and DNAm-based aging algorithms. Second, the study sample comprised only U.S. participants aged 50 years and older. While the sample shares key sociodemographic characteristics with the broader U.S. population, it is not a random sample. This constrains the generalizability of the findings to younger populations, other geographical regions, or more diverse cohorts. Third, DNAm signatures were assessed at a single time point, limiting the ability to track their stability or changes over time. Longitudinal data would be necessary to better understand the temporal dynamics of these signatures and their associations with health outcomes. Finally, further validation in independent studies involving more diverse populations with varying age ranges and risk profiles is essential to confirm the robustness and generalizability of these results.
CONCLUSIONS
This study identifies MBzP as a significant predictor of accelerated epigenetic aging, particularly affecting GrimAge-based algorithms in the overall population. Crucially, males aged 50-64 years exhibited the strongest associations, with MBzP showing robust links to PhenoAge acceleration (β = 0.75, 95%CI: 0.12-1.38). In contrast, metabolites like MEP, MEHP, and MBP demonstrated no significant associations with DNAm aging biomarkers. Age-stratified analyses further revealed that MBzP’s effects were pronounced in middle-aged adults (50-64 years), which aligns with the observed decline in MEP exposure among older adults (≥ 65 years). These findings highlight MBzP as a sex- and age-specific risk factor for biological aging, warranting targeted investigation into its mechanistic pathways and the development of public health interventions for vulnerable demographics.
DECLARATIONS
Acknowledgments
Special thanks to Xinyi Tang (School of Archaeology and Museology, Peking University, Beijing 100871, China) for her assistance with the Graphical Abstract.
Authors’ contributions
Conceptualization, methodology, formal analysis, data curation, visualization, investigation, project administration, writing - original draft, writing - review and editing: Xu, Y. Q.
Methodology, validation, resources, writing - review and editing: Ding, C. Y.
Investigation, writing - review and editing: Gong, Y. L.; Hao, D. R.
Validation, writing - review and editing: Wang, J.
Data curation, validation, investigation, writing - review and editing: Zhang, H.
Writing - review and editing: An, T. Y.
Language editing: Cheong, I. H.
Resources, project administration, supervision, validation, writing - review and editing: Li, X. W.
Availability of data and materials
NHANES data are publicly available at https://wwwn.cdc.gov/Nchs/Nhanes/. Analysis code is available from the corresponding author upon reasonable request.
Financial support and sponsorship
This work was supported by grants from the Shanghai Jiao Tong University’s “New Young Teachers Launch Plan” (KJ3-0214-24-0015), the startup fund for Principal Investigators from the School of Medicine, Shanghai Jiao Tong University (KJ2-0112-23-0002), and the Strategic Priority Research Program of the Chinese Academy of Sciences (XDB0750200).
Conflicts of interest
Xu, Y. Q. is a Youth Editorial Board member of Journal of Environmental Exposure Assessment. Xu, Y. Q. was not involved in any steps of editorial processing, notably including reviewer selection, manuscript handling, or decision making. The other authors declared that there are no conflicts of interest.
Ethical approval and consent to participate
Not applicable.
Consent for publication
Not applicable.
Copyright
© The Author(s) 2025.
Supplementary Materials
REFERENCES
1. Kok, C. L.; Ho, C. K.; Teo, T. H.; Kato, K.; Koh, Y. Y. A novel implementation of a social robot for sustainable human engagement in homecare services for ageing populations. Sensors 2024, 24, 4466.
2. Lee, S.; Kang, W. Research landscape on hidden workers in aging populations: bibliometric review. Soc. Sci. 2024, 13, 342.
3. Song, M.; Wu, Q.; Zhu, H. Could the aging of the rural population boost green agricultural total factor productivity? Evidence from China. Sustainability 2024, 16, 6117.
4. Johnson, A. A.; Shokhirev, M. N. Contextualizing aging clocks and properly describing biological age. Aging. Cell. 2024, 23, e14377.
5. Kobelyatskaya, A. A.; Guvatova, Z. G.; Tkacheva, O. N.; et al. EchoAGE: echocardiography-based neural network model forecasting heart biological age. Aging. Dis. 2024, 16, 2383-97.
6. Martinez-Romero J, Fernandez ME, Bernier M, et al; Study of Longitudinal Aging in Mice (SLAM) Investigators. A hematology-based clock derived from the Study of Longitudinal Aging in Mice to estimate biological age. Nat. Aging. 2024, 4, 1882-96.
7. Zhao, C.; Yang, Y.; Wang, Y.; et al. Combined effects of genetic predisposition and sleep quality on acceleration of biological ageing: findings from the UK biobank cohort. Arch. Gerontol. Geriatr. 2024, 126, 105525.
8. Patel, L.; Roy, A.; Alvior, A. M. B.; et al. Phenoage and longitudinal changes on transthoracic echocardiography in Alström syndrome: a disease of accelerated ageing? Geroscience 2024, 46, 1989-99.
9. Chang, O. D.; Meier, H. C. S.; Maguire-Jack, K.; Davis-Kean, P.; Mitchell, C. Childhood maltreatment and longitudinal epigenetic aging: NIMHD Social Epigenomics Program. JAMA. Netw. Open. 2024, 7, e2421877.
10. Harris, K. M.; Levitt, B.; Gaydosh, L.; et al. Sociodemographic and lifestyle factors and epigenetic aging in US young adults: NIMHD Social Epigenomics Program. JAMA. Netw. Open. 2024, 7, e2427889.
11. Engvig A, Kalleberg KT, Westlye LT, Leonardsen EH; Alzheimer’s Disease Neuroimaging Initiative Consortium. Complementary value of molecular, phenotypic, and functional aging biomarkers in dementia prediction. Geroscience. 2025, 47, 2099-118.
12. Nannini, D. R.; Cortese, R.; VonTungeln, C.; Hildebrandt, G. C. Chemotherapy-induced acceleration of DNA methylation-based biological age in breast cancer. Epigenetics 2024, 19, 2360160.
13. Arge, L. A.; Lee, Y.; Skåra, K. H.; et al. Epigenetic aging and fecundability: the Norwegian Mother, Father and Child Cohort Study. Hum. Reprod. 2024, 39, 2806-15.
14. Nagata, M.; Komaki, S.; Nishida, Y.; et al. Influence of physical activity on the epigenetic clock: evidence from a Japanese cross-sectional study. Clin. Epigenetics. 2024, 16, 142.
15. Mendy, A.; Mersha, T. B. Epigenetic age acceleration and mortality risk prediction in U.S. adults. medRxiv. 2024.
16. Beydoun, M. A.; Beydoun, H. A.; Ashe, J.; et al. Relationships of depression and antidepressant use with epigenetic age acceleration and all-cause mortality among postmenopausal women. Aging 2024, 16, 8446-71.
17. Aronov, A.; Pan, Y.; Sun, X.; Susztak, K.; Lash, J.; Kelly, T. N. Abstract P413: epigenetic age acceleration measures predict cardiovascular outcomes in diabetic kidney disease. Circulation. 2024, 149.
18. Freilich, C. D.; Markon, K. E.; Cole, S. W.; Krueger, R. F. Loneliness, epigenetic age acceleration, and chronic health conditions. Psychol. Aging. 2024, 39, 337-49.
19. Jain, P. N.; Zhuang, B.; Whitehead, J.; Kobor, M. S.; Checchia, P. Abstract 17447: Effects of inflammatory biomarkers on epigenetic age acceleration in adult congenital heart disease. Circulation. 2023, 148.
20. Bozack, A. K.; Boileau, P.; Hubbard, A. E.; et al. The impact of prenatal and early-life arsenic exposure on epigenetic age acceleration among adults in Northern Chile. Environ. Epigenet. 2022, 8, dvac014.
21. Lee, D. W.; Lim, Y. H.; Choi, Y. J.; et al. Prenatal and early-life air pollutant exposure and epigenetic aging acceleration. Ecotoxicol. Environ. Saf. 2024, 283, 116823.
22. Ni, W.; Nikolaou, N.; Ward-Caviness, C. K.; et al. Associations between medium- and long-term exposure to air temperature and epigenetic age acceleration. Environ. Int. 2023, 178, 108109.
23. America’s Children and the Environment. Phthalates. 2017. https://www.epa.gov/sites/default/files/2017-08/documents/phthalates_updates_live_file_508_0.pdf. (accessed 15 Aug 2025).
24. Liu, Y.; Wu, N.; Xu, R.; Li, Z.; Xu, X.; Liu, S. Phthalates released from microplastics can’t be ignored: sources, fate, ecological risks, and human exposure risks. TrAC. Trends. Anal. Chem. 2024, 179, 117870.
25. Touhouche, S.; Guenifed, A.; Yaker, N. D.; Khelfi, A. Phthalates and reproduction functions of woman: Real effects or myths? Toxicol. Anal. Clin. 2024, 36, 109-30.
26. Lee, G.; Lee, J.; Park, N. Y.; et al. Exposure to phthalates and alternative plasticizers in patients with impaired kidney function in Korea: temporal trend during 2011-2020 and its association with chronic kidney disease. Environ. Sci. Technol. 2024, 58, 19128-40.
27. Baker, B. H.; Melough, M. M.; Paquette, A. G.; et al. Ultra-processed and fast food consumption, exposure to phthalates during pregnancy, and socioeconomic disparities in phthalate exposures. Environ. Int. 2024, 183, 108427.
28. Verstraete, S.; Vanhorebeek, I.; Covaci, A.; et al. Circulating phthalates during critical illness in children are associated with long-term attention deficit: a study of a development and a validation cohort. Intensive. Care. Med. 2016, 42, 379-92.
29. LaRocca, J.; Binder, A. M.; McElrath, T. F.; Michels, K. B. First-trimester urine concentrations of phthalate metabolites and phenols and placenta miRNA expression in a cohort of U.S. women. Environ. Health. Perspect. 2016, 124, 380-7.
30. Kim, J. I.; Kim, J. W.; Shin, I.; Kim, B. N. Interaction of DRD4 methylation and phthalate metabolites affects continuous performance test performance in ADHD. J. Atten. Disord. 2021, 25, 161-70.
31. Nowak, K.; Oluwayiose, O. A.; Houle, E.; et al. Urinary concentrations of phthalate and phthalate alternative metabolites and sperm DNA methylation: a multi-cohort and meta-analysis of men in preconception studies. Environ. Int. 2024, 192, 109049.
32. Oluwayiose, O. A.; Houle, E.; Wu, H.; et al. Urinary phthalate metabolites and their mixtures are associated with advanced sperm epigenetic aging in a general population. Environ. Res. 2022, 214, 114115.
33. Li, Q.; Yao, J.; Duan, R.; Feng, T. Is there an association between serum 25-hydroxyvitamin D concentrations and obstructive sleep apnoea? A cross-sectional analysis of NHANES 2007-2008 data. BMJ. Open. 2024, 14, e085080.
34. Matabuena, M.; Petersen, A. Distributional data analysis of accelerometer data from the NHANES database using nonparametric survey regression models. J. R. Stat. Soc. Ser. C. Appl. Stat. 2023, 72, 294-313.
35. Song, G.; Yang, C.; Qu, Z.; Lin, X.; Liu, M.; Wang, Y. Association between seropositivity for toxocariasis and cognitive functioning in older adults: an analysis of cross-sectional data from the US National Health and Nutrition Examination Survey (NHANES), 2011-2014. BMJ. Open. 2023, 13, e068974.
36. Phthalates, phytoestrogens & PAHs - urine PHPYPA urinary phthalates (PHPYPA) (1999-2000 data documentation, codebook, and frequencies). https://wwwn.cdc.gov/Nchs/Data/Nhanes/Public/1999/DataFiles/PHPYPA.htm. (accessed 15 Aug 2025).
37. National health and nutrition examination survey. 2001-2002 data documentation, codebook, and frequencies. Phthalates, phytoestrogens & PAHs - urine (PHPYPA_B). 2005. https://wwwn.cdc.gov/Nchs/Data/Nhanes/Public/2001/DataFiles/PHPYPA_B.htm. (accessed 15 Aug 2025).
38. Johnson, C. L.; Paulose-Ram, R.; Ogden, C. L.; et al. National health and nutrition examination survey: analytic guidelines, 1999-2010. Vital. Health. Stat. 2. 2013, 1-24.
39. Scinicariello, F.; Feroe, A. G.; Attanasio, R. Urinary phthalates and leukocyte telomere length: an analysis of NHANES 1999-2002. EBioMedicine 2016, 6, 96-102.
40. National health and nutrition examination survey. NHANES 1999-2002 DNA methylation array and epigenetic biomarkers. https://wwwn.cdc.gov/Nchs/Nhanes/DNAm/Default.aspx. (accessed 15 Aug 2025).
41. Hannum, G.; Guinney, J.; Zhao, L.; et al. Genome-wide methylation profiles reveal quantitative views of human aging rates. Mol. Cell. 2013, 49, 359-67.
42. Horvath, S.; Oshima, J.; Martin, G. M.; et al. Epigenetic clock for skin and blood cells applied to Hutchinson Gilford Progeria Syndrome and ex vivo studies. Aging 2018, 10, 1758-75.
43. Levine, M. E.; Lu, A. T.; Quach, A.; et al. An epigenetic biomarker of aging for lifespan and healthspan. Aging 2018, 10, 573-91.
44. Lu, A. T.; Quach, A.; Wilson, J. G.; et al. DNA methylation GrimAge strongly predicts lifespan and healthspan. Aging 2019, 11, 303-27.
45. Lu, A. T.; Binder, A. M.; Zhang, J.; et al. DNA methylation GrimAge version 2. Aging 2022, 14, 9484-549.
46. Muntner, P.; Hardy, S. T.; Fine, L. J.; et al. Trends in blood pressure control among US adults with hypertension, 1999-2000 to 2017-2018. JAMA 2020, 324, 1190-200.
47. Saint-Maurice, P. F.; Troiano, R. P.; Bassett, D. R. Jr.; et al. Association of daily step count and step intensity with mortality among US adults. JAMA 2020, 323, 1151-60.
48. Houseman, E. A.; Accomando, W. P.; Koestler, D. C.; et al. DNA methylation arrays as surrogate measures of cell mixture distribution. BMC. Bioinformatics. 2012, 13, 86.
49. NHANES. Laboratory procedure manual. https://wwwn.cdc.gov/nchs/data/nhanes/public/2001/labmethods/phpypa_b_met_phthalates.pdf. (accessed 15 Aug 2025).
50. Frederiksen, H.; Sørensen, K.; Mouritsen, A.; et al. High urinary phthalate concentration associated with delayed pubarche in girls. Int. J. Androl. 2012, 35, 216-26.
51. Chang, W. H.; Li, S. S.; Wu, M. H.; Pan, H. A.; Lee, C. C. Phthalates might interfere with testicular function by reducing testosterone and insulin-like factor 3 levels. Hum. Reprod. 2015, 30, 2658-70.
52. Sicińska, P.; Kik, K.; Bukowska, B. Human erythrocytes exposed to phthalates and their metabolites alter antioxidant enzyme activity and hemoglobin oxidation. Int. J. Mol. Sci. 2020, 21, 4480.
53. Andriollo-Sanchez, M.; Hininger-Favier, I.; Meunier, N.; et al. Age-related oxidative stress and antioxidant parameters in middle-aged and older European subjects: the ZENITH study. Eur. J. Clin. Nutr. 2005, 59 Suppl 2, S58-62.
54. Zhang, M.; Liu, C.; Yuan, X. Q.; et al. Oxidatively generated DNA damage mediates the associations of exposure to phthalates with uterine fibroids and endometriosis: findings from TREE cohort. Free. Radic. Biol. Med. 2023, 205, 69-76.
55. Yoon, J.; García-Esquinas, E.; Kim, J.; et al. Urinary phthalate metabolites and slow walking speed in the Korean Elderly Environmental Panel II Study. Environ. Health. Perspect. 2023, 131, 47005.
56. Bloom MS, Clark JM, Pearce JL, et al; ECHO-FGS study group. Impact of skin care products on phthalates and phthalate replacements in children: the ECHO-FGS. Environ. Health. Perspect. 2024, 132, 97001.
57. Zhang, Y.; Lyu, L.; Tao, Y.; Ju, H.; Chen, J. Health risks of phthalates: a review of immunotoxicity. Environ. Pollut. 2022, 313, 120173.
58. Niu, Z.; Chen, T.; Duan, Z.; et al. Associations of exposure to phthalate with serum uric acid and hyperuricemia risk, and the mediating role of systemic immune inflammation. Ecotoxicol. Environ. Saf. 2024, 287, 117269.
Cite This Article
How to Cite
Download Citation
Export Citation File:
Type of Import
Tips on Downloading Citation
Citation Manager File Format
Type of Import
Direct Import: When the Direct Import option is selected (the default state), a dialogue box will give you the option to Save or Open the downloaded citation data. Choosing Open will either launch your citation manager or give you a choice of applications with which to use the metadata. The Save option saves the file locally for later use.
Indirect Import: When the Indirect Import option is selected, the metadata is displayed and may be copied and pasted as needed.
About This Article
Special Issue
Copyright

Data & Comments
Data
0


Comments
Comments must be written in English. Spam, offensive content, impersonation, and private information will not be permitted. If any comment is reported and identified as inappropriate content by OAE staff, the comment will be removed without notice. If you have any queries or need any help, please contact us at [email protected].