

PM2.5 and O3 co-exposure affecting serum LDL-C: evidence from epidemiology and animal models
 0
0 Abstract
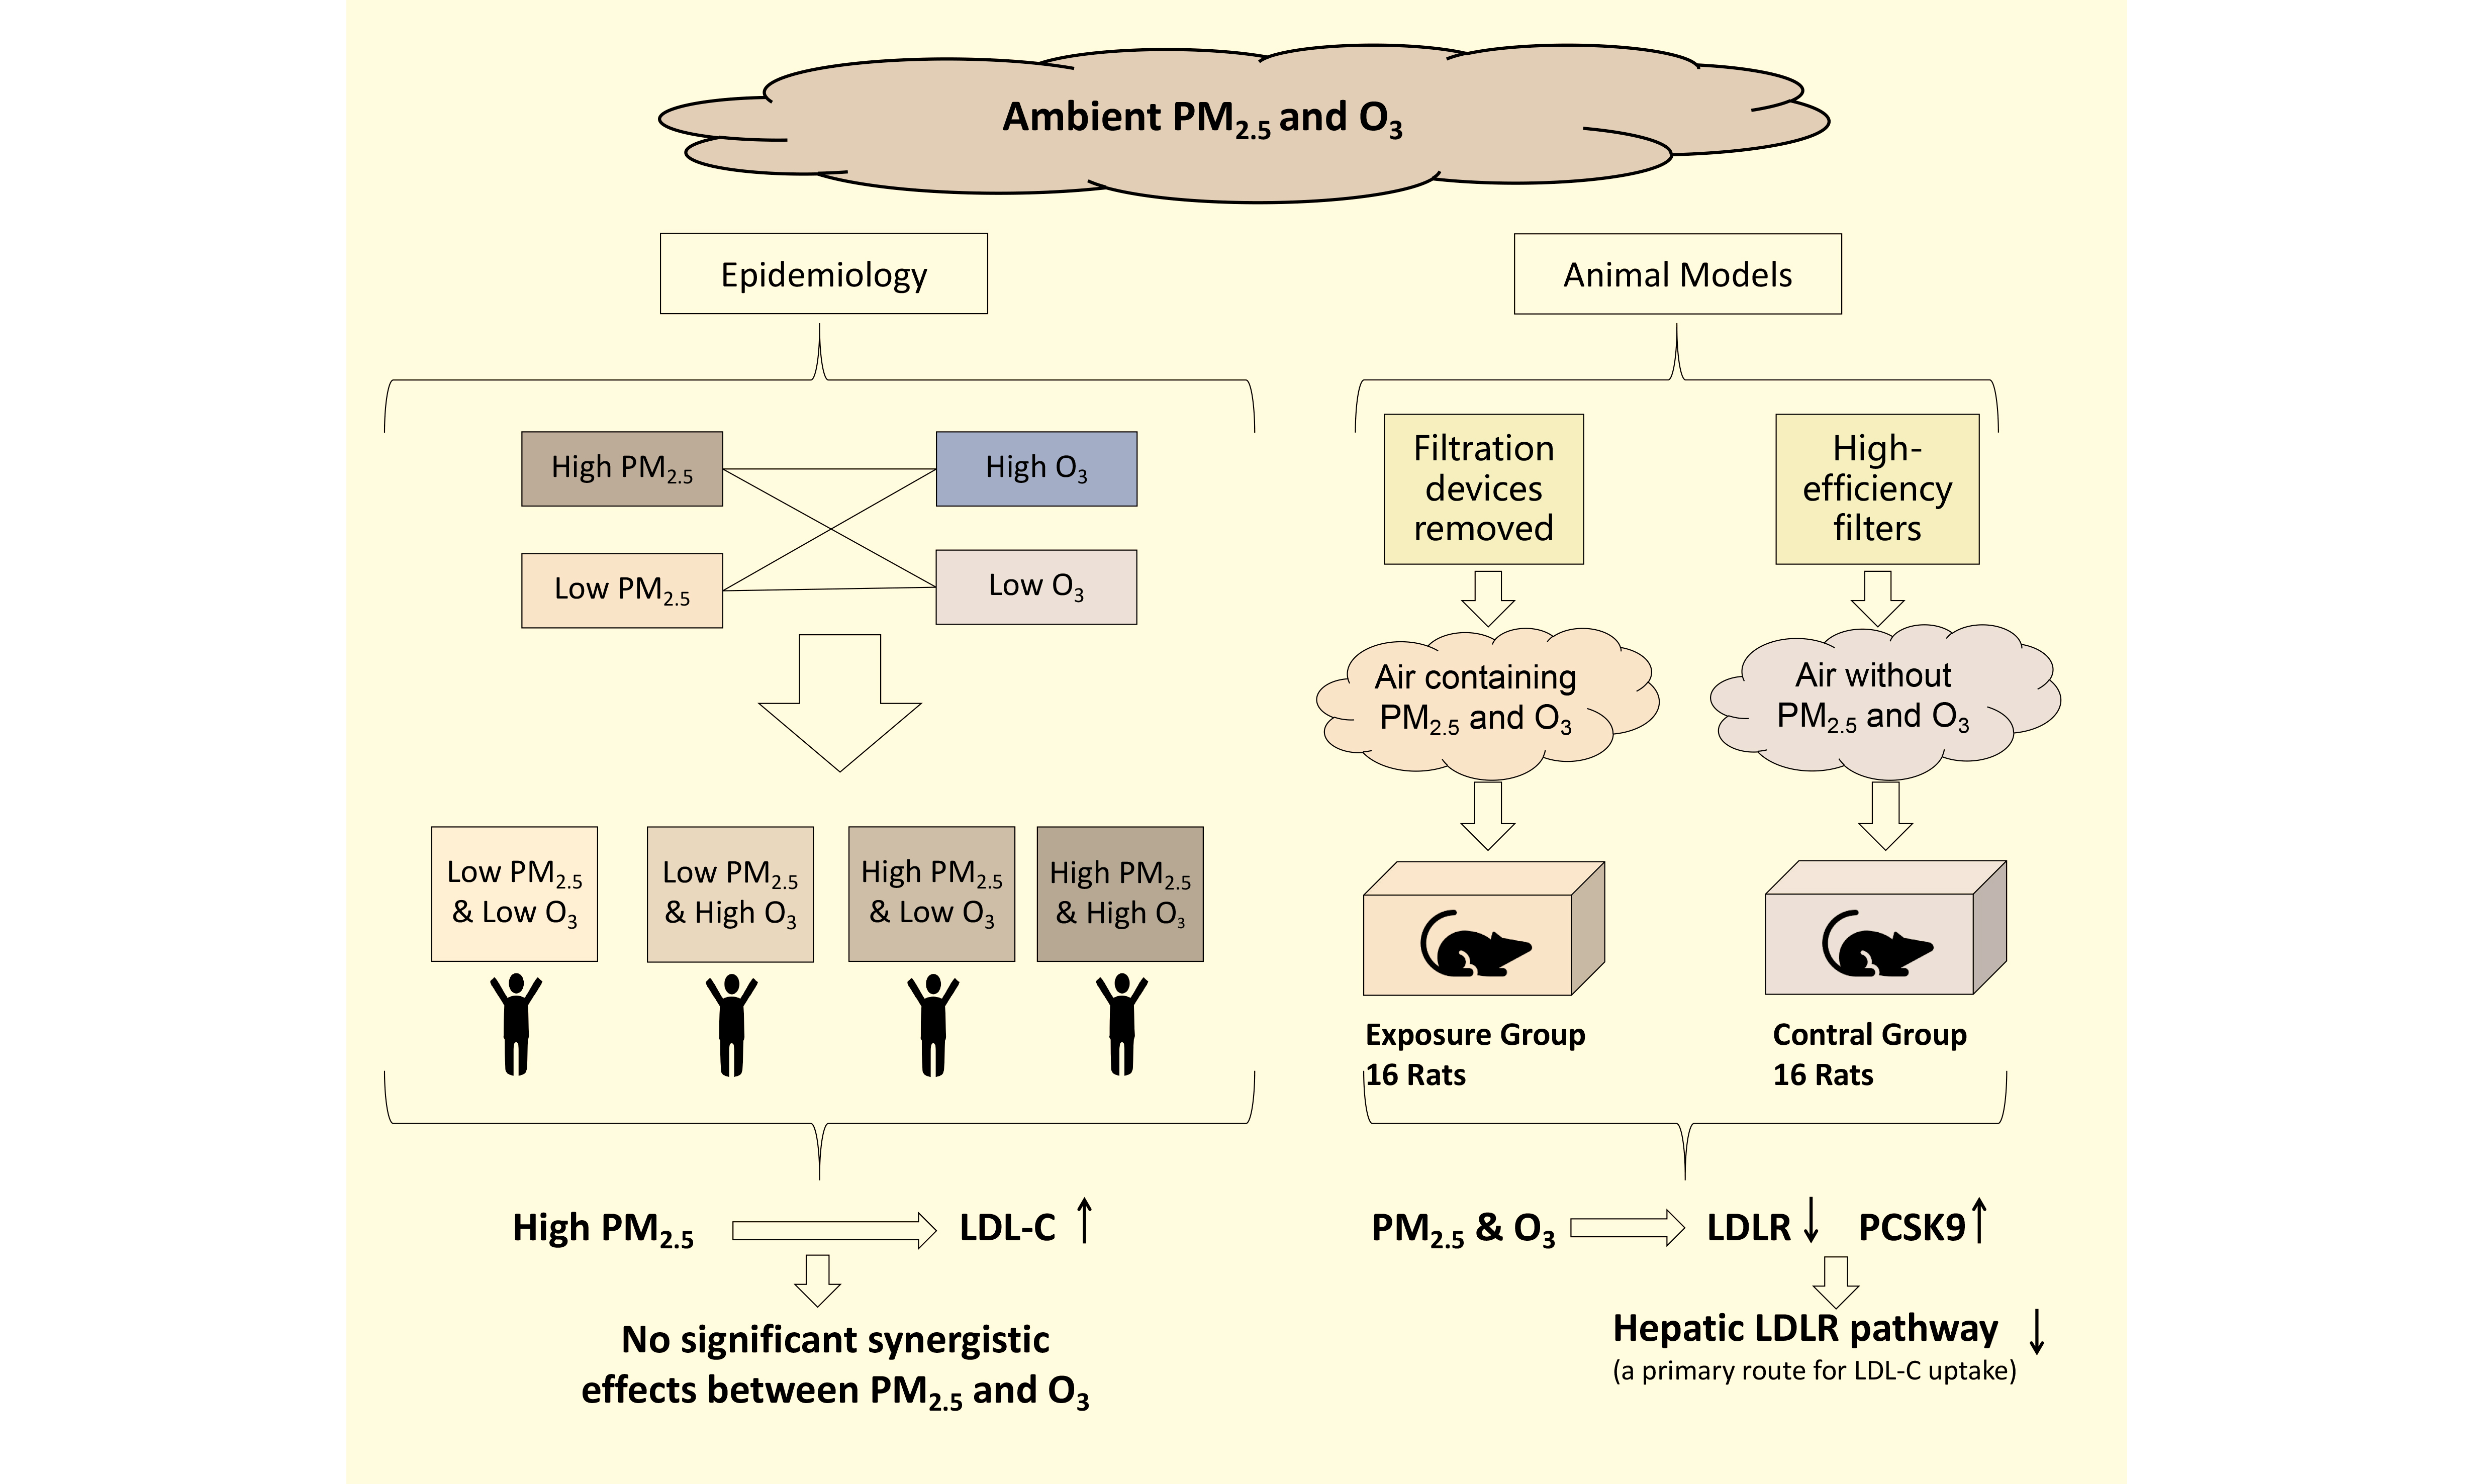
Air pollution and high low-density lipoprotein cholesterol (LDL-C) levels are both among the top ten global risk factors. This study aims to investigate the impact of long-term exposure to ambient PM2.5 and O3 on LDL-C concentrations in peripheral blood and their effects on hepatic metabolism of LDL-C, based on epidemiological research and animal experiments. Epidemiological research employed a cross-sectional design, enrolling 27,642 male health examinees aged 20-50 in Beijing from March 2021 to February 2023, with an exposure period of one year. Generalized additive models were employed to explore the association between exposure to PM2.5 and O3 and levels of LDL-C. The animal experiment involved rats exposed to an atmosphere containing PM2.5 and O3, alongside a control group breathing air devoid of PM2.5 and O3, with an exposure duration of 15 months. Reverse transcription quantitative polymerase chain reaction and immunohistochemical staining were utilized to detect differences in mRNA expression and protein expression at key loci of LDL-C metabolism between the two groups. In our results, the epidemiological research showed that long-term exposure to PM2.5 was primarily associated with increased levels of LDL-C and elevated risk of LDL-C abnormality. The animal experiments demonstrated that long-term exposure to air pollution suppressed the liver's ability to absorb LDL-C and inhibited the expression of GRP78, which may be one of the mechanisms leading to increased serum LDL-C levels.
Keywords
INTRODUCTION
High levels of low-density lipoprotein cholesterol (LDL-C) are a pathogenic risk factor for cardiovascular diseases (CVDs) and rank among the top ten global contributors to mortality[1,2]. Besides, there is substantial evidence elucidating the relationship between air pollution and CVDs[3-6]. The most recent Global Burden of Disease (GBD) study indicates that in 2021, CVDs were the primary cause of mortality attributed to air pollution, accounting for 55% of air pollution-related deaths[2]. In the potential mechanisms by which air pollution leads to the occurrence of CVDs, LDL-C in the blood may play a significant role. Numerous epidemiological studies have supported the hypothesis that air pollution induces CVDs through the LDL-C pathway. Evidence from the Harvard Six Cities study has shown that air pollutants, represented as PM2.5 (particulate matter), can accelerate the formation rate of atherosclerosis[7]. Yang et al. found that the correlation between air pollution and CVDs is strongest in populations with elevated β-lipoproteinemia (high LDL)[8]. Moreover, an increasing body of evidence directly shows that exposure to air pollution is associated with an increase in human blood LDL-C[9-11]. These pieces of evidence directly or indirectly illustrate the close association between CVDs, LDL-C, and air pollution.
Air pollution is composed of multiple pollution components, which may interact with each other, affecting each other's effects. As research into the health impacts of air pollution advances, there is a growing focus on the impact of mixed exposures to achieve a more realistic and accurate assessment of health effects[12]. PM2.5 and O3 are the main components of air pollution, and the evidence linking them to CVD mortality is also the most robust. However, the evidence from population studies and animal experiments on the effects of co-exposure to PM2.5 and O3 on LDL-C is relatively scarce. Previous studies suggest the possibility of interactive effects between PM2.5 and O3. PM2.5 and O3 have overlapping pathways of action on the human body, both capable of causing changes in metabolism through oxidative stress[13-15]. Additionally, a multicenter study by Liu et al. showed that the coexistence of high PM2.5 and high O3 exposure can strengthen the association between each and mortality[16]. Therefore, studying the impact of co-exposure to PM2.5 and O3 on blood LDL-C is necessary for evaluating the effects of air pollution on blood LDL-C in real-world settings.
The Beijing area in China exhibits a prominent phenomenon of high levels of both PM2.5 and O3, providing a typical scenario of high exposure to both PM2.5 and O3 for air pollution research. Moreover, as a densely populated metropolis, the one-year average concentrations of PM2.5 and O3 in the Beijing area affect the health of tens of millions of people. Therefore, this study aims to use population health examination data and animal experiments in Beijing to jointly investigate the impact of long-term co-exposure to ambient PM2.5 and O3 on LDL-C concentrations in peripheral blood and their effects on hepatic metabolism of LDL-C. The research provides epidemiological evidence and animal experimental evidence for the impact of air pollution on blood lipids and identifies key points of action for air pollution affecting LDL-C metabolism, providing clues for subsequent measures to address the lipid hazards of air pollution.
METHODS
Epidemiological research
Study population and outcomes
All participants were recruited from male health examinees visiting the Third Hospital of Peking University between March 1, 2021, and February 28, 2023. The inclusion criteria for this study were: (1) age between 20 and 50 years; (2) complete blood biochemical examination data without missing values; (3) participants' cardiac enzyme indicators [creatine kinase MB (CK-MB) creatine kinase (CK)], liver function indicators [alanine aminotransferase (ALT), aspartate aminotransferase (AST), γ-glutamyl transpeptidase (γ-GT), and renal function indicators [serum urea, serum creatinine (Cr)] were all within the healthy range; (4) residing in the Beijing area. A total of 27,642 male participants were ultimately enrolled. The main reasons for choosing this population as the research object are as follows. Previous epidemiological evidence, including the recent report by Anand et al., indicates that LDL-C levels in men are more strongly associated with ambient air pollution[9]. Endogenous oestrogens exert a well-documented lipid-protective effect[17]. The wide inter-individual variability in oestrogen status among women of reproductive age could therefore introduce unmeasured confounding. By focusing on men, we aimed to study a population that is both more sensitive to the exposure and characterized by a comparatively homogeneous lipid profile.
The study was approved by the hospital's Medical Science Research Ethics Committee, and all participants provided written informed consent before joining.
All participants were instructed to fast overnight, and blood samples were collected between 8:00 AM and 11:00 AM. Approximately 2 mL of blood was drawn for biochemical examinations, and all samples were collected and tested using the same methods. The tests were conducted in the laboratory department of this large tertiary hospital by trained and experienced laboratory physicians. Serum LDL-C was measured using a low-density lipoprotein cholesterol assay kit (direct method). High-density lipoprotein cholesterol (HDL-C), total cholesterol (TC), triglycerides (TG), fasting blood glucose (FBG), CK-MB, CK, ALT, AST, γ-GT, serum Cr, and serum urea were also measured. All detection indicators were measured using a biochemical analyzer AU5800 (Beckman Coulter Corp., Brea, USA).
The primary outcome was the participants' LDL-C levels and whether they were abnormal. According to the “Chinese Guidelines for the Management of Blood Lipids (2023),” an LDL-C level ≥ 4.1 mmol/L is defined as abnormal LDL-C.
Participants’ exposure levels to PM2.5 and O3
Air pollution data were collected from the Beijing Monitoring Station of the China National Environmental Monitoring Center (http://www.cnemc.cn/). The monitoring stations in Beijing record hourly concentrations of PM2.5, PM10, sulfur dioxide (SO2), nitrogen dioxide (NO2), ozone (O3), and carbon monoxide (CO). The 24-h average concentration is used as the daily concentration for PM2.5, PM10, SO2, NO2, and CO, and the maximum 8-h average is used as the daily concentration for O3. Based on the participants’ clinic dates, the average daily concentrations of PM2.5 and O3 from the day of the blood biochemical examination to the previous 365 days were calculated, serving as the participants' one-year average exposure levels to PM2.5 and O3. The same method was used to calculate the one-year average exposure levels for PM10, SO2, NO2, and CO for subsequent sensitivity analysis to adjust for other pollutants. In addition, daily temperature and humidity data were obtained from the China Meteorological Science Data Center (http://data.cma.cn/) for subsequent adjustment of confounding factors.
Study design and statistical analysis
Participants’ one-year exposure levels were matched according to the district they resided in and the date of their health examination. First, we modelled PM2.5 and O3 as continuous variables to estimate their long-term associations with LDL-C. Then, both pollutants were categorized to examine the combined effects. The population was divided into four groups based on the exposure levels of PM2.5 and O3: low PM2.5 & low O3 group (control group), low PM2.5 & high O3 group, high PM2.5 & low O3 group, and high PM2.5 & high O3 group, with the division criteria being the median exposure levels of PM2.5 and O3[16]. The impact of each exposure combination on LDL-C levels was analyzed using a generalized additive model (GAM), adjusting for covariates such as age, season, year, temperature (T), relative humidity (RH), FBG, CK-MB, CK, AST, ALT, γ-GT, Cr, and urea. It is hypothesized that the changes in LDL-C for the low PM2.5 & high O3 group, high PM2.5 & low O3 group, and high PM2.5 & high O3 group compared to the control group are β01, β10, and β11, respectively. If PM2.5 and O3 have a synergistic effect on LDL-C, it is required that: β11 > β01 + β10
The risk of abnormal LDL-C under different exposure combinations was analyzed using a Logistic regression model. The covariates were the same as above. The odds ratio (OR) is approximately equal to the relative risk (RR). The synergistic effect was calculated using the following formula:
If S > 1 and the 95% confidence interval (CI) is above 1, then the impact of PM2.5 and O3 on abnormal LDL-C is considered to have a synergistic effect[18].
In the subgroup analysis, we explored the impact of age on air pollution sensitivity by dividing participants into two groups: under 35 years old and 35 years old and above. Using 35 years as the stratification threshold approximated the median age of our study population and divided it into two comparably sized groups, thereby distinguishing relatively younger from relatively older participants.
In the sensitivity analysis, we used various methods to test the robustness of the results:
(1) PM10, SO2, NO2, and CO were included as covariates in the model to assess the impact of other pollutants on the results.
(2) Adjusted the inclusion criteria to include men over 50 years old or participants with other abnormal blood biochemical indicators to observe changes in the results.
(3) Removed time-related, meteorological, or blood biochemical indicator covariates from the model one by one to assess the impact of different covariates on the results.
(4) Considered different exposure time windows, using the average concentrations of PM2.5 and O3 over the past two or three years as long-term exposure levels, to observe the robustness of the results.
(5) When LDL-C abnormality was the outcome, a case-crossover study design was used for sensitivity analysis, matching participants from the same month and day of different years, and using conditional Logistic regression models for analysis to reduce the confounding effects of seasonal and date factors.
Animal experiments
Experimental animals and animals’ exposure to PM2.5 and O3
In this study, modified individually ventilated cages (IVCs, Suzhou New District Fengqiao Purification Equipment Co., Ltd., China) were used as the air pollution exposure system [Figure 1A], which were located in the Laboratory Animal Science Department of Peking University Health Science Center, near the heavily trafficked North Fourth Ring Road. The IVCs for the control group were equipped with a three-stage filtration device to provide clean air, with high-efficiency filters capable of removing 99.97% of particulate matter. The IVCs for the exposure group had these filtration devices removed, retaining only the interception device to filter particles larger than 2.5 μm, simulating outdoor traffic-related air pollution. The specific method was described in the previous literature[19]. The exposure group’ s IVCs contained PM2.5 and O3 exposure, while the control group's IVCs had PM2.5 and O3 levels below the detection limit. The physical conditions (such as temperature, humidity, ventilation frequency, noise, and gas flow rate) and concentrations of gas pollutants (such as SO2, NO2, and CO) were similar for both groups. The concentration of PM2.5 was measured by filter sampling and weighing. We used a TSI SP 730 sampler and 37mm quartz fiber filters, sampling once a week to calculate the average concentration for the week. The concentration of O3 was monitored using a 2B 220 ozone monitor, which recorded hourly O3 concentrations and calculated the maximum 8-hour average concentration daily.
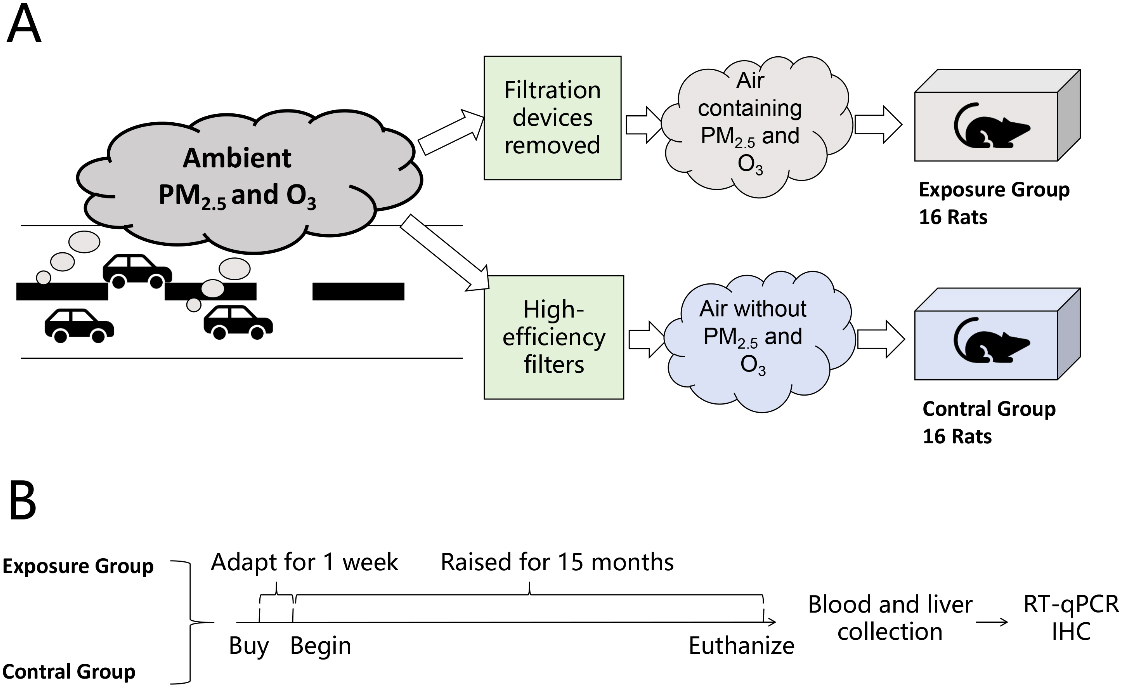
Figure 1. Schematic diagram of animal experiments. (A) Schematic diagram of exposure and control treatment; (B) Flowchart of the experimental procedure. RT-qPCR:Reverse transcription quantitative polymerase chain reaction; IHC: immunohistochemistry; PM: particulate matter; O3: ozone.
Male Sprague Dawley (SD) rats were selected as the experimental animals in this study to correspond with the human population study. We purchased 32 adult male specific pathogen-free (SPF) grade SD rats, aged 6 weeks and weighing 200 ± 10 grams, from the Laboratory Animal Science Department of Peking University Health Science Center. The study protocol was approved by the Biomedical Ethics Committee of Peking University (Approval No.: LA2017263). In the experimental design, 32 male SD rats were randomly divided into two groups of 16 each, one group exposed to PM2.5 and O3, and the other group breathing clean air, with an exposure period of 15 months [Figure 1B]. The rats were euthanized at the end of the experiment, dissected, and blood, liver, and other tissue samples were collected. The blood and tissues were used for serum analysis and pathological studies, respectively.
Laboratory testing
After the exposure was completed, the rats were sacrificed, and samples were collected. The collected samples were subjected to laboratory testing, which primarily included the analysis of lipids in the serum and liver tissue, histopathology of the liver, RT-qPCR and immunohistochemistry of liver tissue.
Serum samples were analyzed using a fully automated biochemical analyzer (AU400, Olympus, Japan) to measure metabolic indicators, including TC, TG, HDL-C, and LDL-C. Total cholesterol (TC) and triglyceride (TG) concentrations in the liver tissue were measured using total cholesterol and triglyceride assay kits (Nanjing Jincheng, China), respectively.
Fresh liver samples were fixed in 4% paraformaldehyde for 24 h, then dehydrated, cleared, and embedded in paraffin. After hardening of the paraffin blocks, 4-micron-thick sections were cut, mounted on glass slides, and stained with hematoxylin-eosin (HE) before dehydration and sealing.
mRNA was extracted from liver tissue and reverse transcribed using the TransScript® kit (Beijing TransGen Biotech Co., Ltd., China). We analyzed the expression of genes related to LDL-C uptake and very low density lipoprotein cholesterol (VLDL-C) secretion in the liver of SD rats, including LDLR, PCSK9, SREBP1c, APOB, MTTP, Cideb, SHP, PGC-1α, ADRP, GRP-78, and IRE1α, with β-actin as the internal reference. Primer sequences are shown in Supplementary Table 1. The reaction system was prepared using TransStar Top Green qPCR SuperMix (Beijing TransGen Biotech Co., Ltd., China), and the mRNA levels of target genes relative to β-actin were determined by the ΔCT method, using a three-step amplification and real-time fluorescence data collection.
Immunohistochemical staining was used to qualitatively compare protein expression differences and corroborate RT-qPCR results. Target proteins included LDLR, PCSK9, and GRP78. Antibodies used included Anti-LDL Receptor Rabbit pAb (GB11369-100, Wuhan Saiwei Biotechnology Co., Ltd., China), PCSK9 Antibody (PK18957S, Abmart Biomedical Ltd., China), and GRP78 BiP Antibody (T55166, Abmart Biomedical Ltd., China). Rat liver paraffin sections were subjected to immunohistochemical staining and then scanned at 20× using a pathology slide scanner. Five fields of view were selected for each sample, and the optical density (OD) and area of positive areas were calculated using ImageJ software to determine the average optical density (AOD).
Statistical analysis
Continuous variables are described with mean and standard deviation (SD) or standard error (SE), and group comparisons are made using one-way ANOVA. Categorical variables are described with numbers and percentages (%). Group comparisons are made using the chi-square test. Spearman’s correlation coefficient is used to calculate correlations. All statistical analyses were performed using R software (R Project for Statistical Computing, R version 4.0.3), and p-values less than 0.05 were considered statistically significant.
RESULTS AND DISCUSSION
Population characteristics and environmental exposure
A total of 27,642 eligible male participants were included in the study, with their ages and blood biochemical indicators presented in Table 1. The age range of the participants was between 20 and 50 years, with an average age of 34.38 years. The average level of LDL-C among the participants was 3.11 mmol/L. Analysis using the Spearman correlation coefficient revealed that the LDL-C levels of the participants were most strongly correlated with TC levels, with a correlation coefficient of 0.84 [Supplementary Figure 1].
Blood biochemical characteristics of participants (27,642 individuals, 100% male)
| Category | Mean (SD) | Median [P25, P75] |
| Age (years) | 34.28 (5.22) | 34.00 [31.00, 37.00] |
| FBG (mmol/L) | 5.41 (1.27) | 5.20 [4.90, 5.60] |
| TC (mmol/L) | 4.84 (0.91) | 4.78 [4.21, 5.39] |
| TG (mmol/L) | 1.67 (1.41) | 1.34 [0.94, 1.95] |
| HDL-C (mmol/L) | 1.12 (0.23) | 1.08 [0.95, 1.25] |
| LDL-C (mmol/L) | 3.11 (0.75) | 3.07 [2.60, 3.57] |
| CK-MB (U/L) | 7.46 (2.66) | 7.00 [6.00, 9.00] |
| CK (U/L) | 124.04 (55.58) | 110.00 [87.00, 145.00] |
| ALT (U/L) | 24.69 (9.98) | 23.00 [17.00, 31.00] |
| AST (U/L) | 21.49 (4.65) | 21.00 [18.00, 24.00] |
| γ-GT (U/L) | 27.10 (11.37) | 24.00 [18.00, 34.00] |
| Cr (μmol/L) | 87.76 (10.08) | 87.00 [81.00, 94.00] |
| Urea (mmol/L) | 5.10 (1.00) | 5.00 [4.40, 5.80] |
As shown in Table 2, the average PM2.5 exposure concentration in the year prior to the participants’ blood biochemical examination was 32.87 μg/m3 (SD: 4.17), with a median of 31.62 μg/m3 [interquartile range (IQR): 28.74, 35.8]; the average O3 exposure concentration was 90.56 μg/m3 (SD: 4.31), with a median of 89.71 μg/m3 (IQR: 86.41, 93.97). Analysis using the Spearman correlation coefficient revealed that the correlation coefficients between PM2.5, PM10, SO2, NO2, and CO ranged from 0.77 to 0.96, while the correlation coefficients between O3 and the other pollutants were between -0.10 and -0.45 [Supplementary Figure 2].
One-year average air pollution exposure levels of participants and meteorological factors on the day of examination
| Mean ± SD | Minimum | P25 | Median | P75 | Maximum | |
| Atmospheric pollutants | ||||||
| PM2.5 (μg/m3) | 32.87 ± 4.17 | 27.73 | 28.74 | 31.62 | 35.83 | 41.04 |
| PM10 (μg/m3) | 61.48 ± 8.04 | 50.12 | 53.05 | 61.49 | 69.63 | 73.78 |
| SO2 (μg/m3) | 2.98 ± 0.23 | 2.72 | 2.79 | 2.83 | 3.20 | 3.47 |
| NO2 (μg/m3) | 25.85 ± 2.36 | 21.97 | 23.77 | 25.56 | 28.12 | 29.96 |
| O3 (μg/m3) | 90.56 ± 4.31 | 85.30 | 86.41 | 89.71 | 93.97 | 98.42 |
| CO (mg/m3) | 0.56 ± 0.05 | 0.46 | 0.53 | 0.57 | 0.60 | 0.63 |
| Meteorological Factors | ||||||
| Temperature (℃) | 13.63 ± 10.91 | -11.58 | 3.73 | 14.39 | 23.72 | 31.81 |
| Relative Humidity (%) | 54.45 ± 20.56 | 15.50 | 36.78 | 53.94 | 72.09 | 100.00 |
Association between combined exposure to PM2.5 and O3 and LDL-C
Exposure as a continuous variable
LDL-C is a significant risk factor for atherosclerotic cardiovascular diseases, and reducing LDL-C can significantly decrease mortality[20-22].
The LDL-C distribution in our study population approximated a normal distribution [Supplementary Figure 3]. In single-pollutant models, LDL-C exhibited a monotonic increase with rising long-term PM2.5 exposure [Figure 2A], whereas no appreciable change in LDL-C was observed with increasing O3 concentrations [Figure 2B]. In two-pollutant models, LDL-C reached its maximum when both PM2.5 and O3 concentrations were at their highest [Figure 2C], indicating a possible interaction between long-term exposures to PM2.5 and O3.
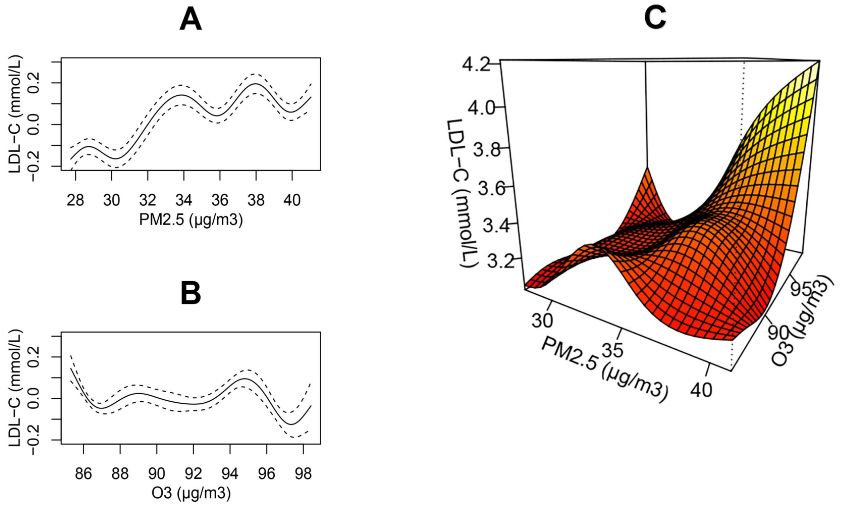
Figure 2. The smoothed trends in population LDL-C across the full distribution of PM2.5 and O3 concentrations. Panels A and B depict single-pollutant models of the form: LDL-C = s(PM2.5) [or s(O3)] + s(Age) + Season + Year + s(T) + s(RH) + s(FBG) + s(CK-MB) + s(CK) + s(ALT) + s(AST) + s(γ-GT) + s(Cr) + s(Urea). Panel C presents the two-pollutant model: LDL-C = ti(PM2.5) + ti(O3) + ti(PM2.5, O3) + s(Age) + Season + Year + s(T) + s(RH) + s(FBG) + s(CK-MB) + s(CK) + s(ALT) + s(AST) + s(γ-GT) + s(Cr) + s(Urea). Here, s(·) denotes spline smoothing for potential non-linear effects, and ti(·) denotes interaction terms that enable possible non-linear and non-additive joint effects of the two pollutants. LDL-C: Low-density lipoprotein cholesterol; PM: particulate matter; O3: ozone; T: temperature; RH: relative humidity; FBG: fasting blood glucose; CK-MB: creatine kinase-MB; CK: creatine kinase; ALT: alanine aminotransferase; AST: aspartate aminotransferase; γ-GT: γ-glutamyl transferase; Cr: creatinine; Urea: blood urea nitrogen.
Exposure as a categorical variable
In this study, participants were categorized based on the median exposure levels of PM2.5 and O3. Figure 3A displays the LDL-C levels of participants in each exposure group. The results suggested that when PM2.5 exposure levels were high, LDL-C levels significantly increased, and with the increase in O3 exposure levels, the LDL-C levels in the high PM2.5 exposure group slightly rose.
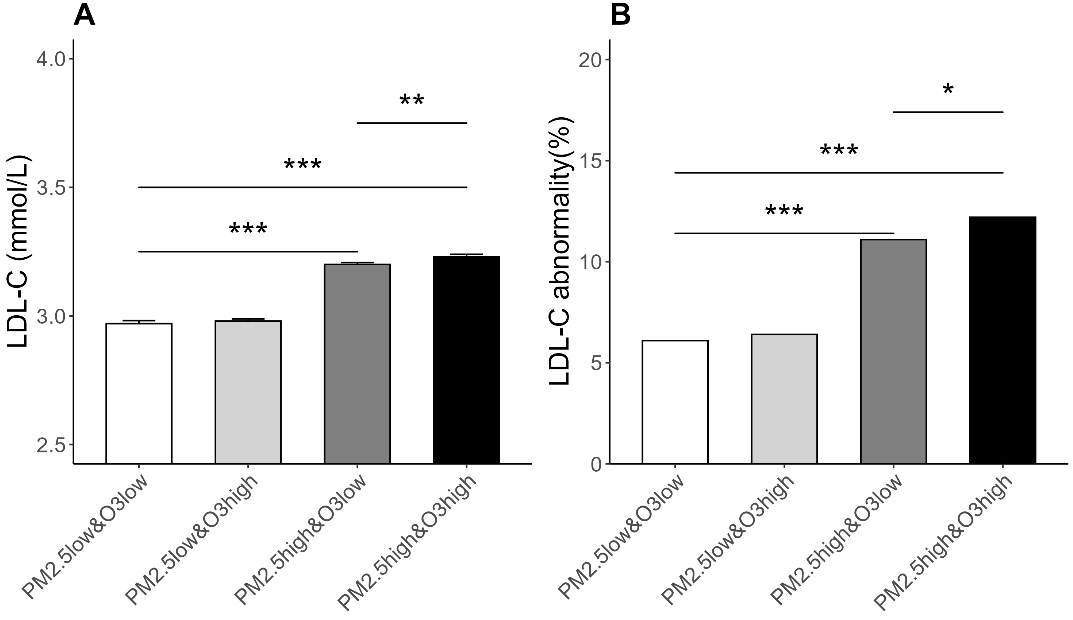
Figure 3. LDL-C Levels and Prevalence of Abnormal LDL-C among Participants Exposed to Different Combinations of PM2.5 and O3. (A) The vertical axis represents the LDL-C level, and the error bars represent the SE; SE = SD/
Used GAM to correct covariates. As shown in Figure 4, compared to the reference group, the changes in LDL-C for the low PM2.5 & high O3, high PM2.5 & low O3, and high PM2.5 & high O3 groups were 0.0185 (95% CI: -0.0239, 0.0609, P > 0.05) mmol/L, 0.2481 (95% CI: 0.1861, 0.3101, P < 0.001) mmol/L, and 0.2449 (95% CI: 0.1897, 0.3000, P < 0.001) mmol/L, respectively. The change in LDL-C for the high PM2.5 & high O3 group (β11 = 0.2449 mmol/L) was not greater than the sum of the LDL-C changes for the low PM2.5 & high O3 group and the high PM2.5 & low O3 group (β01 = 0.0185 mmol/L, β10 = 0.2481 mmol/L), indicating no observed synergistic effect. In different age subgroups, a high exposure to PM2.5 was also associated with an increase in LDL-C, but no synergistic effect between PM2.5 and O3 was observed.
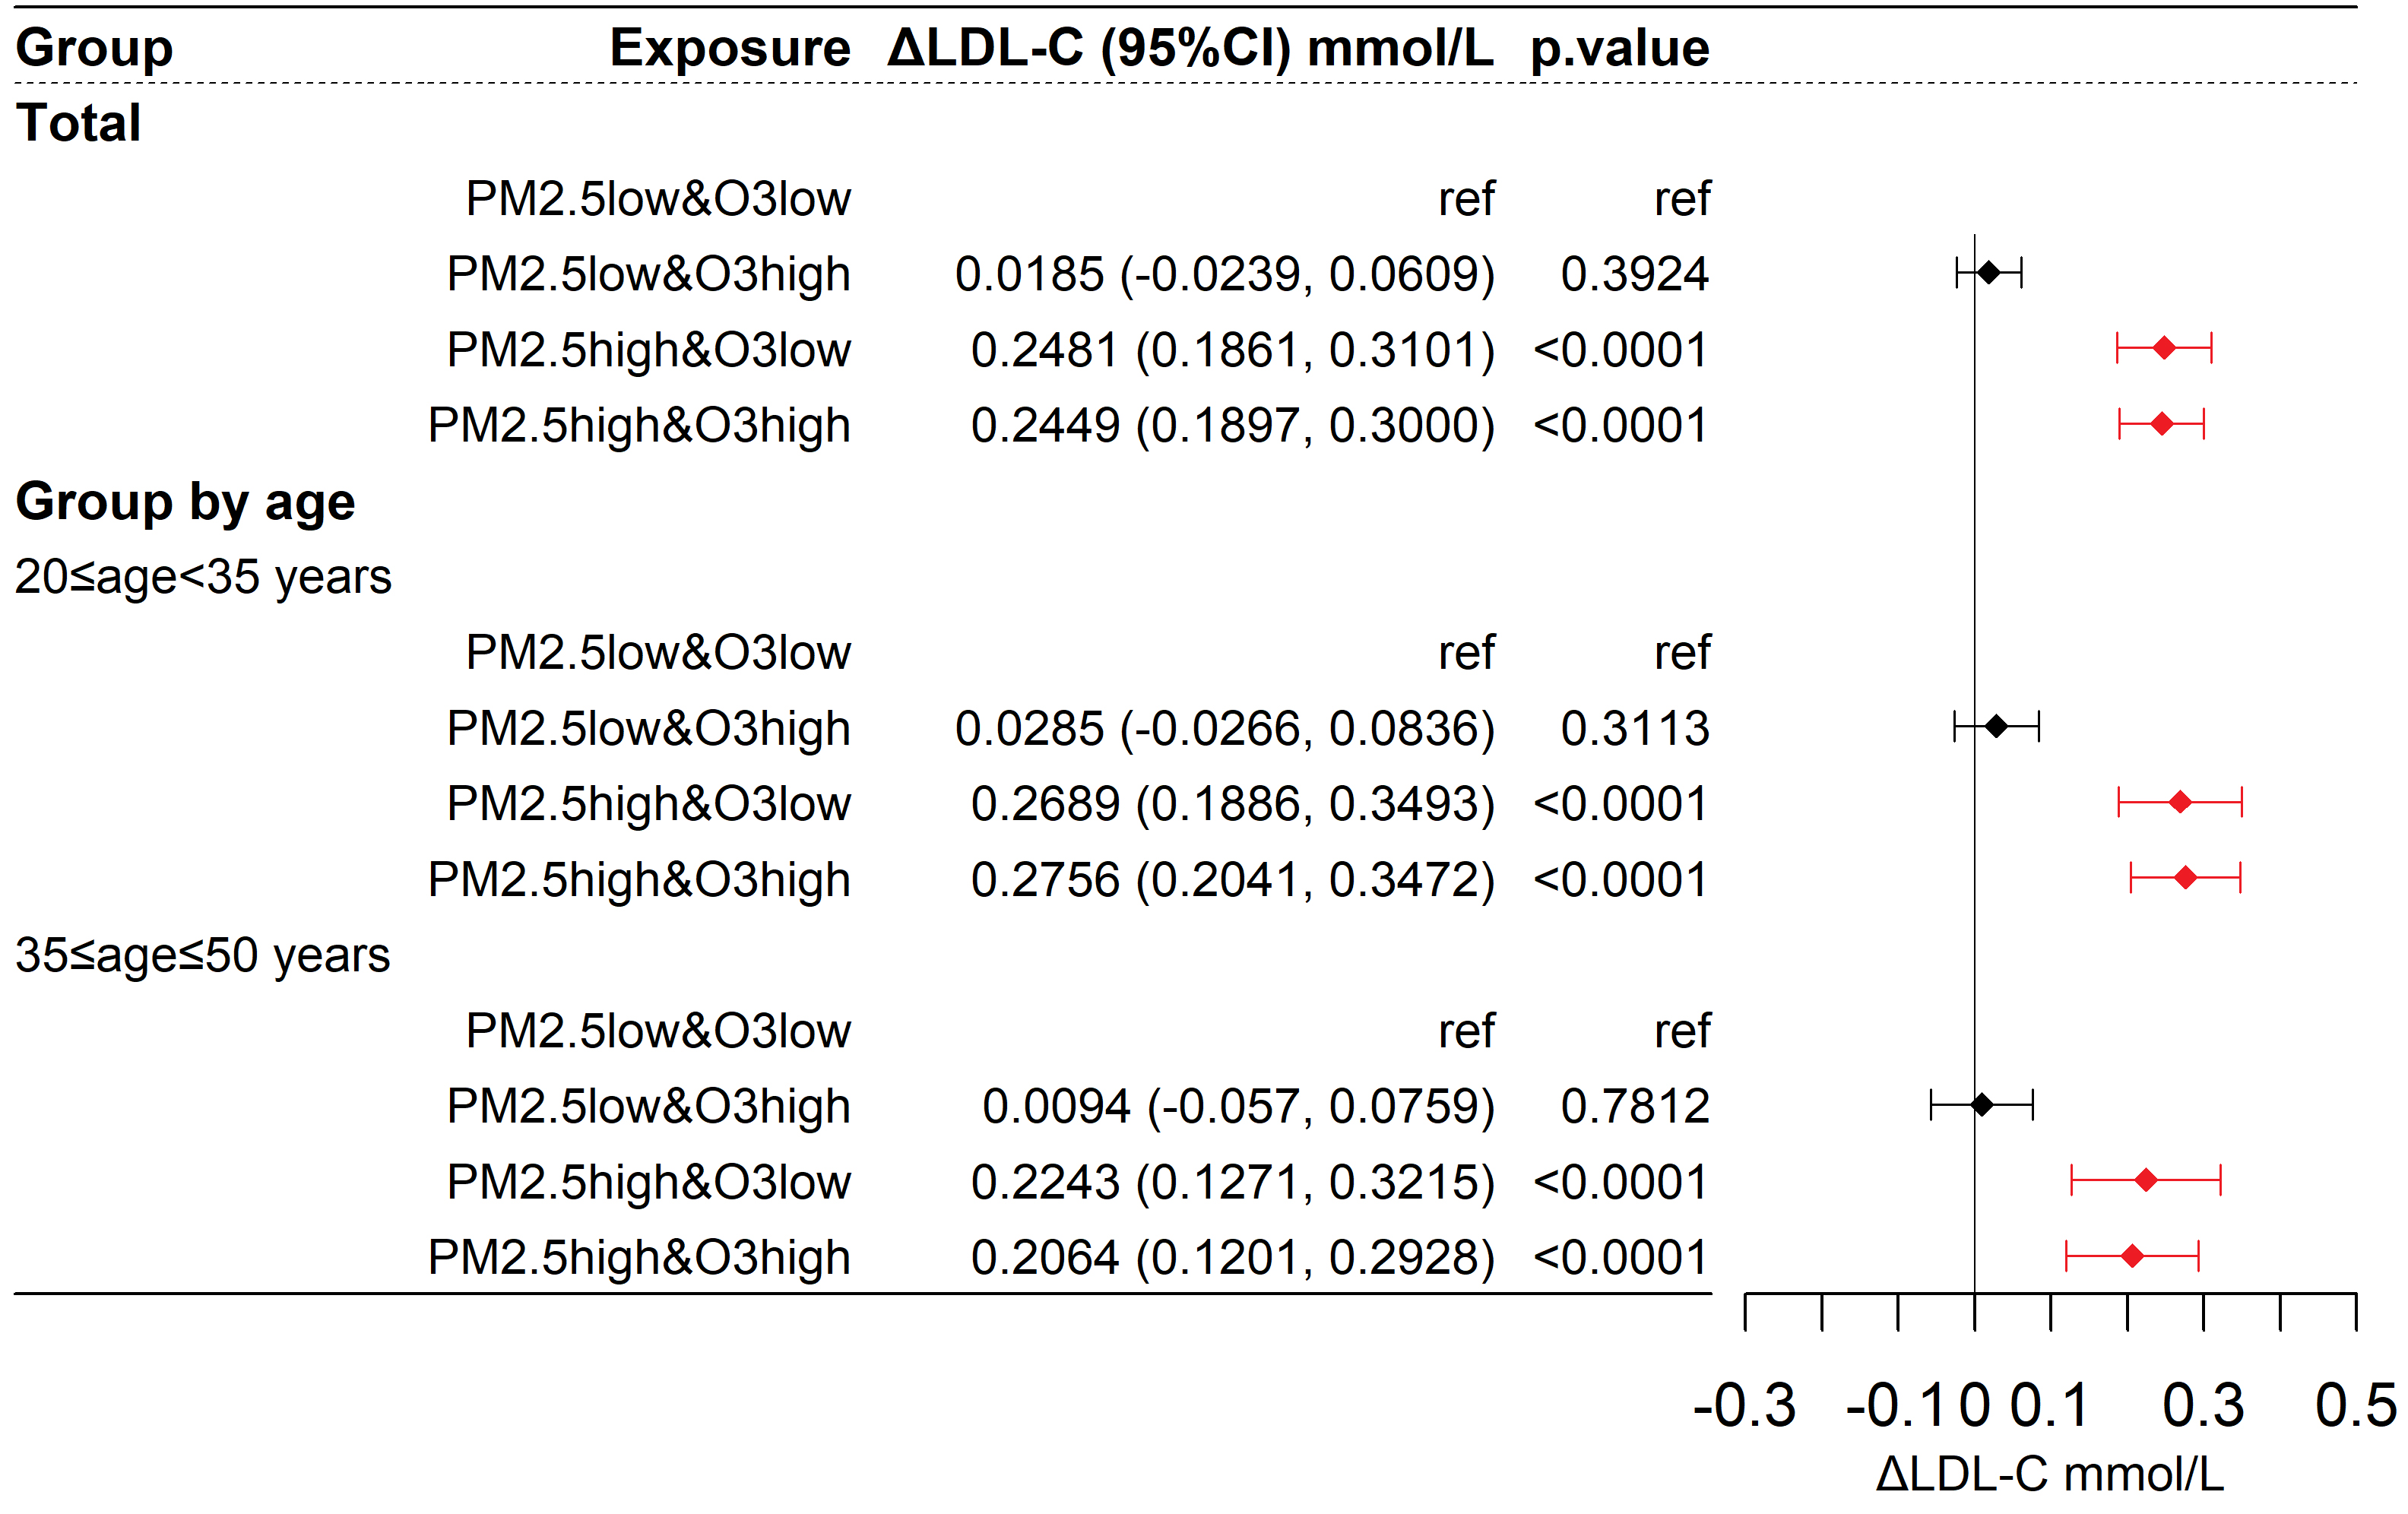
Figure 4. Differences in LDL-C among participants exposed to different combinations of PM2.5 and O3. ΔLDL-C represents the change in LDL-C compared to the control group. The model is as described in the methods section: LDL-C =Group + s(Age) + Season + Year + s(T) + s(RH) + s(FBG) + s(CK-MB) + s(CK) + s(ALT) + s(AST) + s(γ-GT) + s(Cr) + s(Urea). LDL-C: Low-density lipoprotein cholesterol; PM: particulate matter; O3: ozone; T: temperature; RH: relative humidity; FBG: fasting blood glucose; CK-MB: creatine kinase-MB; CK: creatine kinase; ALT: alanine aminotransferase; AST: aspartate aminotransferase; γ-GT: γ-glutamyl transferase; Cr: creatinine; Urea: blood urea nitrogen.
Figure 3B displays the proportion of participants with abnormal LDL-C levels (LDL-C ≥ 4.1 mmol/L) in each exposure group. The results showed that the proportion of participants with abnormal LDL-C in the low PM2.5 & low O3 group was 6.1%; in the low PM2.5 & high O3 group, it was 6.4%; in the high PM2.5 & low O3 group, it was 11.1%; and in the high PM2.5 & high O3 group, it was 12.2%.
Taking abnormal LDL-C (LDL-C ≥ 4.1 mmol/L) as the outcome, as shown in Figure 5, the corresponding OR values for the low PM2.5 & high O3, high PM2.5 & low O3, and high PM2.5 & high O3 groups compared to the reference group were 1.112 (95% CI: 0.871, 1.426, P > 0.05), 1.963 (95% CI: 1.426, 2.711, P < 0.001), and 1.935 (95% CI: 1.478, 2.537, P < 0.001), respectively. The synergy index (S) was 0.887 (95% CI: 0.580, 1.340; P > 0.05), with the 95% confidence interval including 1, indicating that the interaction between O3 and PM2.5 was not statistically significant. Similar results were observed in different age subgroups. Therefore, an increase in PM2.5 was associated with an increased risk of LDL-C abnormalities, and the interactive effect of PM2.5 and O3 on the risk of LDL-C abnormalities was not statistically significant.
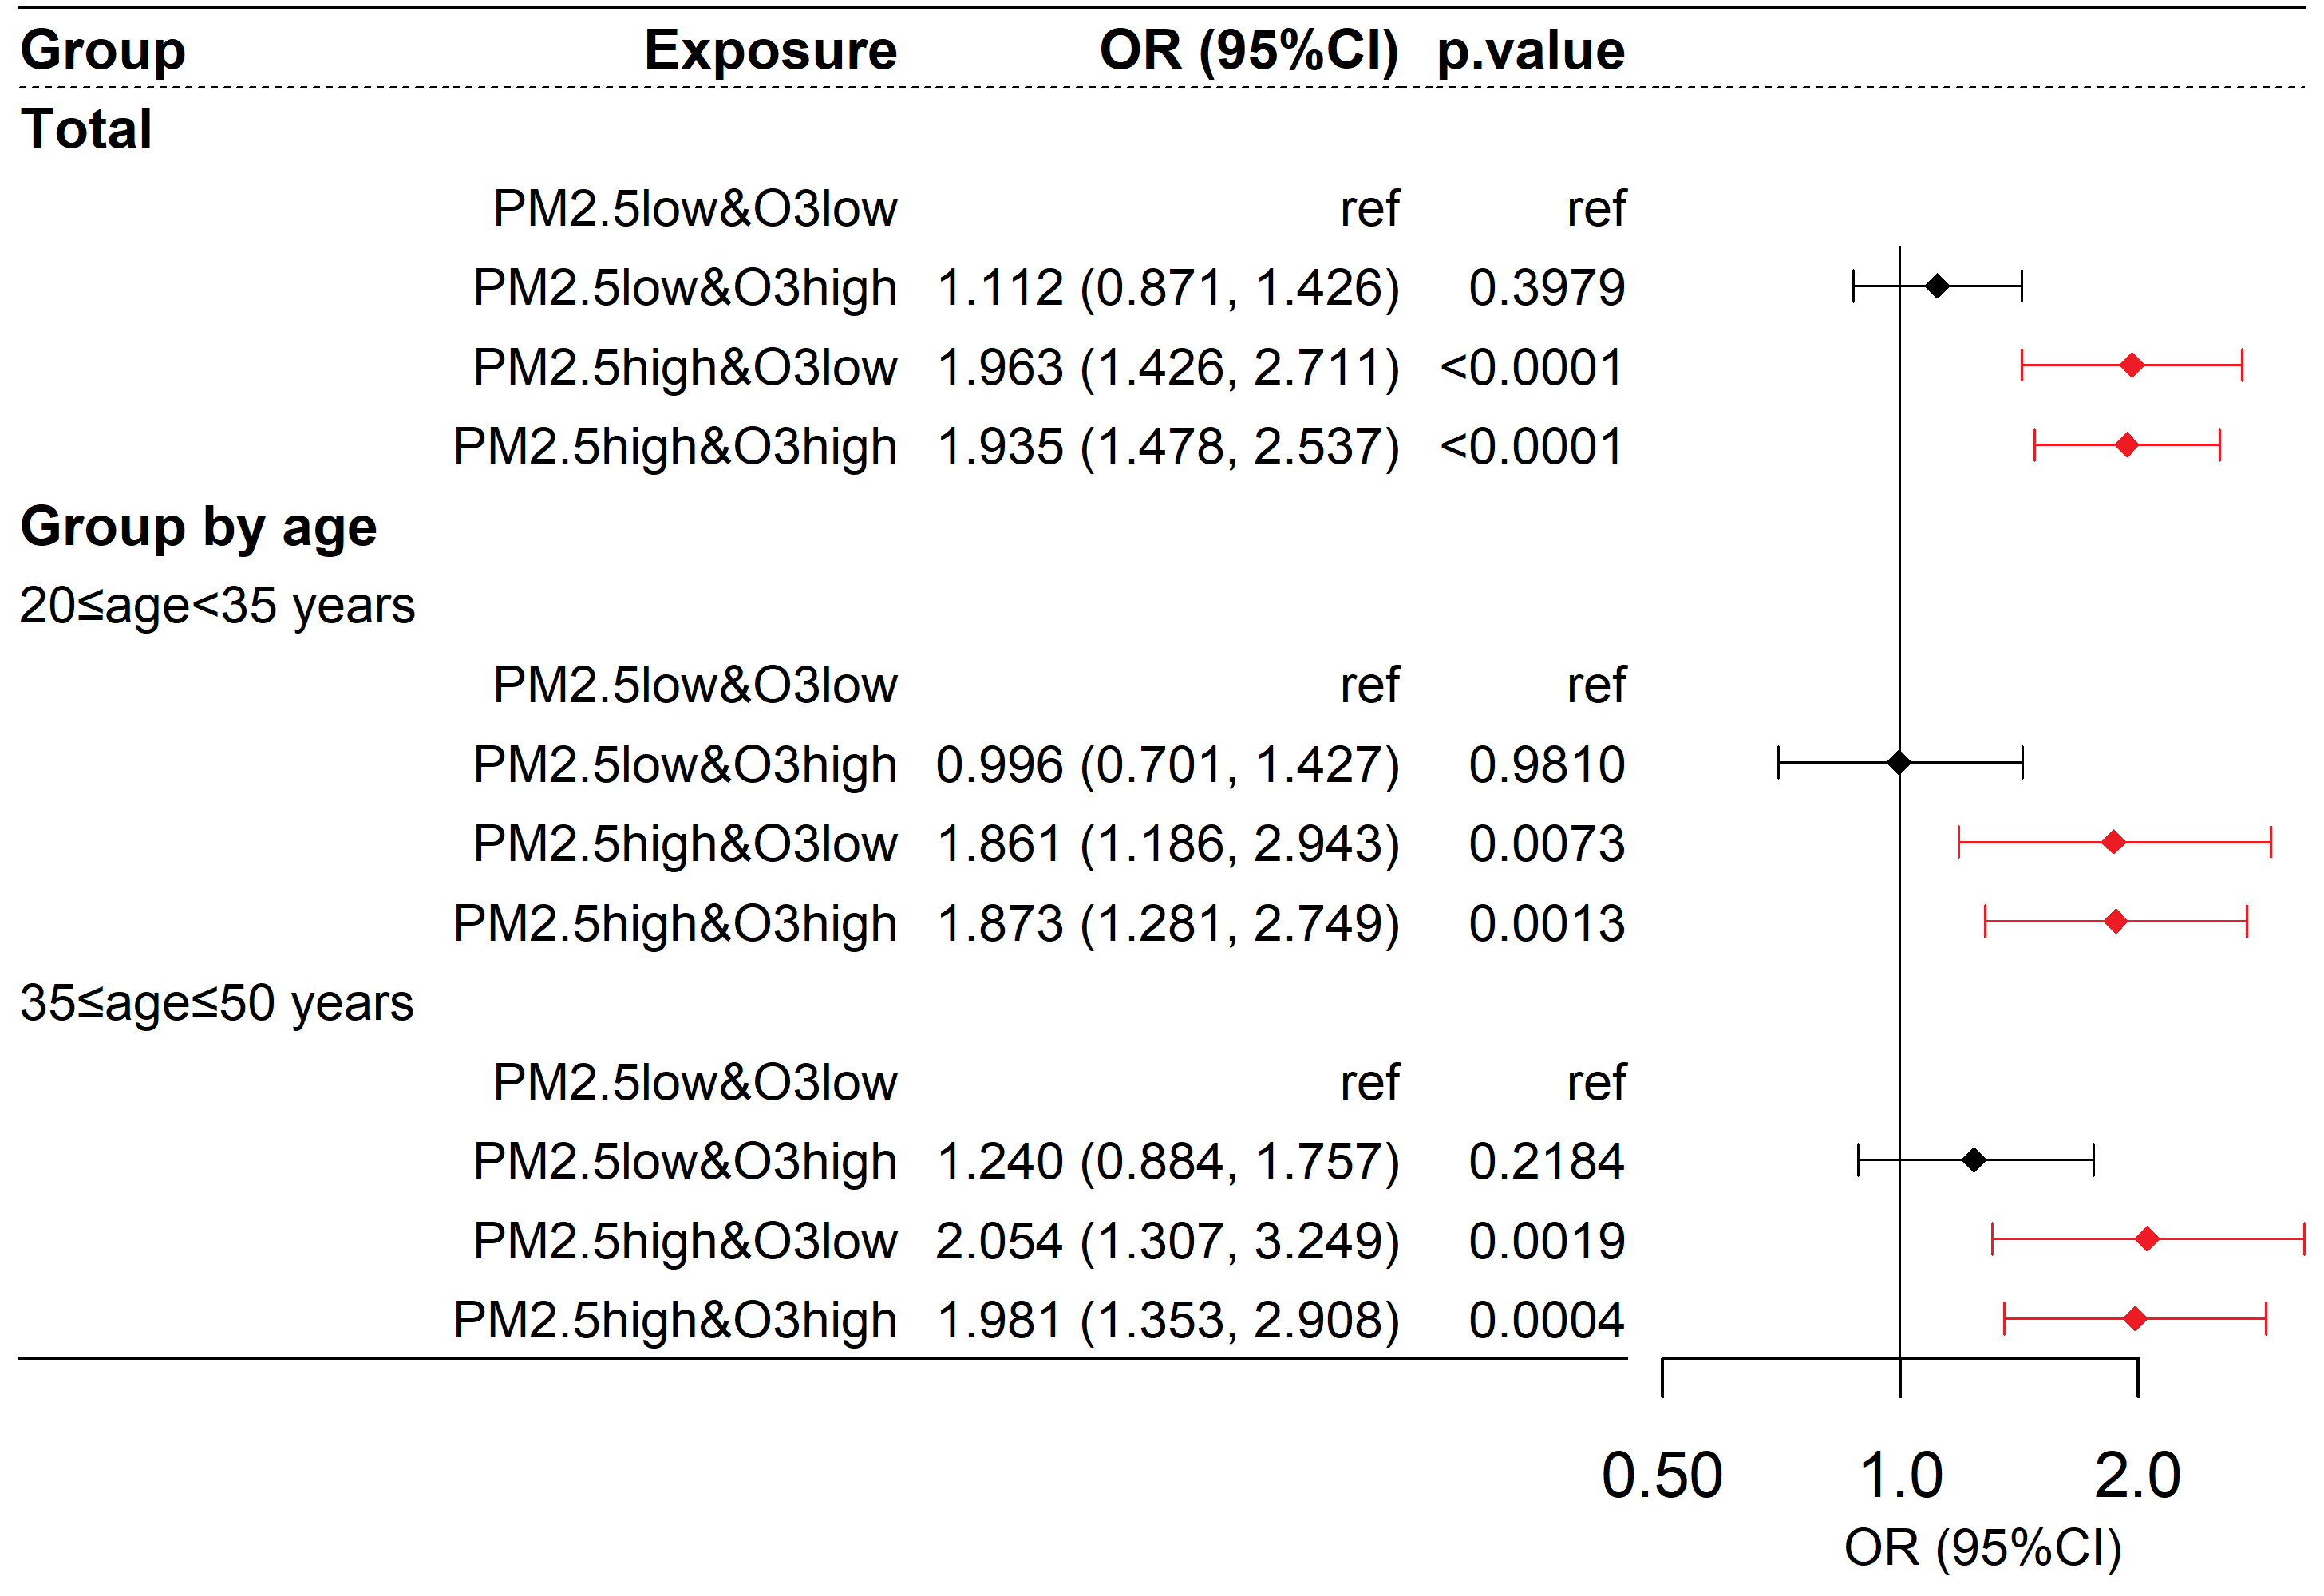
Figure 5. Risk of abnormal LDL-C among participants exposed to different combinations of PM2.5 and O3. Abnormal LDL-C is defined as LDL-C ≥ 4.1 mmol/L; the OR value represents the relative risk of participants being abnormal in LDL-C compared to the control group for each group. The model is as described in the methods section: logit(P) =
Sensitivity analysis showed robust results [Supplementary Figures 4 and 5], with significantly elevated LDL-C levels in the high PM2.5 & low O3 and high PM2.5 & high O3 groups compared to the low PM2.5 & low O3 group. When taking LDL-C abnormalities as the outcome, the risk was consistently and significantly elevated in both high PM2.5 groups - regardless of O3 level - compared to the low PM2.5 & low O3 group. Most sensitivity analyses showed no significant synergistic effect between PM2.5 and O3.
In summary, the primary outcomes and sensitivity analysis supported that high exposure to PM2.5 was associated with an increased risk of LDL-C abnormalities, and the effects of PM2.5 and O3 on the risk of LDL-C abnormalities did not exhibit a synergistic action.
Discussion of population results
This finding aligns with previous research, indicating a relationship between PM2.5 and increased LDL-C levels. A repeated measurement study in Shijiazhuang demonstrated that for every 10 μg/m3 increase in PM2.5 concentration, LDL-C levels rose by 0.63%[23]. Mao et al.’s research indicated that long-term exposure to PM2.5 would result in a 6.3% increase in LDL-C[24]. A meta-analysis in 2023 further confirmed that long-term exposure to a 10 μg/m3 increase in PM2.5 concentration would lead to a 1.44% increase in LDL-C concentration[25]. This suggests that urban air pollution control is crucial for the lipid health of residents. A recent meta-analysis indicates that LDL-C reductions of < 35 mg/dL (0.91 mmol/L), 35-65 mg/dL (0.91-1.68 mmol/L) and > 65 mg/dL (> 1.68 mmol/L) are associated with 2 %, 10 % and 30 % lower all-cause mortality, respectively, and with 6 %, 20 % and 34 % lower cardiovascular mortality[21]. In our study, the high PM2.5 & high O3 and high PM2.5 & low O3 groups exhibited LDL-C elevations of 0.2449 mmol/L and 0.2481 mmol/L relative to controls - changes that fall within the lowest risk-reduction stratum of the meta-analysis. Although the magnitude of lipid change attributable to air quality is smaller than that achieved by pharmacotherapy, the population reach of ambient pollution is vast, and its effects accumulate insidiously. Importantly, improving air quality offers a non-pharmacologic, side-effect-free means of improving lipid profiles that can benefit every urban resident.
There is controversy regarding the association between O3 and LDL-C. In a study by Zhang et al. on air pollution in the Shijiazhuang area, a dual-pollutant model of PM2.5 and O3 showed that for every 10 μg/m3 increase in PM2.5, LDL-C increased by 0.79%, while for every 10 μg/m3 increase in O3, LDL-C actually decreased by 0.45%[23]. However, Wang et al.’s research found that for every 10 μg/m3 increase in O3, LDL-C increased by 9.46%[26]. Due to the heterogeneity of study results, a meta-analysis failed to show a significant association between O3 and LDL-C[25]. The health effects of ozone may be concentration-dependent. Experimental evidence indicates that sub-chronic exposure to high ambient O3 concentrations can induce systemic metabolic dysregulation and impair insulin secretion[27]. Conversely, a large European cohort study reported no discernible cardiovascular or cerebrovascular harm associated with chronic, low-level O3 exposure[28]. Collectively, these findings suggest that - unlike the apparent no-threshold relationship observed for PM2.5 - O3 toxicity may exhibit a threshold below which adverse effects are negligible.
Few studies have investigated the interactive effects of PM2.5 and O3 on LDL-C[29]. Liu et al.’s multicenter study indicated that there were differences in the interactive effects of PM2.5 and O3 in different regions, with low-latitude regions showing synergistic effects on cardiovascular disease mortality and high-latitude regions not showing any[16]. Beijing is situated at a high latitude, and LDL-C levels are closely associated with cardiovascular diseases. This study did not find a synergistic effect of PM2.5 and O3 on LDL-C in the Beijing area, which is consistent with the results of Liu et al.’s study in high-latitude areas[16]. However, previous studies have mostly focused on the short-term interactive effects of PM2.5 and O3 exposure, while this study focuses on long-term exposure, which may affect the comparability of the results[16]. More research is needed to clarify the interactive effects of long-term exposure to PM2.5 and O3, providing a scientific basis for policy regulation of the annual average values of PM2.5 and O3.
Animal experiments: potential pathways through which air pollution affects serum LDL-C levels
Exposure characteristics and animal characteristics
Under long-term combined exposure to PM2.5 and O3, the average concentration of PM2.5 in the cages of exposed SD rats was 36.72 μg/m3, and the average maximum 8-h value of O3 was 69.76 μg/m3 [Figure 6A]. The experimental PM2.5 concentrations closely matched the annual mean ambient levels recorded in Beijing, whereas the O3 exposure was slightly lower than the corresponding city-wide outdoor averages.
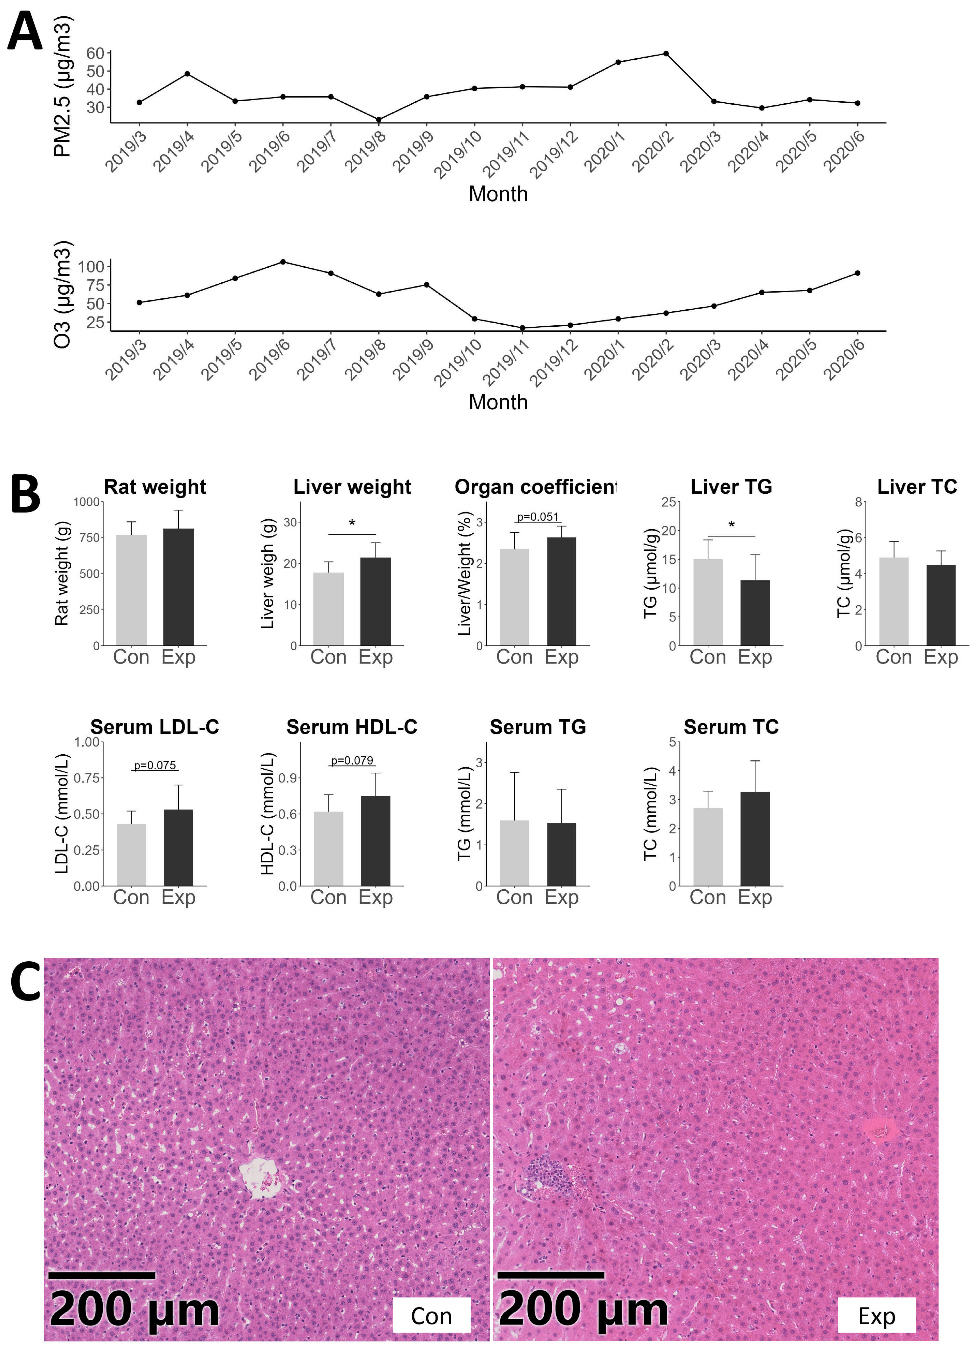
Figure 6. PM2.5 and O3 exposure characteristics of the exposure group and features and liver pathology of SD rats. (A) Exposure characteristics of PM2.5 and O3; (B) Characteristics of SD rats, including body weight, liver weight, liver organ coefficient, liver lipid content, serum LDL-C, HDL-C, TG, and TC concentrations. *P < 0.05; (C) H&E staining results of SD rat liver. PM: Particulate matter; O3: ozone; SD: Sprague-Dawley; LDL-C: low-density lipoprotein cholesterol; HDL-C: high-density lipoprotein cholesterol; TG: triglycerides; TC: total cholesterol; H&E: hematoxylin-eosin staining.
The rats in both the exposed and control groups showed normal feeding, drinking, and activity, with no abnormal signs. At the end of the breeding period, the average weight of the exposed rats was 812.83g (SD: 128.07), while the control group was 767.25g (SD: 92.3), with no significant difference [Figure 6B]. Compared with the control group, the exposure group exhibited increased absolute liver weight and a trend toward a higher liver organ coefficient (Figure 6B, P < 0.05 and P = 0.051). A previous study has shown that ambient air-pollution exposure can trigger hepatic oxidative stress and inflammation, accompanied by upregulation of apoptosis-related gene expression; these alterations may stimulate compensatory hepatocyte proliferation and hence increase liver mass[30]. The density of TG in the liver of the exposed rats significantly decreased (Figure 6B, P < 0.05). Consistent with this, Hu et al. reported a similar decline in hepatic TG content in middle-aged mice following air-pollution exposure[31]. This decrease in hepatic TG might reflect enhanced VLDL-C secretion, whereby a greater proportion of lipids was exported into the blood circulation.
There was a trend of increase in LDL-C and HDL-C in the serum (Figure 6B, P = 0.075 and P = 0.079). Pathological observations showed that the liver structure of both groups of rats was basically normal, but some livers in the exposed group had inflammatory cell infiltration in the central veins [Figure 6C]. The results that rats exposed to long-term PM2.5 and O3 had a trending increase in LDL-C levels in their serum were consistent with the results from human population studies. Previous research also indicated that individual exposures to PM2.5 and O3 can lead to increased LDL-C levels in experimental animals[32-34]. Concurrently, there was also a trending increase in HDL-C levels. Source and composition of air pollutants may influence the magnitude and direction of health effects[35]. The pollutants in Yin et al.’s study were diesel exhaust fumes[34], whereas the exposure setup in this study was near a traffic pollution source. Therefore, both our study and that of Yin et al. found an increase in HDL-C levels[34]. Additionally, this study found that after exposure to PM2.5 and O3, the weight of the rat livers increased and the density of liver TG decreased. This is in contrast to the results from Xu et al. and Ge et al.’s studies on PM2.5-exposed mice[33,36], with possible reasons including species differences and the impact of O3 exposure.
LDL-C uptake function of rat liver
LDLR and PCSK9 are the two principal hepatic proteins absorbing the extraction of LDL-C from the blood circulation, thereby maintaining systemic lipid homeostasis[37,38]. This receptor-mediated clearance pathway is conserved between rats and humans. Targeted pharmacotherapies directed at LDLR and PCSK9 are already in clinical use to lower LDL-C levels in hyperlipidaemic patients[39]. A reduction in LDLR quantity leads to a decrease in the liver's ability to absorb LDL-C. PCSK9 reduces the quantity of LDLR by promoting its degradation, thereby decreasing the liver's ability to absorb LDL-C, and clinically, the rate at which the liver clears plasma LDL-C is often used as an indicator of PCSK9 activity [40]. SREBP1c is a transcription factor for LDLR.
In our study, RT-qPCR results showed that the expression of LDLR in the exposed rats decreased, while the expression of PCSK9 increased, with no change in SREBP1c [Figure 7A]. Immunohistochemical staining confirmed the mRNA results, with a significant increase in PCSK9 protein expression and a decrease in LDLR expression in the liver of exposed rats, but without statistical significance [Figure 7B and C]. Overall, these changes indicated impaired LDL-C uptake by the liver. LDLR and PCSK9 are also key targets for clinical lipid-lowering drugs. These findings not only suggest that the impact of air pollution on LDL-C levels is amenable to pharmacological intervention but also imply that air pollution may disrupt the effectiveness of lipid-lowering drugs.
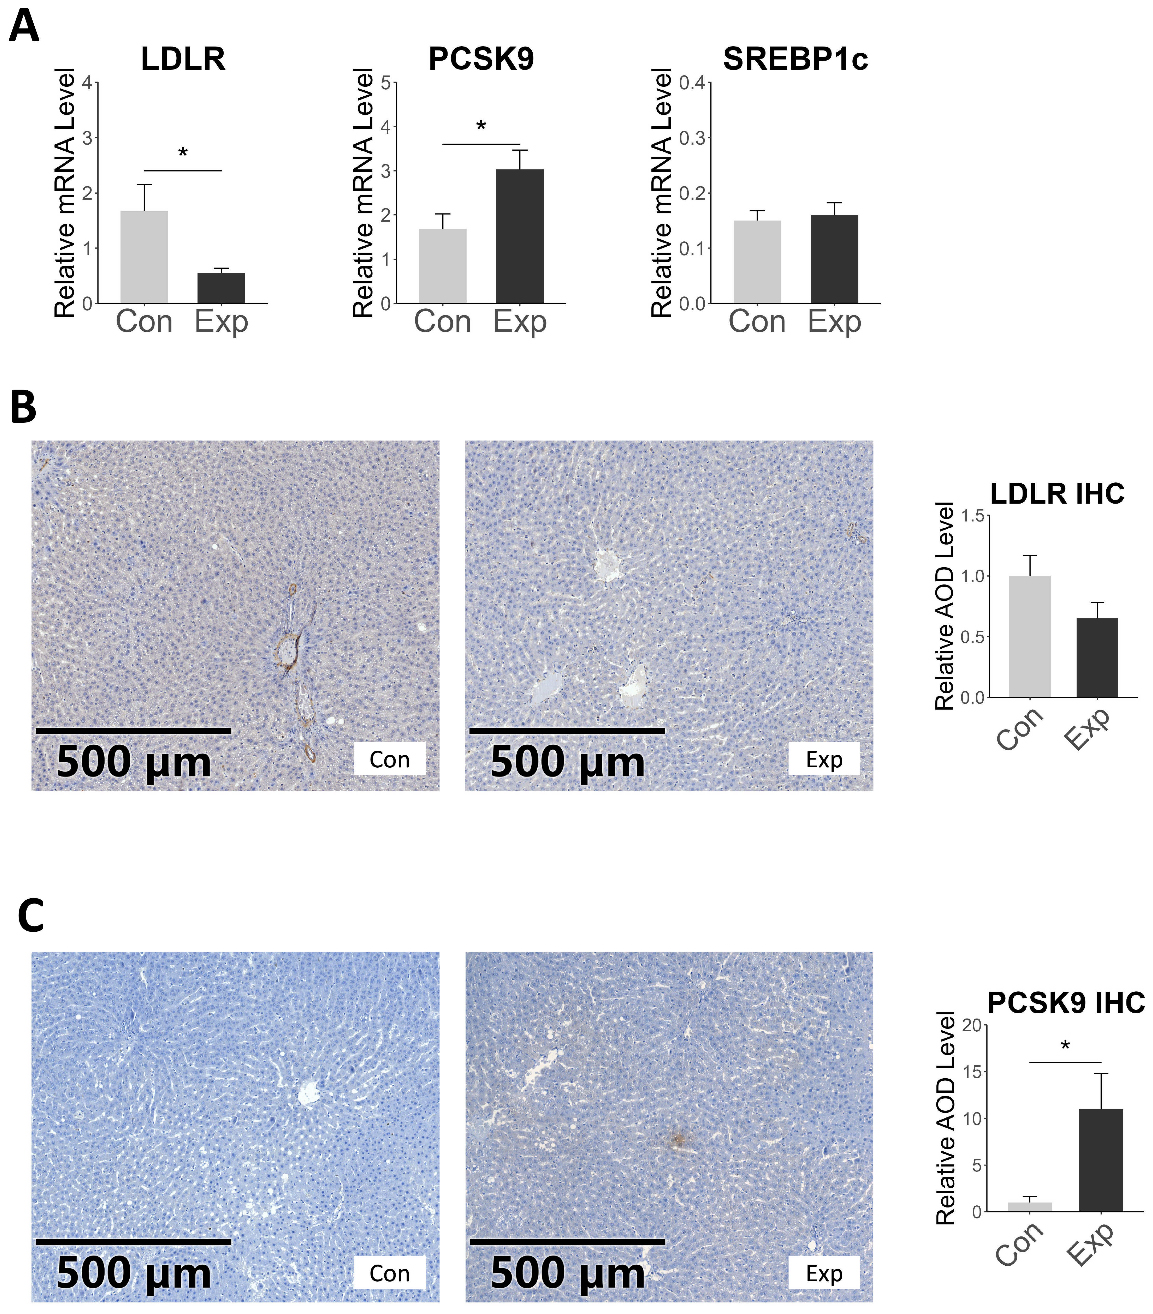
Figure 7. mRNA and protein expression levels of LDL-C uptake-related genes in rat liver. (A) represents the mRNA expression levels of the target genes, with the vertical axis showing the relative mRNA expression of the target genes normalized to the internal reference gene β-actin; (B and C) show the immunohistochemical staining results and statistical comparison for the target proteins LDLR and PCSK9, respectively; *P < 0.05. LDLR: Low-density lipoprotein receptor; LDL-C: low-density lipoprotein cholesterol; PCSK9: proprotein convertase subtilisin/kexin type 9.
VLDL-C secretion function of rat liver
ApoB-100 is the main constituent protein of VLDL and LDL, generated by the expression of the APOB gene[1,41]. MTTP is another key protein responsible for transferring triglycerides to ApoB-100 and is closely related to the rate of VLDL-C production[1,42]. In our study, RT-qPCR showed no significant difference in the gene expression of APOB and MTTP in the liver of exposed rats compared to the control group. We also examined other proteins that affect VLDL-C secretion, such as ADRP, CideB, PGC-1α, SHP, etc. ADRP transfers fatty acids from the VLDL assembly pathway to the cytoplasmic triglyceride synthesis pathway, inhibiting VLDL formation[43]. CideB is a protein necessary for VLDL secretion[44], PGC-1α promotes VLDL secretion[45], and SHP affects VLDL production by regulating MTTP[46]. In our study, their expression also showed no significant difference between the two groups, with only a trend of decrease in Cideb expression [Figure 8A]. The results indicated that the increase in serum LDL-C may not be due to increased expression of APOB and MTTP.
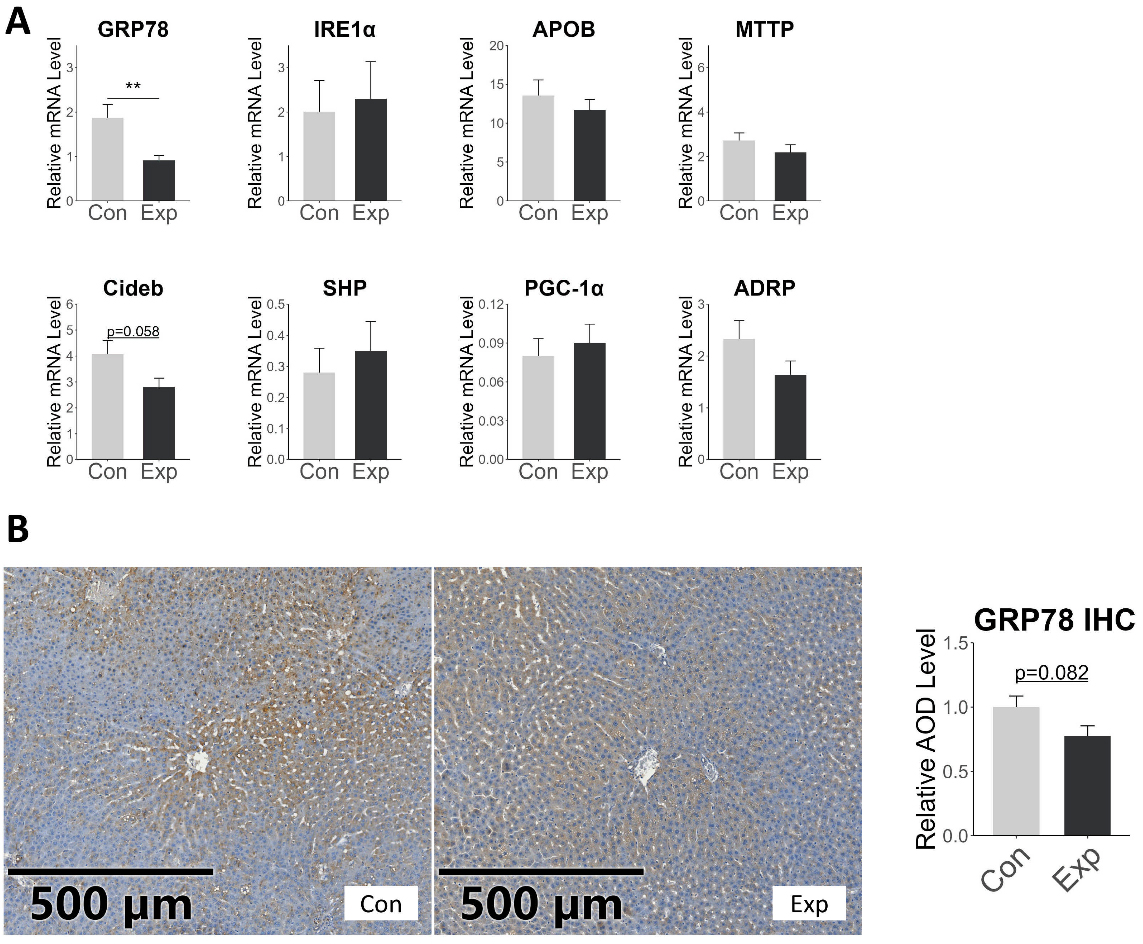
Figure 8. mRNA and protein expression of VLDL-C secretion-related proteins in rat liver. (A) illustrates the relative expression levels of VLDL-C secretion-related genes, with the vertical axis representing the relative expression quantity normalized to the internal reference gene β-actin; (B) presents the immunohistochemical staining results and statistical outcomes for GRP-78; error bars represent the SE. *P < 0.05; **P < 0.01. SE: Standard error.
The endoplasmic reticulum (ER) plays a central role in the synthesis and secretion of VLDL-C in the liver, and its homeostasis is essential for the assembly and secretion of VLDL[47,48]. Previous studies have suggested that short-term PM exposure may activate ER stress through the generation of oxidative damage[49]. However, Stachyra et al. found that long-term PM exposure was associated with reduced levels of ER stress-related proteins, indicating potential ER stress dysfunction[50]. In our study, RT-qPCR detected a decrease in GRP78 expression in the exposed rats [Figure 8A]. Immunohistochemical results indicated a trend toward decreased GRP78 protein levels (Figure 8B, P = 0.082). GRP78 is a heat shock protein that plays an important role in activating the unfolded protein response (UPR) and maintaining endoplasmic reticulum homeostasis[51]. The decreased expression of GRP78 suggested ER stress disorder, which was consistent with the study of Stachyra et al.[50] ER stress can attenuate the biosynthesis of ApoB-100, thereby exerting a protective effect on blood lipid. Qiu et al. demonstrated that high-dose glucosamine upregulated GRP78, thereby activating the PERK-eIF2α pathway; this suppressed hepatic ApoB-100 translation and accelerated its proteasomal degradation, resulting in markedly reduced VLDL secretion[52]. GRP78-triggered ER stress can also attenuate apoB100 secretion via the IRE1-XBP1 axis[53]. Additionally, prior studies have reported that lipid-induced ER stress does not alter APOB or MTTP mRNA levels[52,53], aligning with our results. Collectively, elevated GRP78 expression appears to constitute a lipid-lowering mechanism; conversely, the observed reduction in GRP78 in our study may indicate that air pollutants blunt this protective pathway, thereby contributing to dyslipidaemia.
In summary, after long-term co-exposure to PM2.5 and O3, the ability of the liver to absorb LDL-C is inhibited, and the decreased expression of GRP78 may be the main reason for the increase in serum LDL-C levels.
Strengths and limitations
The strengths of this study are as follows: (1) This study investigated the effects of combined PM2.5 and O3 exposure on LDL-C in both humans and animals, providing a more comprehensive simulation of atmospheric pollutant exposure compared to single-pollutant studies; (2) The sources of air pollution were all from Beijing, and the exposure doses and methods were similar between the observational study and animal experiments; (3) Under the same exposure system, this study provides ecological evidence that reducing urban PM2.5 levels can improve population LDL-C levels, as well as insights into the mechanisms by which air pollution affects LDL-C in rats.
The limitations of this study include: (1) The study population was drawn from relatively healthy male examinees. The current study’s findings are limited with respect to female representation and, consequently, the elucidation of potential sex-specific susceptibility. Caution is needed when extrapolating the results to different genders and populations; (2) Due to privacy concerns, the addresses of human participants in the study were only specified to the level of city and district, resulting in less precise exposure assessment in the epidemiological research. These may lead to non-differential misclassification, making the results biased toward the null hypothesis; (3) Data on dietary intake, health behaviors, and personal healthcare expenditure were not collected, and these unmeasured variables may introduce residual confounding; (4) This study used male Sprague-Dawley rats for mechanistic exploration, and the extrapolation of results to humans is uncertain.
CONCLUSIONS
Our epidemiological study showed that long-term exposure to PM2.5 was primarily associated with increased levels of LDL-C and elevated risk of LDL-C abnormality. The synergistic effect between PM2.5 and O3 was not significant. Our mechanistic study through animal experiments demonstrated that long-term exposure to air pollution suppressed the liver's ability to absorb LDL-C and inhibited the expression of GRP78, which may be one of the mechanisms leading to increased serum LDL-C levels.
DECLARATIONS
Authors’ contributions
Conceptualization, and Writing-original draft: Zhang, Y.
Conceptualization, and Writing-review & editing: Chen, Z.
Data acquisition, administrative, technical, and material support: Xu, J.; Shi, J.; Ma, Y.; Yu, N.; Zhou, X.; Li, X.; Wang, T.; Jia, G.
Availability of data and materials
The data underlying this article were provided by the Department of Laboratory Medicine, Peking University Third Hospital, with permission. Data will be shared upon reasonable request to the corresponding author with permission of the Department of Laboratory Medicine, Peking University Third Hospital.
Financial support and sponsorship
This work was supported by the National Natural Science Foundation of China (Project Nos. 91743114 and 81673118).
Conflicts of interest
Zhangjian Chen is a Young Editorial Board member of Journal of Environmental Exposure Assessment. Zhangjian Chen was not involved in any steps of editorial processing, notably including reviewer selection, manuscript handling, or decision making. The other authors declared that there are no conflicts of interest.
Ethical approval and consent to participate
The epidemiological study was approved by the Peking University Third Hospital Medical Science Research Ethics Committee (Reference Number: IRB00006761-M2021197), and all participants provided written informed consent before joining. The principle of the Helsinki Declaration for using human subjects was obeyed. Written informed consent was obtained from all participants prior to enrollment. The animal experimentation protocol was approved by the Biomedical Ethics Committee of Peking University (Approval No.: LA2017263).
Consent for publication
Not applicable.
Copyright
© The Author(s) 2025.
Supplementary Materials
REFERENCES
1. Mehta, A.; Shapiro, M. D. Apolipoproteins in vascular biology and atherosclerotic disease. Nat. Rev. Cardiol. 2022, 19, 168-79.
2. 2021 Risk Factors Collaborators. Global burden and strength of evidence for 88 risk factors in 204 countries and 811 subnational locations, 1990-2021: a systematic analysis for the global burden of disease study 2021. Lancet 2024, 403, 2162-203.
3. Kaufman, J. D.; Elkind, M. S. V.; Bhatnagar, A.; et al.; American Heart Association Advocacy Coordinating Committee. Guidance to reduce the cardiovascular burden of ambient air pollutants: a policy statement from the American heart association. Circulation 2020, 142, e432-47.
4. Niu, Y.; Zhou, Y.; Chen, R.; et al. Long-term exposure to ozone and cardiovascular = mortality in China: a nationwide cohort study. Lancet. Planet. Health. 2022, 6, e496-503.
5. Shearston, J. A.; Rowland, S. T.; Butt, T.; et al. Can traffic-related air pollution trigger myocardial infarction within a few hours of exposure? Environ. Int. 2023, 178, 108086.
6. Ma, Y.; Li, D.; Cui, F.; et al. Exposure to air pollutants and myocardial infarction incidence: a UK biobank study exploring gene-environment interaction. Environ. Health. Perspect. 2024, 132, 107002.
7. Kaufman, J. D.; Adar, S. D.; Barr, R. G.; et al. Association between air pollution and coronary artery calcification within six metropolitan areas in the USA (the multi-ethnic study of atherosclerosis and air pollution): a longitudinal cohort study. Lancet 2016, 388, 696-704.
8. Yang, B. Y.; Guo, Y.; Markevych, I.; et al. Association of long-term exposure to ambient air pollutants with risk factors for cardiovascular disease in China. JAMA. Netw. Open. 2019, 2, e190318.
9. Anand, K.; Walia, G. K.; Mandal, S.; et al. Longitudinal associations between ambient PM2.5 exposure and lipid levels in two Indian cities. Environ. Epidemiol. 2024, 8, e295.
10. Guo, F.; Habre, R.; Xu, Y.; et al. Impact of childhood exposure to traffic related air pollution on adult cardiometabolic health: exploring the role of perceived stress. Environ. Res. 2024, 263, 120130.
11. Valdés, S.; Doulatram-Gamgaram, V.; Maldonado-Araque, C.; et al. Association between exposure to air pollution and blood lipids in the general population of Spain. Eur. J. Clin. Invest. 2024, 54, e14101.
12. Escher, B. I.; Stapleton, H. M.; Schymanski, E. L. Tracking complex mixtures of chemicals in our changing environment. Science 2020, 367, 388-92.
13. Gangwar, R. S.; Bevan, G. H.; Palanivel, R.; Das, L.; Rajagopalan, S. Oxidative stress pathways of air pollution mediated toxicity: recent insights. Redox. Biol. 2020, 34, 101545.
14. Waschek, J. A. VIP and PACAP: neuropeptide modulators of CNS inflammation, injury, and repair. Br. J. Pharmacol. 2013, 169, 512-23.
15. Haberzettl, P.; O‘Toole, T. E.; Bhatnagar, A.; Conklin, D. J. Exposure to fine particulate air pollution causes vascular insulin resistance by inducing pulmonary oxidative stress. Environ. Health. Perspect. 2016, 124, 1830-9.
16. Liu, C.; Chen, R.; Sera, F.; et al. Interactive effects of ambient fine particulate matter and ozone on daily mortality in 372 cities: two stage time series analysis. BMJ 2023, 383, e075203.
17. Palmisano, B. T.; Zhu, L.; Stafford, J. M. Role of estrogens in the regulation of liver lipid metabolism. Adv. Exp. Med. Biol. 2017, 1043, 227-56.
18. Knol, M. J.; VanderWeele, T. J.; Groenwold, R. H.; Klungel, O. H.; Rovers, M. M.; Grobbee, D. E. Estimating measures of interaction on an additive scale for preventive exposures. Eur. J. Epidemiol. 2011, 26, 433-8.
19. Yan, T.; Wang, W.; Xia, J.; et al. Exposure to the real ambient air pollutants alters the composition of nasal mucosa bacteria in the rat model. Chemosphere 2022, 287, 132269.
20. Borén, J.; Chapman, M. J.; Krauss, R. M.; et al. Low-density lipoproteins cause atherosclerotic cardiovascular disease: pathophysiological, genetic, and therapeutic insights: a consensus statement from the European Atherosclerosis Society Consensus Panel. Eur. Heart. J. 2020, 41, 2313-30.
21. Navarese, E. P.; Robinson, J. G.; Kowalewski, M.; et al. Association between baseline LDL-C level and total and cardiovascular mortality after LDL-C lowering: a systematic review and meta-analysis. JAMA 2018, 319, 1566-79.
22. Chen, L.; Chen, S.; Bai, X.; et al. Low-density lipoprotein cholesterol, cardiovascular disease risk, and mortality in china. JAMA. Netw. Open. 2024, 7, e2422558.
23. Zhang, K.; Wang, H.; He, W.; et al. The association between ambient air pollution and blood lipids: a longitudinal study in Shijiazhuang, China. Sci. Total. Environ. 2021, 752, 141648.
24. Mao, S.; Chen, G.; Liu, F.; et al. Long-term effects of ambient air pollutants to blood lipids and dyslipidemias in a Chinese rural population. Environ. Pollut. 2020, 256, 113403.
25. Wang, C.; Meng, X. C.; Huang, C.; et al. association between ambient air pollutants and lipid profile: a systematic review and meta-analysis. Ecotoxicol. Environ. Saf. 2023, 262, 115140.
26. Wang, L.; Chen, G.; Pan, Y.; et al.; China Multi-Ethnic Cohort (CMEC) collaborative group. Association of long-term exposure to ambient air pollutants with blood lipids in Chinese adults: the China multi-ethnic cohort study. Environ. Res. 2021, 197, 111174.
27. Miller, D. B.; Snow, S. J.; Henriquez, A.; et al. Systemic metabolic derangement, pulmonary effects, and insulin insufficiency following subchronic ozone exposure in rats. Toxicol. Appl. Pharmacol. 2016, 306, 47-57.
28. Wolf, K.; Hoffmann, B.; Andersen, Z. J.; et al. Long-term exposure to low-level ambient air pollution and incidence of stroke and coronary heart disease: a pooled analysis of six European cohorts within the ELAPSE project. Lancet. Planet. Health. 2021, 5, e620-32.
29. Zhang, Y.; Shi, J.; Ma, Y.; et al. Association between Air Pollution and Lipid Profiles. Toxics 2023, 11, 894.
30. Sepehri, B.; Darbani, R.; Mesgari-Abbasi, M.; et al. The effects of short-time air pollution, SO2, and ozone on biochemical, histo-pathological, oxidative stress, and carcinogenesis related genes expressions in the liver of the rats. Hum. Exp. Toxicol. 2024, 43, 9603271241263569.
31. Hu, R.; Zhang, L.; Qin, L.; et al. Airborne PM2.5 pollution: a double-edged sword modulating hepatic lipid metabolism in middle-aged male mice. Environ. Pollut. 2023, 324, 121347.
32. Zheng, Z.; Xu, X.; Zhang, X.; et al. Exposure to ambient particulate matter induces a NASH-like phenotype and impairs hepatic glucose metabolism in an animal model. J. Hepatol. 2013, 58, 148-54.
33. Xu, M. X.; Ge, C. X.; Qin, Y. T.; et al. Prolonged PM2.5 exposure elevates risk of oxidative stress-driven nonalcoholic fatty liver disease by triggering increase of dyslipidemia. Free. Radic. Biol. Med. 2019, 130, 542-56.
34. Yin, F.; Gupta, R.; Vergnes, L.; et al. Diesel exhaust induces mitochondrial dysfunction, hyperlipidemia, and liver steatosis. Arterioscler. Thromb. Vasc. Biol. 2019, 39, 1776-86.
35. He, Z. Z.; Guo, P. Y.; Xu, S. L.; et al. Associations of particulate matter sizes and chemical constituents with blood lipids: a panel study in Guangzhou, China. Environ. Sci. Technol. 2021, 55, 5065-75.
36. Ge, C. X.; Qin, Y. T.; Lou, D. S.; et al. iRhom2 deficiency relieves TNF-α associated hepatic dyslipidemia in long-term PM2.5-exposed mice. Biochem. Biophys. Res. Commun. 2017, 493, 1402-9.
37. Zelcer, N.; Hong, C.; Boyadjian, R.; Tontonoz, P. LXR regulates cholesterol uptake through Idol-dependent ubiquitination of the LDL receptor. Science 2009, 325, 100-4.
38. de Sluis B, Wijers M, Herz J. News on the molecular regulation and function of hepatic low-density lipoprotein receptor and LDLR-related protein 1. Curr. Opin. Lipidol. 2017, 28, 241-7.
39. Sabatine, M. S. PCSK9 inhibitors: clinical evidence and implementation. Nat. Rev. Cardiol. 2019, 16, 155-65.
40. Lagace, T. A. PCSK9 and LDLR degradation: regulatory mechanisms in circulation and in cells. Curr. Opin. Lipidol. 2014, 25, 387-93.
41. Sniderman, A. D.; Thanassoulis, G.; Glavinovic, T.; et al. Apolipoprotein B particles and cardiovascular disease: a narrative review. JAMA. Cardiol. 2019, 4, 1287-95.
42. Chen, Z.; Newberry, E. P.; Norris, J. Y.; et al. ApoB100 is required for increased VLDL-triglyceride secretion by microsomal triglyceride transfer protein in ob/ob mice. J. Lipid. Res. 2008, 49, 2013-22.
43. Magnusson, B.; Asp, L.; Boström, P.; et al. Adipocyte differentiation-related protein promotes fatty acid storage in cytosolic triglycerides and inhibits secretion of very low-density lipoproteins. Arterioscler. Thromb. Vasc. Biol. 2006, 26, 1566-71.
44. Tiwari, S.; Siddiqi, S.; Siddiqi, S. A. CideB protein is required for the biogenesis of very low density lipoprotein (VLDL) transport vesicle. J. Biol. Chem. 2013, 288, 5157-65.
45. Chen, Z.; Norris, J. Y.; Finck, B. N. Peroxisome proliferator-activated receptor-gamma coactivator-1alpha (PGC-1alpha) stimulates VLDL assembly through activation of cell death-inducing DFFA-like effector B (CideB). J. Biol. Chem. 2010, 285, 25996-6004.
46. Pan, X.; Zhang, Y.; Wang, L.; Hussain, M. M. Diurnal regulation of MTP and plasma triglyceride by CLOCK is mediated by SHP. Cell. Metab. 2010, 12, 174-86.
47. Qiu, W.; Avramoglu, R. K.; Rutledge, A. C.; Tsai, J.; Adeli, K. Mechanisms of glucosamine-induced suppression of the hepatic assembly and secretion of apolipoprotein B-100-containing lipoproteins. J. Lipid. Res. 2006, 47, 1749-61.
48. Wang, S.; Chen, Z.; Lam, V.; et al. IRE1α-XBP1s induces PDI expression to increase MTP activity for hepatic VLDL assembly and lipid homeostasis. Cell. Metab. 2012, 16, 473-86.
49. Zhang, K.; Tian, L.; Sun, Q.; et al. Constructing an adverse outcome pathway framework for the impact of maternal exposure to PM2.5 on liver development and injury in offspring. Environ. Toxicol. Pharmacol. 2024, 112, 104585.
50. Stachyra, K.; Kiepura, A.; Suski, M.; et al. Changes in the liver proteome in apoE knockout mice exposed to inhalation of silica nanoparticles indicate mitochondrial damage and impairment of ER stress responses associated with microvesicular steatosis. Environ. Sci. Pollut. Res. Int. 2023, 30, 699-709.
51. Ibrahim, I. M.; Abdelmalek, D. H.; Elfiky, A. A. GRP78: A cell's response to stress. Life. Sci. 2019, 226, 156-63.
52. Qiu, W.; Su, Q.; Rutledge, A. C.; Zhang, J.; Adeli, K. Glucosamine-induced endoplasmic reticulum stress attenuates apolipoprotein B100 synthesis via PERK signaling. J. Lipid. Res. 2009, 50, 1814-23.
Cite This Article
How to Cite
Download Citation
Export Citation File:
Type of Import
Tips on Downloading Citation
Citation Manager File Format
Type of Import
Direct Import: When the Direct Import option is selected (the default state), a dialogue box will give you the option to Save or Open the downloaded citation data. Choosing Open will either launch your citation manager or give you a choice of applications with which to use the metadata. The Save option saves the file locally for later use.
Indirect Import: When the Indirect Import option is selected, the metadata is displayed and may be copied and pasted as needed.
About This Article
Copyright

Data & Comments
Data
0


Comments
Comments must be written in English. Spam, offensive content, impersonation, and private information will not be permitted. If any comment is reported and identified as inappropriate content by OAE staff, the comment will be removed without notice. If you have any queries or need any help, please contact us at [email protected].