

Homeostasis of β2-microglobulin in diabetics and non-diabetics with modest cadmium intoxication
 0
0 Abstract
Beta-2-microglobulin (β2M) is released into plasma from nucleated cells, filtered by glomeruli, and degraded by proximal tubular cells (PTCs). Normally, < 1% of filtered β2M is excreted in urine. Intoxication of PTCs by cadmium (Cd) reduces degradation and increases excretion of β2M (TDβ2M and Eβ2M). Diabetes may exacerbate these effects or produce them independently. Herein, we normalized fluxes to creatinine clearance (Ccr) to quantify amounts of β2M excreted and degraded per volume of filtrate (Eβ2M/Ccr and TDβ2M/Ccr). We then performed a case-control study of diabetics (DM, n = 65) and non-diabetics (CTRL, n = 72) with modest Cd exposure. β2M influx (Iβ2M, equated with β2M filtration rate), serum β2M ([β2M]s), and TDβ2M/Ccr were higher in DM. Fractional tubular degradation of filtered β2M (FrTDβ2M) emerged as the least confounded descriptor of PT β2M processing, and low values of FrTDβ2M were seen in a subset of diabetics with minimal Cd intoxication. FrTDβ2M varied inversely with ECd/Ccr in DM and directly with estimated GFR (eGFR) in DM and CTRL. In both groups, Eβ2M/Ccr was inversely related to eGFR and
Keywords
INTRODUCTION
Cadmium (Cd), a ubiquitous environmental contaminant, is present in many foodstuffs[1,2]. Most people acquire Cd primarily from the diet, and they retain it in multiple organs, most notably the kidneys and liver[1-3]. Inhalation of cigarette smoke and polluted air are additional exposure routes[4,5]. Within the kidneys, Cd accumulates disproportionately in proximal renal tubules, where bulk reabsorption of filtrate and its constituents occurs. In time, the metal may interfere with the reabsorption of some filtered substances[6].
Previously, we presented evidence that Cd appears in urine after being released into filtrate from injured tubular cells[7]. Given this evidence, we argued that the excretion rate of Cd (ECd) should be normalized to a function of nephron mass to depict the amount of Cd exiting the kidneys per nephron[7]. GFR is such a function, and creatinine clearance (Ccr) is an attractive surrogate for GFR because ECd/Ccr can be determined without a timed urine collection[7,8]. ECd/Ccr is more physiologically informative than the ratio of urine concentrations of Cd and cr ([Cd]u/[cr]u), the conventional expression of Cd excretion, because Ecr and thus [cr]u are functions of muscle mass, which is unrelated to renal Cd handling[9].
Beta-2 microglobulin (β2M), the light-chain component of class I histocompatibility complexes A, B, and C, is shed continuously by nucleated cells. The protein has a molecular weight of 11,800 daltons; consequently, it is extremely if not completely filterable by human glomeruli[10-12]. In the S1 segment of the proximal tubule (PT), the brush border receptor megalin mediates endocytosis of most or all filtered β2M; within the tubular cell, the protein undergoes lysosomal degradation, and expelled fragments are taken up in segments S2 and S3 of the PT[13]. We recently described evidence from Cd-intoxicated subjects that filtered albumin not subjected to transcytosis in S1 is processed identically to β2M[14]. In addition, it is possible that complexes of Cd-albumin and Cd-β2M also undergo endocytosis through the mediation of the high-affinity/low-capacity lipocalin 2 receptor (SLC22A17) in distal tubular cells[15,16]. Renal tubules normally process at least 99% and as much as 99.9% of filtered β2M[17-19].
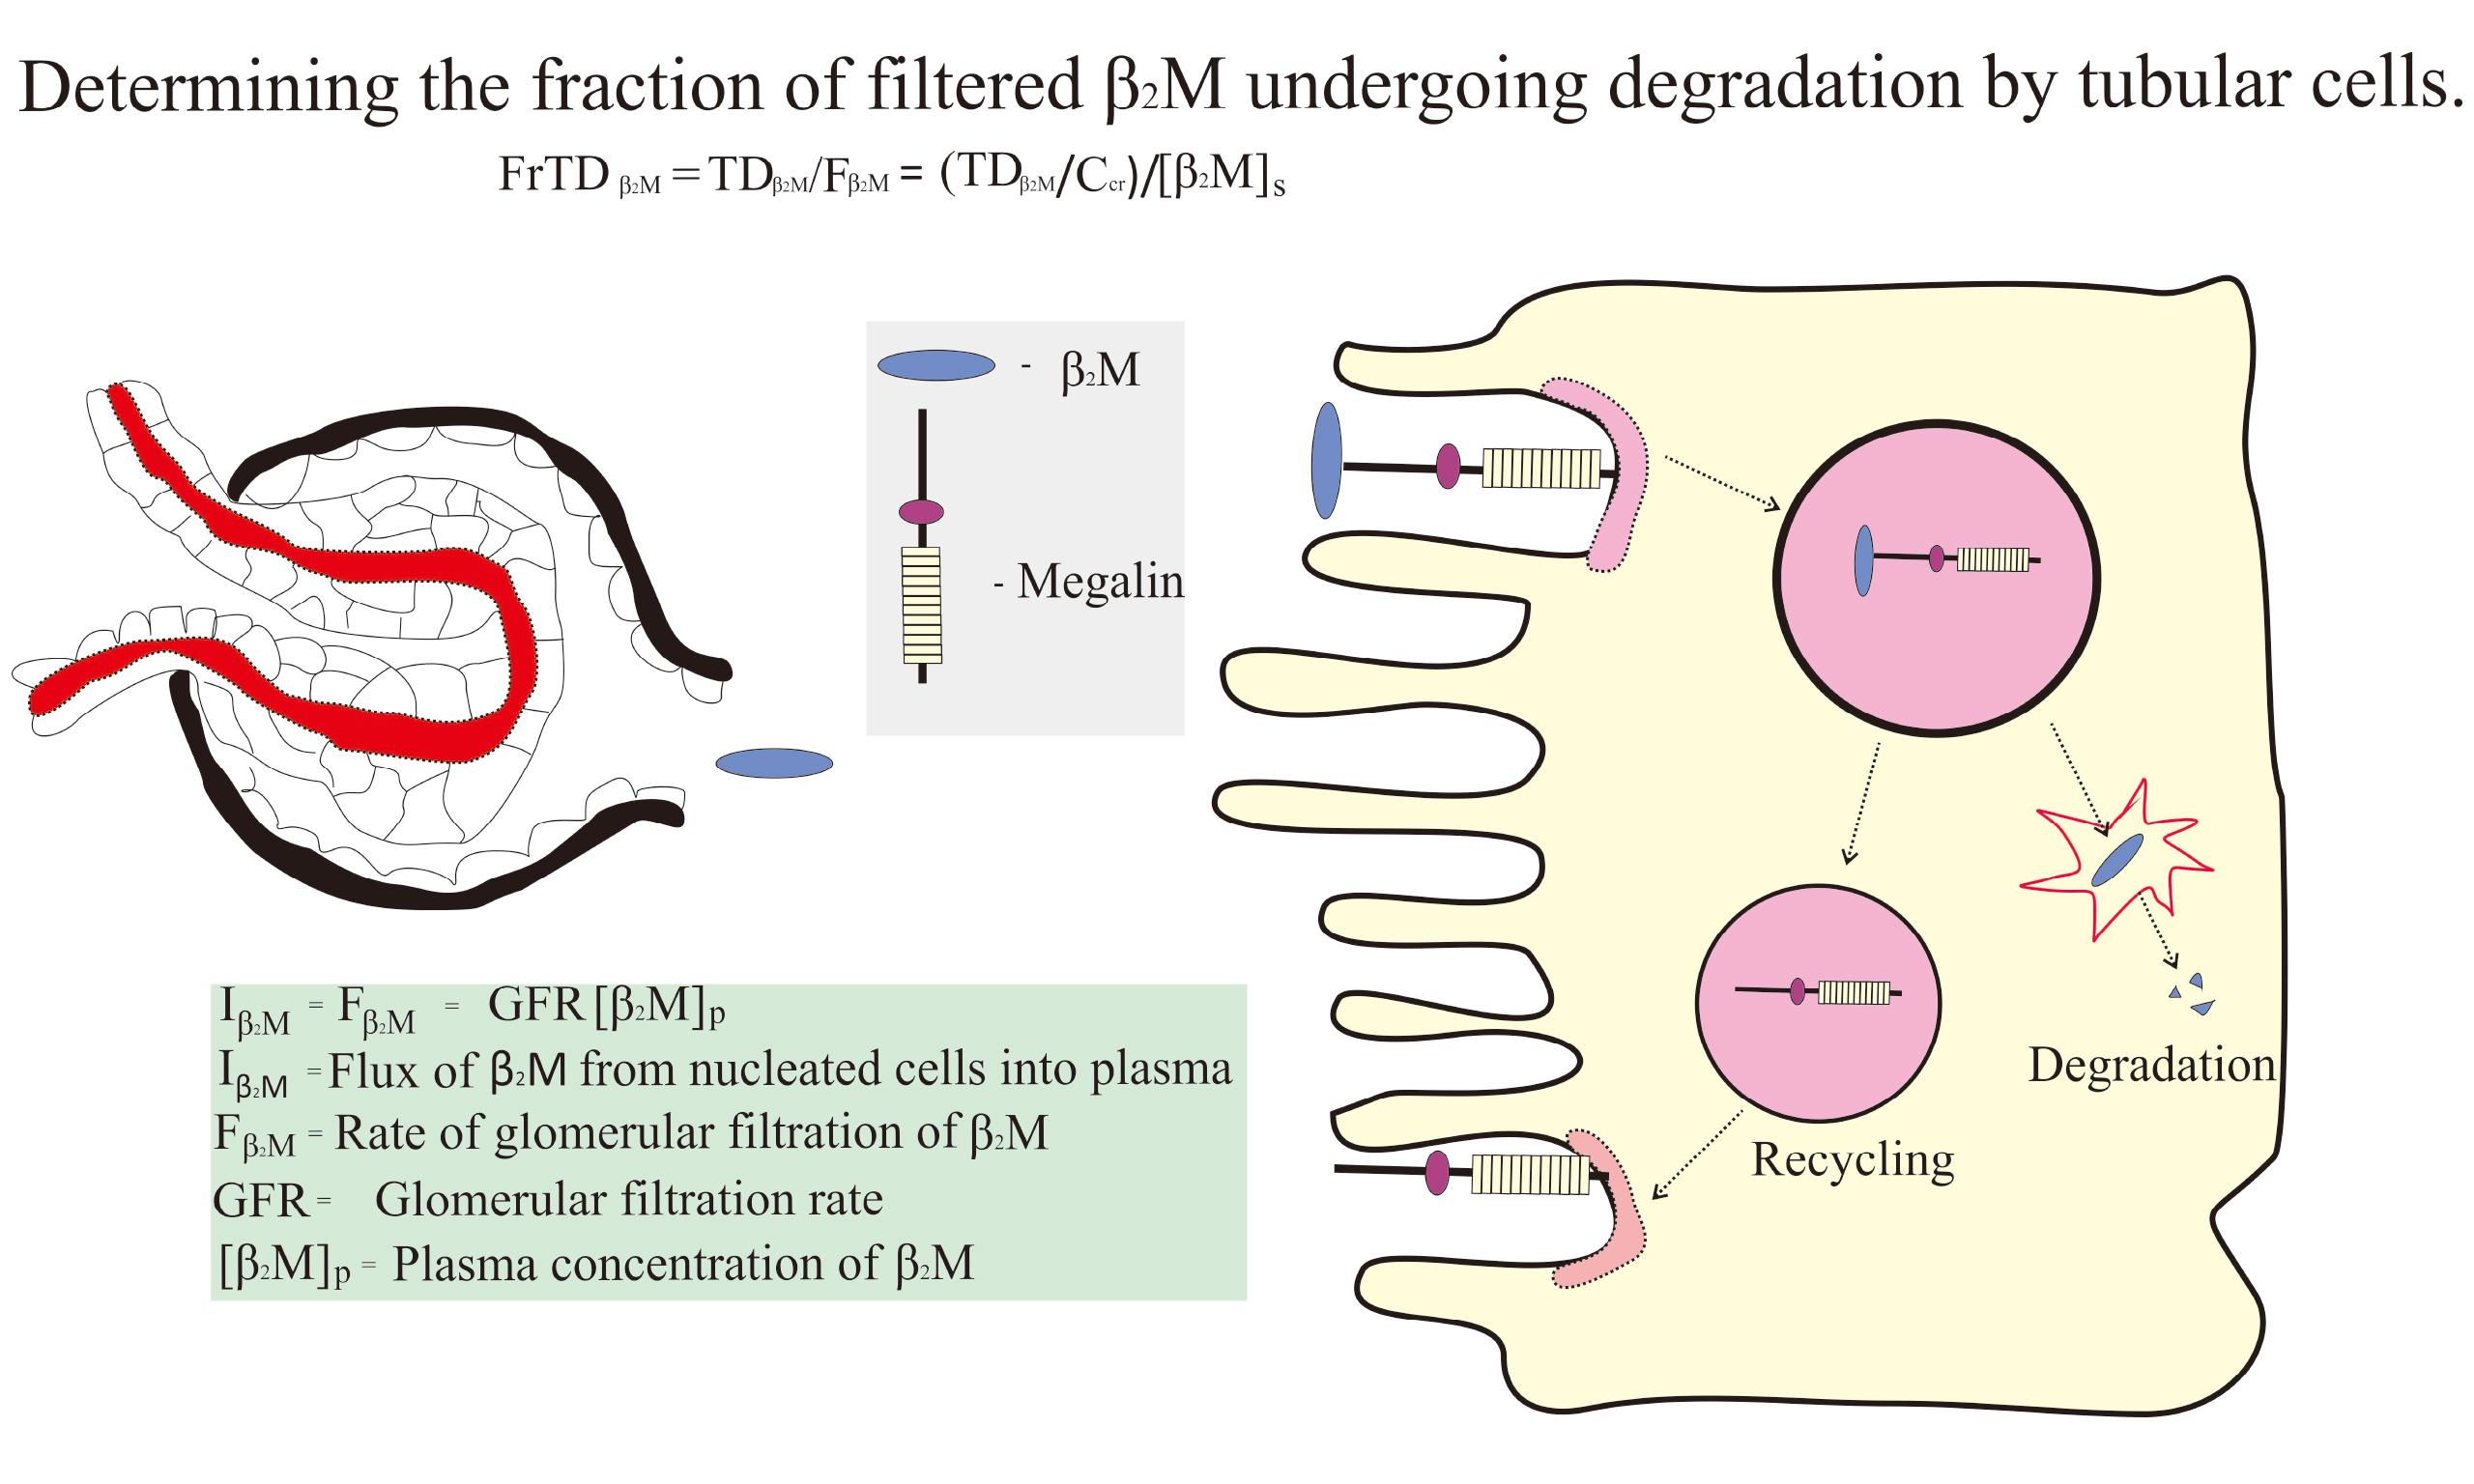
For more than 55 years, increased excretion of β2M (Eβ2M) has been employed as an indicator of proximal tubular dysfunction[20]. Indeed, if the filtration rate of β2M (Fβ2M) has not risen, the presence of excessive β2M in urine necessarily implies a reduction in the degradation of the protein. A report from the Food and Agriculture Organization of the United Nations provided evidence that Eβ2M > 300 g/g of creatinine (cr) is accompanied by ECd > 5.24 µg/g creatinine (https://apps.who.int/iris/handle/10665/44521, accessed on January 7, 2025). The value of [β2M]u/[cr]u is widely employed to identify significant Cd nephrotoxicity. Remarkably, β2M degradation itself is rarely quantified in practice or research, and to the best of our knowledge, it has not been linked systematically to other parameters of β2M homeostasis. Proximal tubular processing of β2M is depicted in Diagram 1.
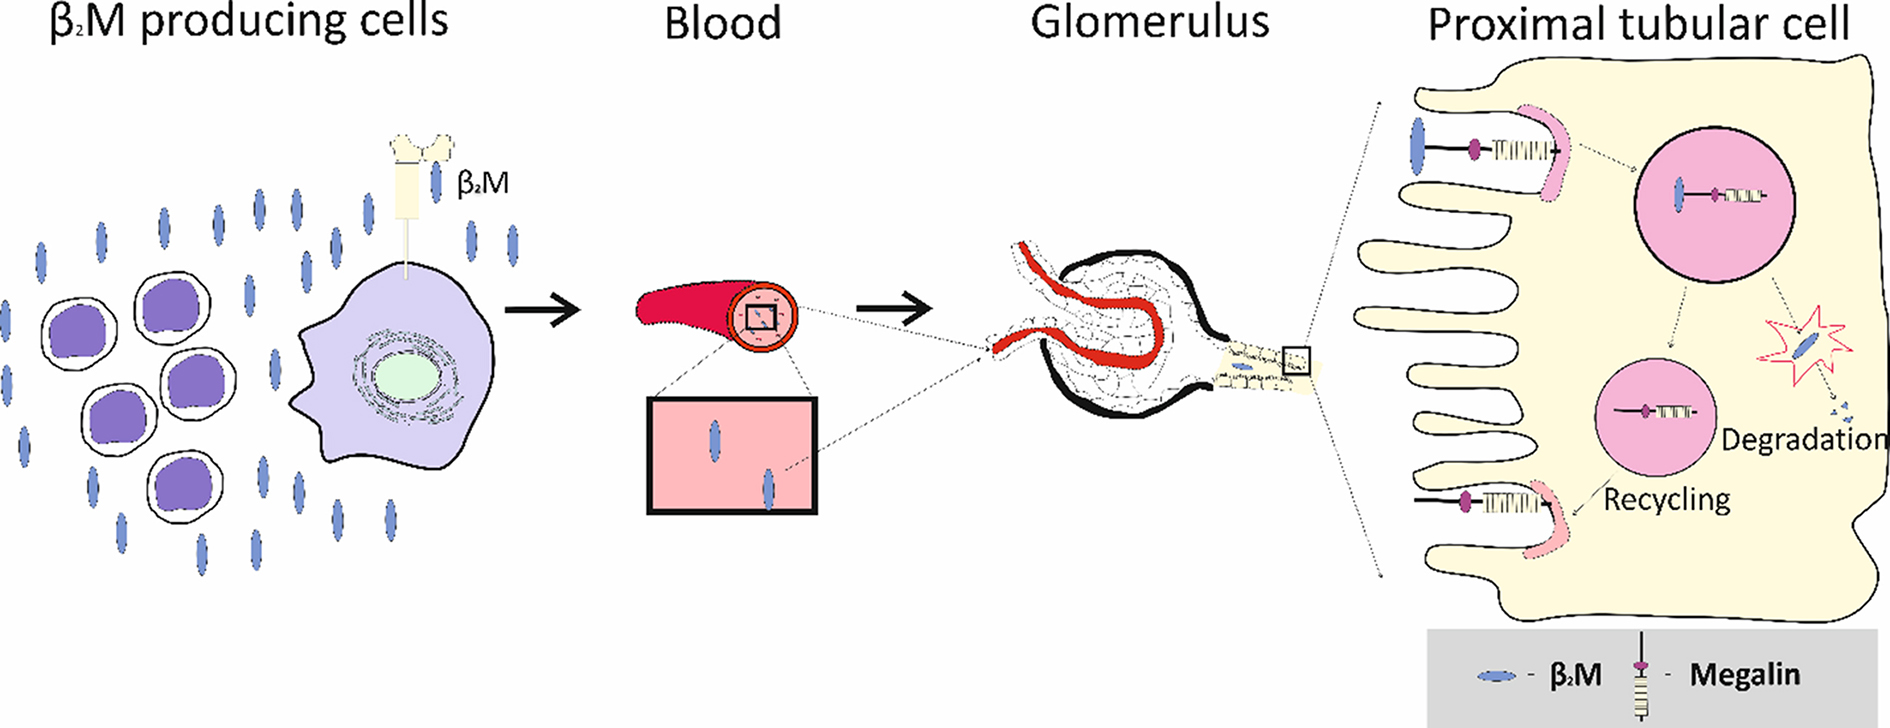
Diagram 1. Proximal tubular processing of β2M. β2M is released to plasma from nucleated cells and filtered completely with plasma by glomeruli. Most or all filtered β2M is degraded in segment S1 of the proximal tubule; resulting fragments are expelled and processed in segments S2 and S3 (not shown). Additional β2M may also be taken up in the distal nephron through the mediation of the lipocalin 2 receptor. β2M: β2-microglobulin.
The individual and combined effects of diabetes mellitus (DM) and Cd on excretion of albumin and β2M have received substantial attention over the past three decades[21-25]. In general, DM is thought to cause proteinuria of glomerular origin, as judged from albumin excretion, and Cd is thought to cause proteinuria of tubular origin, as judged from β2M excretion, but these assumptions may not be entirely defensible. Diabetes reportedly promotes excretion of β2M and other small proteins[22,26,27], and albuminuria is strongly associated with β2-microglobulinuria in cadmium nephropathy[14]. Effects of diabetes and Cd on β2M homeostasis require further clarification.
Herein, we introduce a conceptual framework for quantifying the components of β2M homeostasis, and we examine the effects of diabetes and a modest body burden of Cd on those components. We document surprising variability of influx of β2M into plasma and a reduction in tubular degradation of β2M in some diabetics with minimal Cd toxicity. We also examine shortcomings of Eβ2M as an indicator of tubular handling of β2M and suggest a better alternative for that purpose. Abbreviations are listed in Table 1.
Abbreviations
| Abbreviation | Meaning | Calculation | Units |
| DM | Group with diabetes mellitus | n/a | n/a |
| CTRL | Control group without diabetes | n/a | n/a |
| GFR | Glomerular filtration rate | Footnote | mL/min or L/d |
| eGFR | Estimated GFR | Reference 26 | mL/min/1.73m2 |
| Vu | Urine flow rate | n/a | mL, dL, or L/d |
| cr | Creatinine | n/a | n/a |
| [cr]s | Serum creatinine concentration | n/a | mg/dL |
| [cr]u | Urine creatinine concentration | n/a | mg/dL |
| Ecr | Rate of urinary creatinine Excretion | [cr]u(Vu) | mg/d |
| Ccr | Creatinine clearance | Ecr/[cr]s | mL/min; L/d |
| Cd | Cadmium | n/a | n/a |
| [Cd]u | Urinary Cd concentration | n/a | µg/L |
| [Cd]b | Blood Cd concentration | n/a | µg/L |
| ECd | Urinary excretion rate of Cd | [Cd]uVu | g/d |
| ECd/Ccr | Amount of Cd excreted per volume of glomerular filtrate | [Cd]u[cr]s/[cr]u | g/L |
| β2M | β2-microglobulin | n/a | n/a |
| [β2M]p | Plasma concentration of β2M | n/a | mg/L |
| [β2M]s | Serum concentration of β2M | n/a | mg/L |
| [β2M]u | Urine concentration of β2M | n/a | g/L |
| Fβ2M | Rate of glomerular filtration of β2M | eGFR[β2M]s | mg/d |
| Eβ2M | Urinary excretion rate of β2M | Vu[β2M]u | g/d |
| TDβ2M | Rate of tubular degradation of β2M | Fβ2M - Eβ2M | mg/d |
| Eβ2M/Ccr | Amount of β2M excreted per volume of glomerular filtrate | [β2M]u[cr]s/[cr]u | g/L |
| TDβ2M/Ccr | Amount of β2M undergoing tubular degradation per volume of glomerular filtrate | [β2M]s - Eβ2M/Ccr | mg/L |
| FrTDβ2M | Fractional tubular degradation of filtered β2M | (TDβ2M/Ccr)/[β2M]s | Decimal fraction |
| GSC | Glomerular sieving coefficient | [x]filtrate/[x]plasma | Decimal fraction |
| SLR | Simple linear regression | n/a | n/a |
| MLR | Multiple linear regression | n/a | n/a |
EXPERIMENTAL
Study design
This investigation employed a case-control design. A purposive sampling technique was used to recruit type 2 diabetics and controls in equal numbers. Recruitments occurred during annual checkups at a local health center in Pakpoon Municipality, Nakhon Si Thammarat Province, Thailand. Diabetics and controls were matched for age, gender, and locality, and all subjects were at least 40 years old.
Exclusion criteria were non-resident status, current pregnancy and/or breastfeeding, and hospital records or a physician’s diagnosis of an advanced chronic disease, including heart disease, stroke, and cancer. Control subjects were in good general health and met all exclusion criteria. Sociodemographic data, educational attainment, occupation, health status, family history of diabetes, and smoking status were ascertained by structured interview questionnaires. After exclusion of outliers and subjects with missing data, 65 diabetics and 72 controls were included for analysis.
Diabetes was defined as fasting plasma glucose [Glc]p levels ≥ 126 mg/dL or a physician’s diagnosis. Some patients with DM took metformin. Special diets were not employed in diabetics or controls. Reported use of dietary supplements was 3% among controls and 7% among diabetics[28].
Technical considerations
Participants were asked to fast overnight, and collection of blood and urine samples was carried out at the Pakpoon health center on the morning of the following day. For the glucose assay, blood samples were collected in tubes containing fluoride that inhibited glycolysis. Blood samples for Cd analysis were collected in separate tubes containing ethylenediamine tetra-acetic acid (EDTA) as an anticoagulant. To prevent the degradation of β2M in acidic conditions, an alkaline (NaOH) solution was added to adjust the pH of urine samples to > 6 before their storage. Blood and urine samples were kept on ice and transported within one hour to the laboratory of Walailak University, where samples of plasma and serum were prepared. Aliquots of urine, whole blood, serum, and plasma were stored at -80 °C for later analysis.
The plasma glucose assay was based on the oxidase-peroxidase method (Glu Colorimetric Assay Kit, Elabscience, Houston, TX, USA)[29]. Assays of creatinine in urine and plasma were based on Jaffe’s alkaline picrate method, as described previously[30]. The human beta-2 microglobulin/β2M ELISA pair set (Sino Biological Inc., Wayne, PA, USA) was employed to determine serum and urine concentrations of β2M
Urinary and whole blood Cd concentrations ([Cd]u, [Cd]b) were determined with GBC System 5000 graphite furnace atomic absorption spectrometry (AAS) (GBC Scientific Equipment, Hampshire, IL, USA)[31]. Standards with As, Be, Cd, Cr (VI), Hg, Ni, Pb, Se, and Tl were used to calibrate the instrument (Merck KGaA, Darmstadt, Germany). Reference urine metal levels 1, 2, and 3 (Lyphocheck, Bio-Rad, Hercules, CA, USA) were used for quality control, analytical accuracy, and precision assurance. When [Cd]u and [Cd]b were less than their detection limit of 0.1 µg/L, the concentration assigned was the detection limit value divided by the square root of 2[32].
Normalization of cadmium and β2m excretion rates
Excretion of substance x (Ex) was normalized to creatinine clearance (Ccr) with the formula Ex/Ccr = [x]u[cr]p/[cr]u, where x = Cd or β2M, [x]u = urine concentration of x (mass/volume), [cr]p = plasma creatinine concentration (mg/dL), and [cr]u = urine creatinine concentration (mg/dL). Ex/Ccr expresses the amount of x excreted per volume of glomerular filtrate[8]. Normalization to Ccr simultaneously corrects for urine dilution and functional nephron mass. Ex/Ccr is not affected by muscle mass.
Estimated glomerular filtration rate
Estimated GFR (eGFR) was ascertained with Chronic Kidney Disease Epidemiology Collaboration (CKD-EPI) equations published in 2009[33]. CKD stages 1, 2, 3, 4, and 5 corresponded to eGFR of 90-119, 60-89, 30-59, 15-29, and < 15 mL/min/1.73 m2, respectively.
Derivation of a conceptual framework for analysis of β2M homeostasis
Assume that:
(a) Iβ2M = influx of β2M into plasma from nucleated cells;
(b) GSCβ2M = glomerular sieving coefficient of β2M = 1 (i.e., all β2M in filtered plasma enters filtrate)[11,12];
(c) Fβ2M = rate of filtration (and subsequent renal disposition) of β2M;
(d) Plasma is in equilibrium with respect to β2M (Iβ2M = Fβ2M).
It follows that:
(1) Iβ2M = Fβ2M = GFR[β2M]p, where [β2M]p is the plasma concentration of the protein.
Dividing by GFR and rearranging,
(2) [β2M]p = Iβ2M/GFR = Fβ2M/GFR.
Since filtered β2M is either excreted or reabsorbed and degraded,
(3) Fβ2M = GFR[β2M]p = Eβ2M + TDβ2M,
where = Eβ2M and TDβ2M are rates of excretion and tubular degradation of β2M, respectively. Dividing by GFR,
(4) [β2M]p (mass/vol of plasma) = Eβ2M/GFR + TDβ2M/GFR (both ratios in units of mass/vol of filtrate).
Substitution of creatinine clearance (Ccr) for GFR in equation 4 permits estimation of Eβ2M/GFR and TDβ2M/GFR from measurements in simultaneous aliquots of serum and urine. Thus,
Eβ2M/Ccr = [β2M]uVu/[cr]uVu/[cr]p; after simplification,
Eβ2M/Ccr = [β2M]u[cr]p/[cr]u. It follows that
(5) [β2M]p = Eβ2M/Ccr + TDβ2M/Ccr = [β2M]u[cr]p/[cr]u + TDβ2M/Ccr, and
(6) TDβ2M/Ccr = [β2M]p - Eβ2M/Ccr = [β2M]p - [β2M]u[cr]p/[cr]u.
As functions of both Iβ2M and GFR (equation 2), [β2M]p and TDβ2M/Ccr are quite variable, and a less confounded parameter of tubular β2M handling is needed. FrTDβ2M, the fraction of filtered β2M that is degraded by tubules, is calculated as follows:
(7) FrTDβ2M = TDβ2M/Fβ2M = TDβ2M/[β2M]pCcr = (TDβ2M/Ccr)/[β2M]p.
In subjects with severe Cd intoxication, FrTDβ2M may be substantially reduced[34].
The conventional parameter for assessing degradation of β2M is [β2M]u/[cr]u, which is a function of Eβ2M. However, because TDβ2M/Ccr and [β2M]p are highly variable, relationships between FrTDβ2M and Eβ2M or Eβ2M/Ccr cannot be precise. Since filtered β2M is either excreted or reabsorbed and degraded,
Fβ2M = Eβ2M + TDβ2M, and
(8) Eβ2M = Fβ2M - TDβ2M
= Fβ2M - (FrTDβ2M)(Fβ2M)
= (1 - FrTDβ2M)(Fβ2M).
Eβ2M is ultimately a function of both FrTDβ2M and Fβ2M (Iβ2M), and a single value of Eβ2M is compatible with multiple combinations of these parameters. The argument does not change if equations (8) above are divided by Ccr. Since Fβ2M/Ccr = [β2M]s (equation 2),
(9) Eβ2M/Ccr = [β2M]s - TDβ2M/Ccr
= [β2M]s - (FrTDβ2M)[β2M]s
= (1 - FrTDβ2M)[β2M]s.
Eβ2M/Ccr is therefore a function of FrTDβ2M and [β2M]s, and a single value of Eβ2M/Ccr is compatible with multiple combinations of FrTDβ2M and [β2M]s.
Calculations
ECd/Ccr, Fβ2M, Eβ2M/Ccr, TDβ2M/Ccr, and FrTDβ2M were calculated in accordance with equations 1-9. For calculation of Fβ2M (equation 1), eGFR in mL/min/1.73m2 was multiplied by 1.44 to yield eGFR in L/d. For calculation of TDβ2M/Ccr (equation 5), Eβ2M/Ccr in g/L of filtrate was multiplied by 10-3 to yield Eβ2M/Ccr in
Statistical analyses
Data in Table 2 (characteristics of diabetics and controls) were analyzed with IBM SPSS Statistics 21 (IBM Inc., New York, NY, USA). Conformity of continuous variables to a normal distribution was assessed by the one-sample Kolmogorov-Smirnov test. Logarithmic transformation was applied to ECd/Ecr and ECd/Ccr, which showed right-skewed distributions. Estimated GFR values, which showed a left-skewed distribution, were analyzed without transformation. The Mann-Whitney U test was used to assess differences between DM and CTRL. Pearson’s chi-squared test was used to determine differences in percentages and prevalences of female gender, smoking, and eGFR < 60 mL/min/1.73 m2. A multiple linear regression model was used to assess contributions of demographic parameters to variability of FrTDβ2M. Correlation matrices were generated from regression analyses of all homeostatic relationships examined in the present study. Correlations involving Fβ2M, FrTDβ2M, and Eβ2M/Ccr were organized by gender and presence or absence of diabetes. The resulting table is presented in the Supplementary Materials. Statistical significance was indicated by P-values ≤ 0.05.
Characteristics of cases and age-, sex- and locality-matched controls
| Variables | All, n = 137 | Diabetics, n = 65 | Controls, n = 72 | P |
| Females, % | 78.1 | 76.9 | 79.2 | 0.751 |
| Smoking, % | 10.2 | 9.2 | 11.1 | 0.717 |
| Age, years | 59.7 (9.1) | 58.0 (9.4) | 61.2 (8.6) | 0.048 |
| Age range, years | 41-80 | 41-78 | 43-80 | - |
| DM duration | ||||
| < 10 years, % | n/a | 59.7 | n/a | - |
| ≥ 10 years, % | n/a | 40.3 | n/a | - |
| BMI, kg/m2 | 25.6 (4.8) | 26.7 (4.8) | 24.6 (4.6) | 0.003 |
| Fasting plasma glucose, mg/dL | 129 (61) | 169 (68) | 94 (11) | < 0.001 |
| eGFR, mL/min/1.73 m2 | 79.3 (16.0) | 80.2 (18.5) | 78.5 (13.2) | 0.345 |
| eGFR < 60 mL/min/1.73 m2, % | 12.4 | 15.4 | 9.7 | 0.315 |
| [cr]s, mg/dL | 0.87 (0.19) | 0.88 (0.22) | 0.86 (0.16) | 0.750 |
| [cr]u, mg/dL | 92.2 (55.1) | 88.8 (57.7) | 95.4 (52.9) | 0.303 |
| [β2M]s, mg/L | 5.98 (3.29) | 7.05 (3.88) | 5.02 (2.28) | 0.004 |
| [β2M]u, µg/L | 68 (58) | 96 (64) | 42 (37) | < 0.001 |
| Exposure indicators | ||||
| [Cd]b, µg/L | 0.57 (0.45, 0.69) | 0.50 (0.35, 0.64) | 0.63 (0.44, 0.82) | 0.607 |
| [Cd]u, µg/L | 0.65 (1.11) | 0.65 (1.16) | 0.66 (1.07) | 0.838 |
| ECd/Ecr, µg/g creatinine | 0.98 (0.66,1.29) | 0.96 (0.52,1.40) | 0.99 (0.53,1.45) | 0.609 |
| ECd/Ccr, (µg/L of filtrate) × 100 | 0.86 (0.57,1.14) | 0.85 (0.43,1.27) | 0.86 (0.46,1.26) | 0.543 |
| Effects indicators (outcomes) | ||||
| Eβ2M/Ecr, µg/g creatinine | 108 (88,128) | 158 (124,191) | 63 (45,81) | < 0.001 |
| Eβ2M/Ccr, µg/L of filtrate | 0.99 (0.79,1.18) | 1.48 (1.14,1.82) | 0.54 (0.40,0.69) | < 0.001 |
| Fβ2M, mg/d | 671.9 (395.1) | 791.3 (469.2) | 564.1 (275.3) | < 0.001 |
| FrTDβ2M | 0.9983 (0.0020) | 0.998 (0.003) | 0.999 (0.001) | < 0.001 |
| TDβ2M/Ccr, mg/L of filtrate | 5.97 (3.29) | 7.04 (3.88) | 5.04 (2.28) | < 0.001 |
We used Microsoft Excel to examine a simple linear regression (SLR) of eGFR on ECd/Ccr and SLRs of Fβ2M, [β2M]p, FrTDβ2M, TDβ2M/Ccr, and Eβ2M/Ccr on determinants suggested by equations 1-9. When SLRs revealed associations of a parameter with multiple potential determinants, we performed multilinear regressions (MLRs) to identify confounders and mutually independent relationships.
RESULTS AND DISCUSSION
Participants
Characteristics of cases (DM) and controls (CTRL) are compared in Table 2. Values of ECd/Ecr and ECd/Ccr were generally lower than in our previous assessments of other populations[7,35], and values of ECd/Ecr were substantially lower than in Japanese subjects from polluted and non-polluted areas who were studied in the 1990s[34]. Mean age was slightly higher in CTRL, and body mass index (BMI) and fasting plasma glucose were higher in DM. Differences between groups in the following parameters were not statistically significant: [cr]s, [cr]u, eGFR, % eGFR < 60 mL/min/1.73m2, [Cd]u, [Cd]b, and ECd/Ccr. [β2M]s, Fβ2M, Eβ2M/Ccr, and TDβ2M/Ccr were higher in DM, and FrTDβ2M was slightly higher in CTRL. All differences in homeostatic parameters were significant at P < 0.001.
Regression of eGFR on ECd/Ccr
Figure 1 depicts SLRs of eGFR on ECd/Ccr in DM and CTRL. The figure shows that eGFR was weakly and inversely related to ECd/Ccr in CTRL and unrelated to ECd/Ccr in DM. In both groups, the entire range of eGFR was evident at minimal values of ECd/Ccr. In six subjects with ECd/Ccr > 0.05 µg/L of filtrate, all values of eGFR were ≤ 80 mL/min/1.73m2. In CTRL, the modest inverse relationship of eGFR to ECd/Ccr was created by points from relatively few subjects. We do not know why DM was not similarly affected.
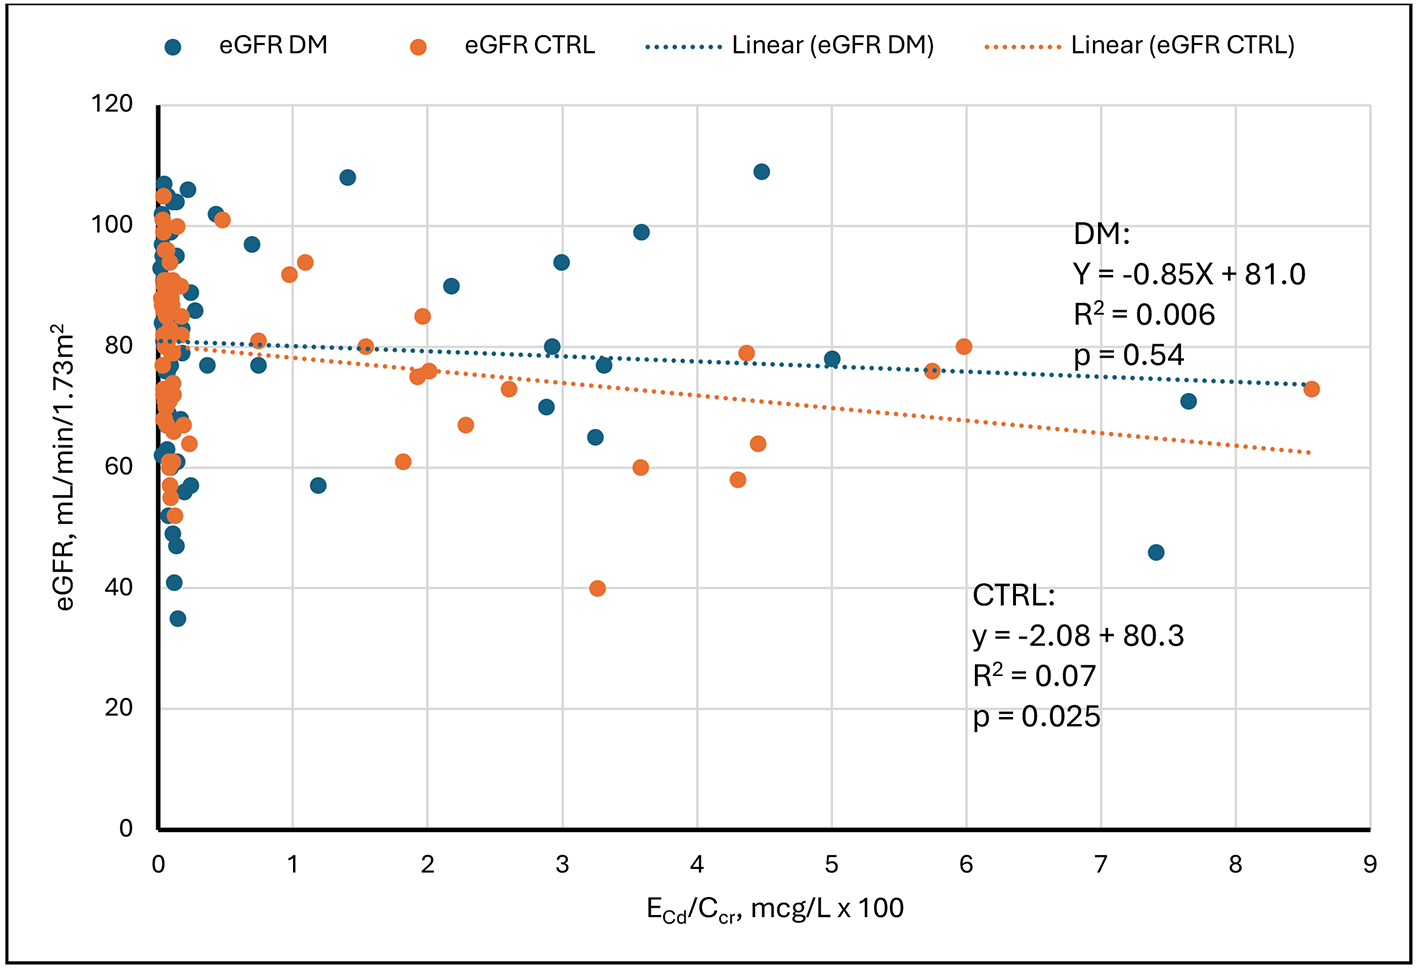
Figure 1. Linear regressions of eGFR on ECd/Ccr. Scatter diagrams present data from diabetics (DM, blue) and non-diabetic controls (CTRL, orange). An inverse relationship is evident in CTRL. No relationship is evident in DM. Cd: Cadmium; cr: creatinine; eGFR: estimated glomerular filtration rate; ECd/Ccr: amount of Cd excreted per volume of glomerular filtrate; DM: group with diabetes mellitus; CTRL: control group without diabetes.
Regressions of Fβ2M on its determinants
Equation 1 states in part that Iβ2M equals Fβ2M. The implied assumption is that in free-living subjects, plasma is in equilibrium with respect to β2M, as it is for other substances[36,37]. Stated differently, Iβ2M, the rate at which β2M enters plasma, equals Fβ2M, the rate at which kidneys dispose of the protein. The remainder of equation 1 states that Fβ2M (Iβ2M) equals eGFR[β2M]s. If Iβ2M varies during the day, we infer that [β2M]s varies promptly in response because eGFR is stable. Consequently, Fβ2M approximates Iβ2M from moment to moment and can therefore be employed as an ascertainable surrogate for Iβ2M in linear regressions.
The graphs in Figure 2 show that in our study sample, Fβ2M varied over its range, 100 to 2,000 mg/d, by a factor of 20. At the same time, except for a few low outliers, eGFR varied over its range, 55 to
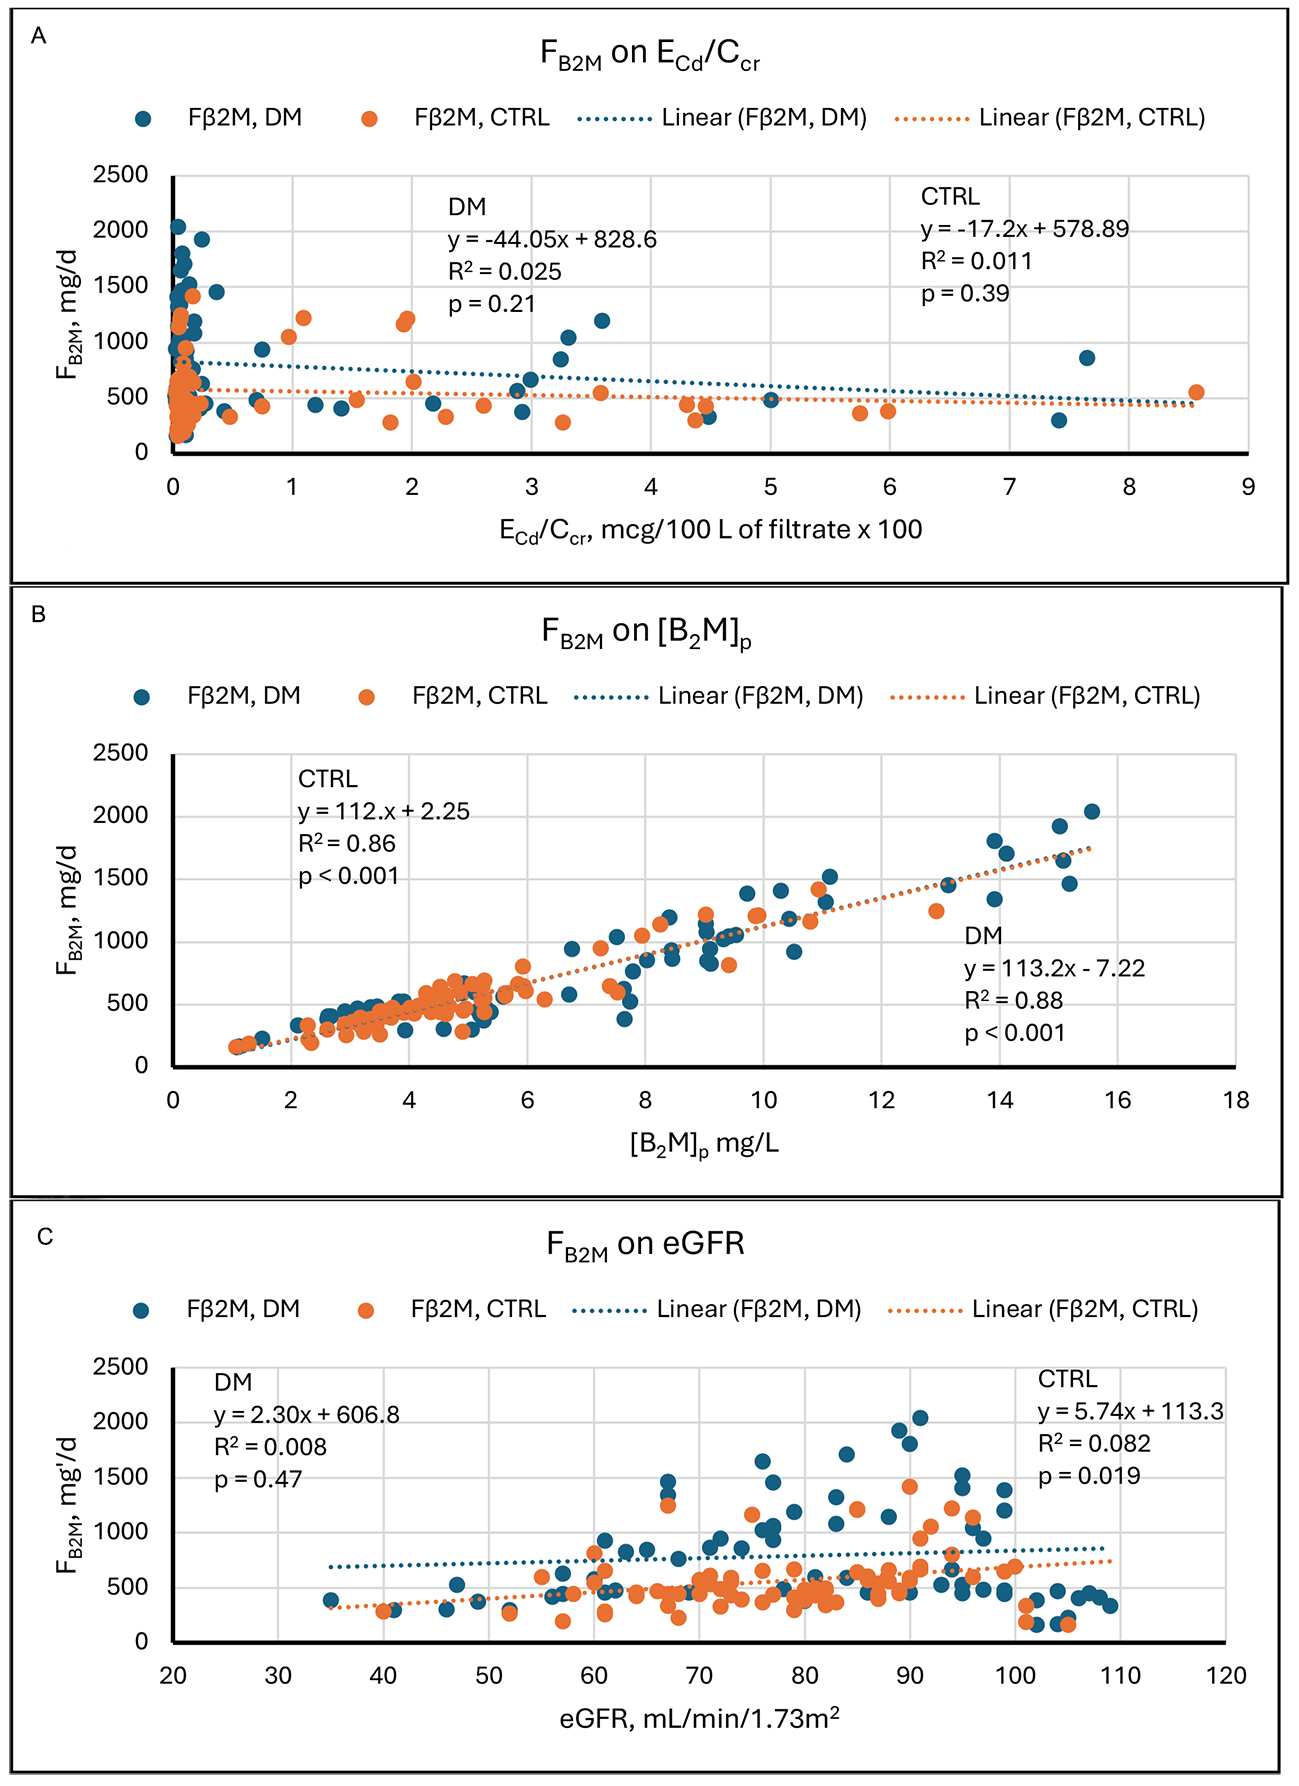
Figure 2. Linear regressions of Fβ2M on potential determinants. Scatter diagrams present data from diabetics (DM, blue) and non-diabetic controls (CTRL, orange). The graphs plot Fβ2M against (A) ECd/Ccr, (B) [β2M]s, and (C) eGFR. No relationships are evident in (A). Strong direct relationships are evident in both groups in (B). In (C), a direct relationship is evident in CTRL, but no relationship is evident in DM. Cd: Cadmium; cr: creatinine; β2M: β2-microglobulin; Fβ2M: rate of glomerular filtration of β2M; DM: group with diabetes mellitus; CTRL: control group without diabetes; ECd/Ccr: amount of Cd excreted per volume of glomerular filtrate; [β2M]s: serum concentration of β2M; eGFR: estimated glomerular filtration rate.
Results of simple linear regressions
| Figure | Regression | DM | CTRL | ||||
| Relationship | R 2 | P | Relationship | R 2 | P | ||
| 1 | eGFR on ECd/Ccr | None | 0.006 | 0.54 | Inverse | 0.07 | 0.025 |
| 2A | Fβ2M on ECd/Ccr | None | 0.025 | 0.21 | None | 0.011 | 0.39 |
| 2B | Fβ2M on [β2M]s | Direct | 0.88 | < 0.001 | Direct | 0.88 | < 0.001 |
| 2C | Fβ2M on eGFR | None | 0.008 | 0.47 | Direct | 0.082 | 0.019 |
| 3A | [β2M]s on ECd/Ccr | None | 0.02 | 0.25 | None | 0.0006 | 0.83 |
| 3B | [β2M]s on Fβ2M | Direct | 0.88 | < 0.001 | Direct | 0.86 | < 0.001 |
| 3C | [β2M]s on eGFR | None | 0.05 | 0.06 | None | 0.004 | 0.60 |
| 4A | FrTDβ2M on ECd/Ccr | Inverse | 0.11 | 0.006 | Inverse | 0.058 | 0.04 |
| 4B | FrTDβ2M on Fβ2M | Direct | 0.13 | 0.04 | None | 0.03 | 0.13 |
| 4C | FrTDβ2M on [β2M]s | Direct | 0.06 | 0.045 | None | 0.003 | 0.64 |
| 4D | FrTDβ2M on eGFR | Direct | 0.19 | < 0.001 | Direct | 0.17 | < 0.001 |
| 5A | TDβ2M/Ccr on ECd/Ccr | None | 0.02 | 0.24 | None | 0.0007 | 0.83 |
| 5B | TDβ2M/Ccr on Fβ2M | Direct | 0.88 | < 0.001 | Direct | 0.86 | < 0.001 |
| 5C | TDβ2M/Ccr on [B2M]s | Direct | 0.999 | < 0.001 | Direct | 0.999 | < 0.001 |
| 5D | TDβ2M/Ccr on FrTDβ2M | Direct | 0.064 | 0.042 | None | 0.003 | 0.62 |
| 5E | TDβ2M/Ccr on eGFR | None | 0.05 | 0.07 | None | 0.004 | 0.61 |
| 6A | Eβ2M/Ccr on ECd/Ccr | Direct | 0.092 | 0.014 | None | 0.014 | 0.33 |
| 6B | Eβ2M/Ccr on Fβ2M | None | <0.001 | 0.98 | Direct | 0.11 | 0.005 |
| 6C | Eβ2M/Ccr on [β2M]s | None | 0.02 | 0.23 | Direct | 0.11 | < 0.001 |
| 6D | Eβ2M/Ccr on eGFR | Inverse | 0.32 | < 0.001 | Inverse | 0.10 | 0.008 |
| 6E | Eβ2M/Ccr on TDβ2M/Ccr | None | 0.02 | 0.24 | Direct | 0.21 | < 0.001 |
| 6F | Eβ2M/Ccr on FrTDβ2M | Inverse | 0.68 | < 0.001 | Inverse | 0.59 | < 0.001 |
Results of multilinear regressions
| Variable analyzed | Significantly associated parameter(s) in SLR | Relationship direct or inverse | R 2 | P-value | Persistently associated parameter(s) in MLR | P-value | R 2 for multilinear regression |
| Fβ2M, CTRL | [β2M]p | Direct | 0.86 | < 0.001 | [β2M]p | < 0.001 | 0.97 |
| eGFR | Direct | 0.082 | 0.019 | eGFR | < 0.001 | - | |
| [β2M]p, DM | Fβ2M | Direct | 0.88 | < 0.001 | Fβ2M | < 0.001 | 0.98 |
| eGFR | Direct | 0.05 | 0.06 | eGFR | < 0.001 | - | |
| FrTDβ2M, DM | ECd/Ccr | Inverse | 0.11 | 0.006 | ECd/Ccr | 0.02 | 0.43 |
| Fβ2M | Direct | 0.13 | 0.04 | Fβ2M | 0.04 | - | |
| [β2M]p | Direct | 0.064 | 0.04 | [β2M]p | 0.01 | - | |
| eGFR | Direct | 0.19 | < 0.001 | eGFR | < 0.001 | - | |
| FrTDβ2M, CTRL | ECd/Ccr | Inverse | 0.058 | 0.04 | eGFR | 0.001 | 0.19 |
| eGFR | Direct | 0.17 | < 0.001 | - | - | - | |
| TDβ2M/Ccr, DM | Fβ2M | Direct | 0.88 | < 0.001 | [β2M]p | < 0.001 | 1 |
| [β2M]p | Direct | 0.999 | < 0.001 | FrTDβ2M | < 0.001 | - | |
| FrTDβ2M | Direct | 0.064 | 0.042 | - | - | - | |
| TDβ2M/Ccr, CTRL | Fβ2M | Direct | 0.86 | < 0.001 | Fβ2M | 0.016 | 1 |
| [β2M]p | Direct | 0.999 | < 0.001 | [β2M]p | < 0.001 | - | |
| Eβ2M/Ccr, DM | ECd/Ccr | Direct | 0.092 | 0.014 | eGFR | 0.001 | 0.73 |
| eGFR | Inverse | 0.32 | < 0.001 | FrTDβ2M | < 0.001 | - | |
| FrTDβ2M | Inverse | 0.68 | < 0.001 | - | - | - | |
| Eβ2M/Ccr, CTRL | Fβ2M | Direct | 0.11 | 0.005 | eGFR | 0.06 | 0.85 |
| [β2M]p | Direct | 0.11 | < 0.001 | TDβ2M/Ccr | 0.002 | - | |
| eGFR | Inverse | 0.10 | 0.008 | FrTDβ2M | < 0.001 | - | |
| TDβ2M/Ccr | Direct | 0.21 | < 0.001 | - | - | - | |
| FrTDβ2M | Inverse | 0.59 | < 0.001 | - | - | - |
Regressions of [β2M]s on its determinants
If Iβ2M = Fβ2M = eGFR[β2M]p (equation 1), then [β2M]p = Iβ2M/eGFR = Fβ2M/eGFR (equation 2). In the present study, [β2M]s, like Fβ2M, was not related to ECd/Ccr in DM and CTRL [Figure 3A], but it was closely and directly related to Fβ2M in both groups [Figure 3B]. This observation is expected because an SLR of Fβ2M on [β2M]s was highly significant [Figure 2B]. We include Figure 3B because Fβ2M = Iβ2M, and the high R2 values indicate that Iβ2M was the principal determinant of [β2M]s in our subjects. [β2M]s was inversely but marginally related to eGFR in DM and unrelated to eGFR in CTRL. In both groups, the disproportionate influence of Iβ2M on [β2M]s probably resulted from the fact that Fβ2M (Iβ2M) varied over its range by a factor of approximately 20; in contrast, eGFR varied by a factor of 2, with a few outliers at the low end of the range
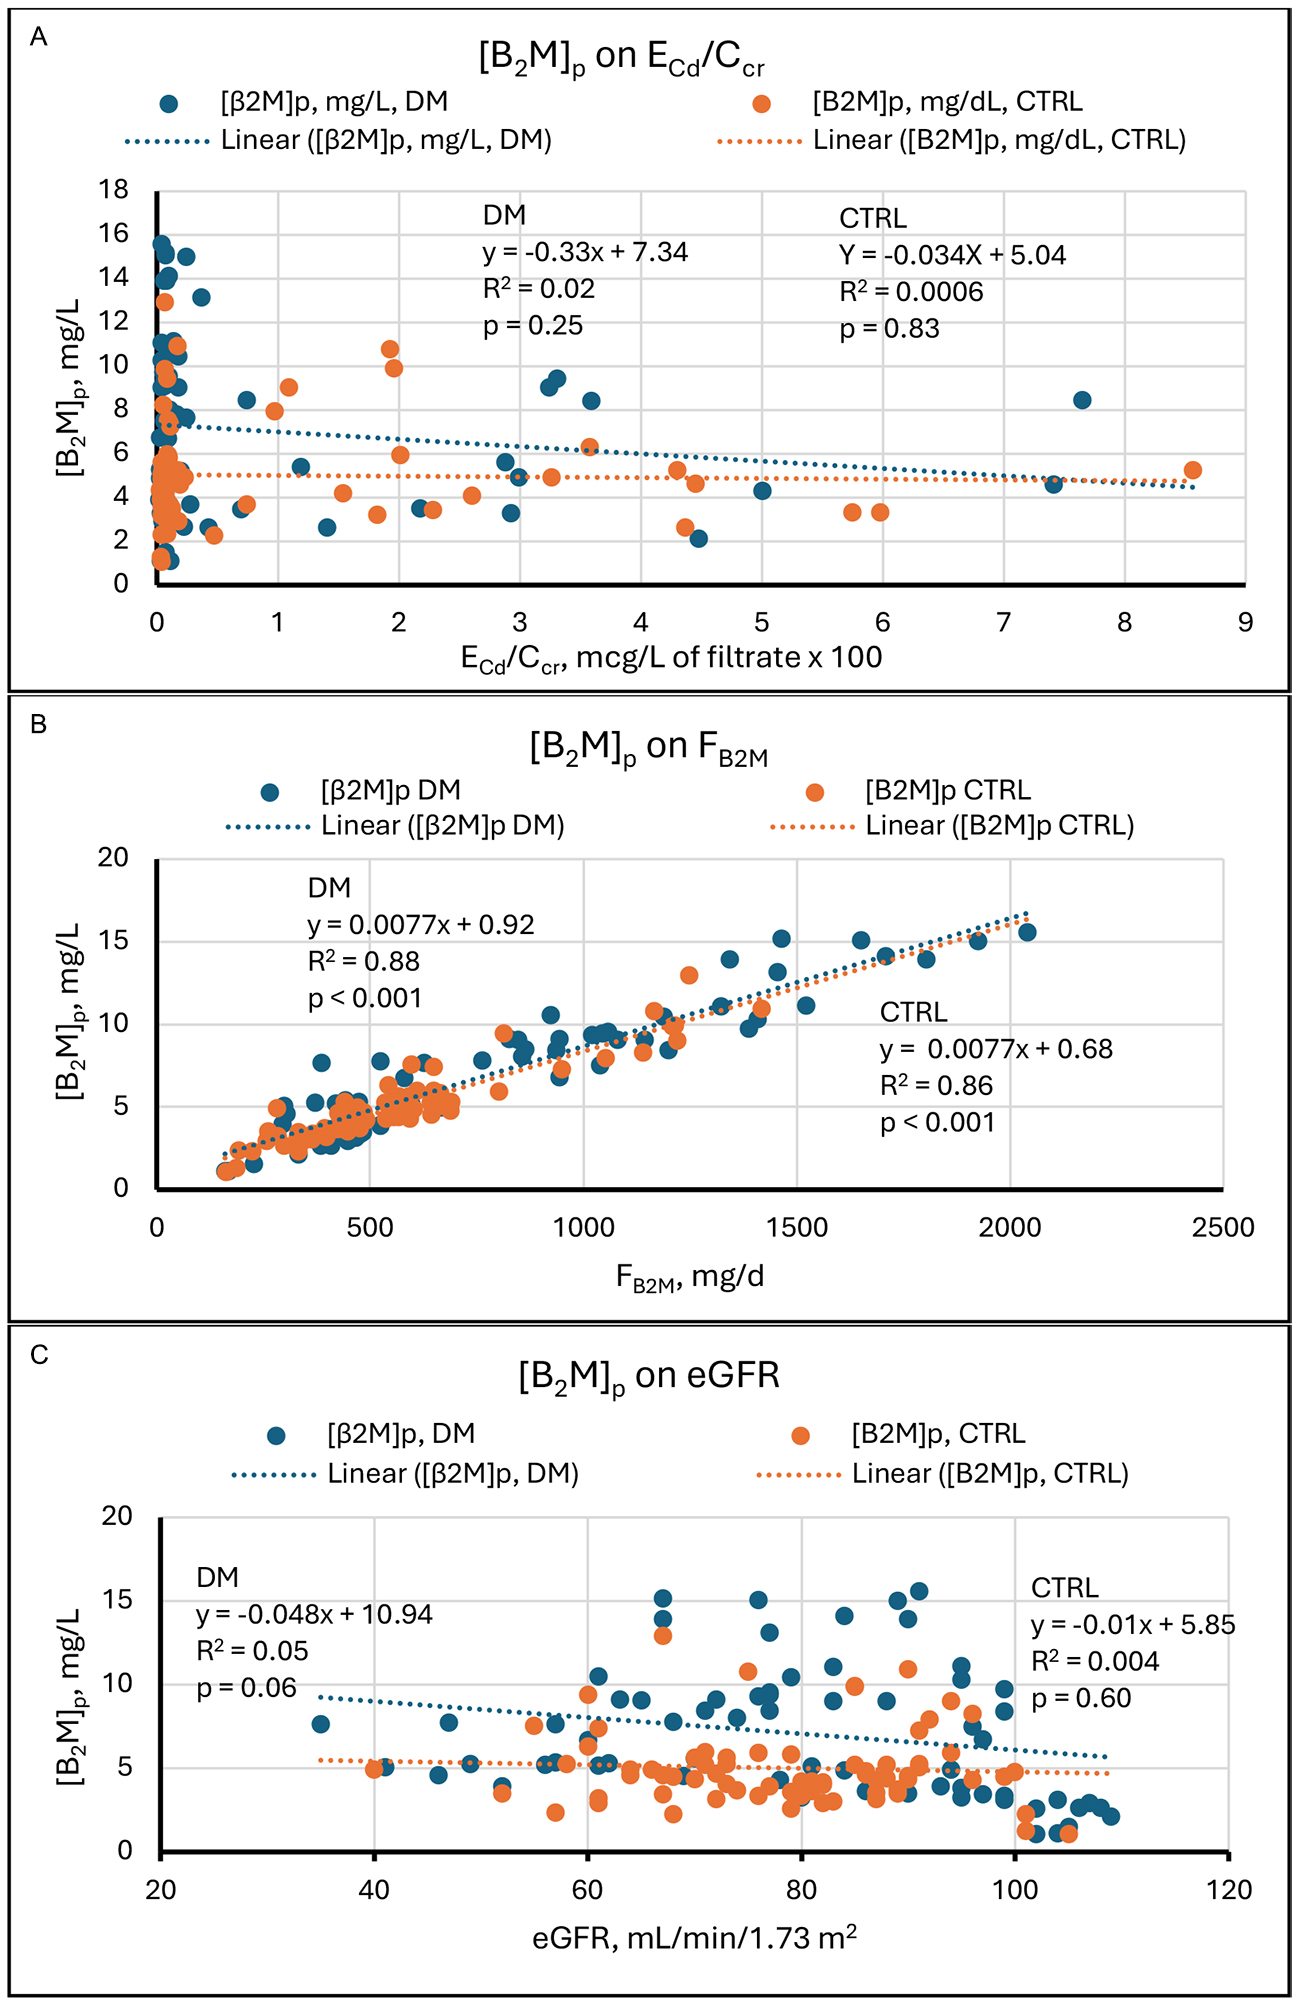
Figure 3. Linear regressions of [β2M]s on potential determinants. Scatter diagrams present data from diabetics (DM, blue) and non-diabetic controls (CTRL, orange). The graphs plot [β2M]s against (A) ECd/Ccr, (B) Fβ2M, and (C) eGFR. No relationships are evident in (A). Strong direct relationships are evident in both groups in (B). In (C), a weak inverse relationship is evident in DM, and no relationship is evident in CTRL. Cd: Cadmium; cr: creatinine; β2M: β2-microglobulin; [β2M]s: serum concentration of β2M; DM: group with diabetes mellitus; CTRL: control group without diabetes; ECd/Ccr: amount of Cd excreted per volume of glomerular filtrate; Fβ2M: rate of glomerular filtration of β2M; eGFR: estimated glomerular filtration rate.
Increased [β2M]s in diabetics may be of more than academic interest. In an analysis of data from the Third National Health and Nutrition Examination Survey (NHANES III), Cheung et al found in diabetics > 20 years old that [β2M]s was independently predictive of all-cause and diabetes-related mortality[39]. Survival curves of subjects in the highest, intermediate, and lowest tertiles of [β2M]s showed markedly different life expectancies over almost 20 years. The authors argued that these differences might have resulted from pro-inflammatory and amyloidogenic properties of β2M and from cytotoxicity of advanced glycation end products of the protein. In addition to mortality, the severity of diabetes-related morbidities has also been associated with increased [β2M]s[40].
In the present study, one easily overlooked finding emerges from Figures 2 and 3. In CTRL, [β2M]s remained stable as Fβ2M rose proportionately with eGFR [Figure 3C]. We therefore infer that high GFR increased and low GFR decreased Iβ2M, and Figure 2C supports that inference. In DM, the slope of the line relating Fβ2M to eGFR was positive, but the regression was not significant [Figure 2C]; [β2M]s fell as eGFR rose, and the SLR just missed statistical significance [Figure 3C].
Regressions of FrTDβ2M on its determinants
FrTDβ2M is the ratio of the rate of degradation to the rate of filtration of β2M; thus, FrTDβ2M = TDβ2M/Fβ2M. If the numerator and denominator of this ratio are divided by Ccr, FrTDβ2M = (TDβ2M/Ccr)/[β2M]s (equation 7).
In Figure 4, all graphs show that the range of FrTDβ2M was 0.991 to 1 in DM and 0.996 to 1 in CTRL. These observations are consistent with the slightly lower mean FrTDβ2M in DM [Table 2]. FrTDβ2M was inversely but weakly related to ECd/Ccr in both groups [Figure 4A]. R2 values indicate that in DM and CTRL, variation in ECd/Ccr accounted for 11% and 5.8% of variation in FrTDβ2M; in both groups, high and low values of FrTDβ2M were found in subjects with negligible Cd excretion, and statistically significant associations were created by relatively few points. Figure 4A suggests that in a minority of both groups, Cd impaired proximal tubular degradation of β2M. However, it is also true that the 13 lowest values of FrTDβ2M were seen in diabetics, and only four of them exhibited exceptional Cd excretion. We infer that an unidentified effect of diabetes compromised tubular processing of β2M in some subjects.
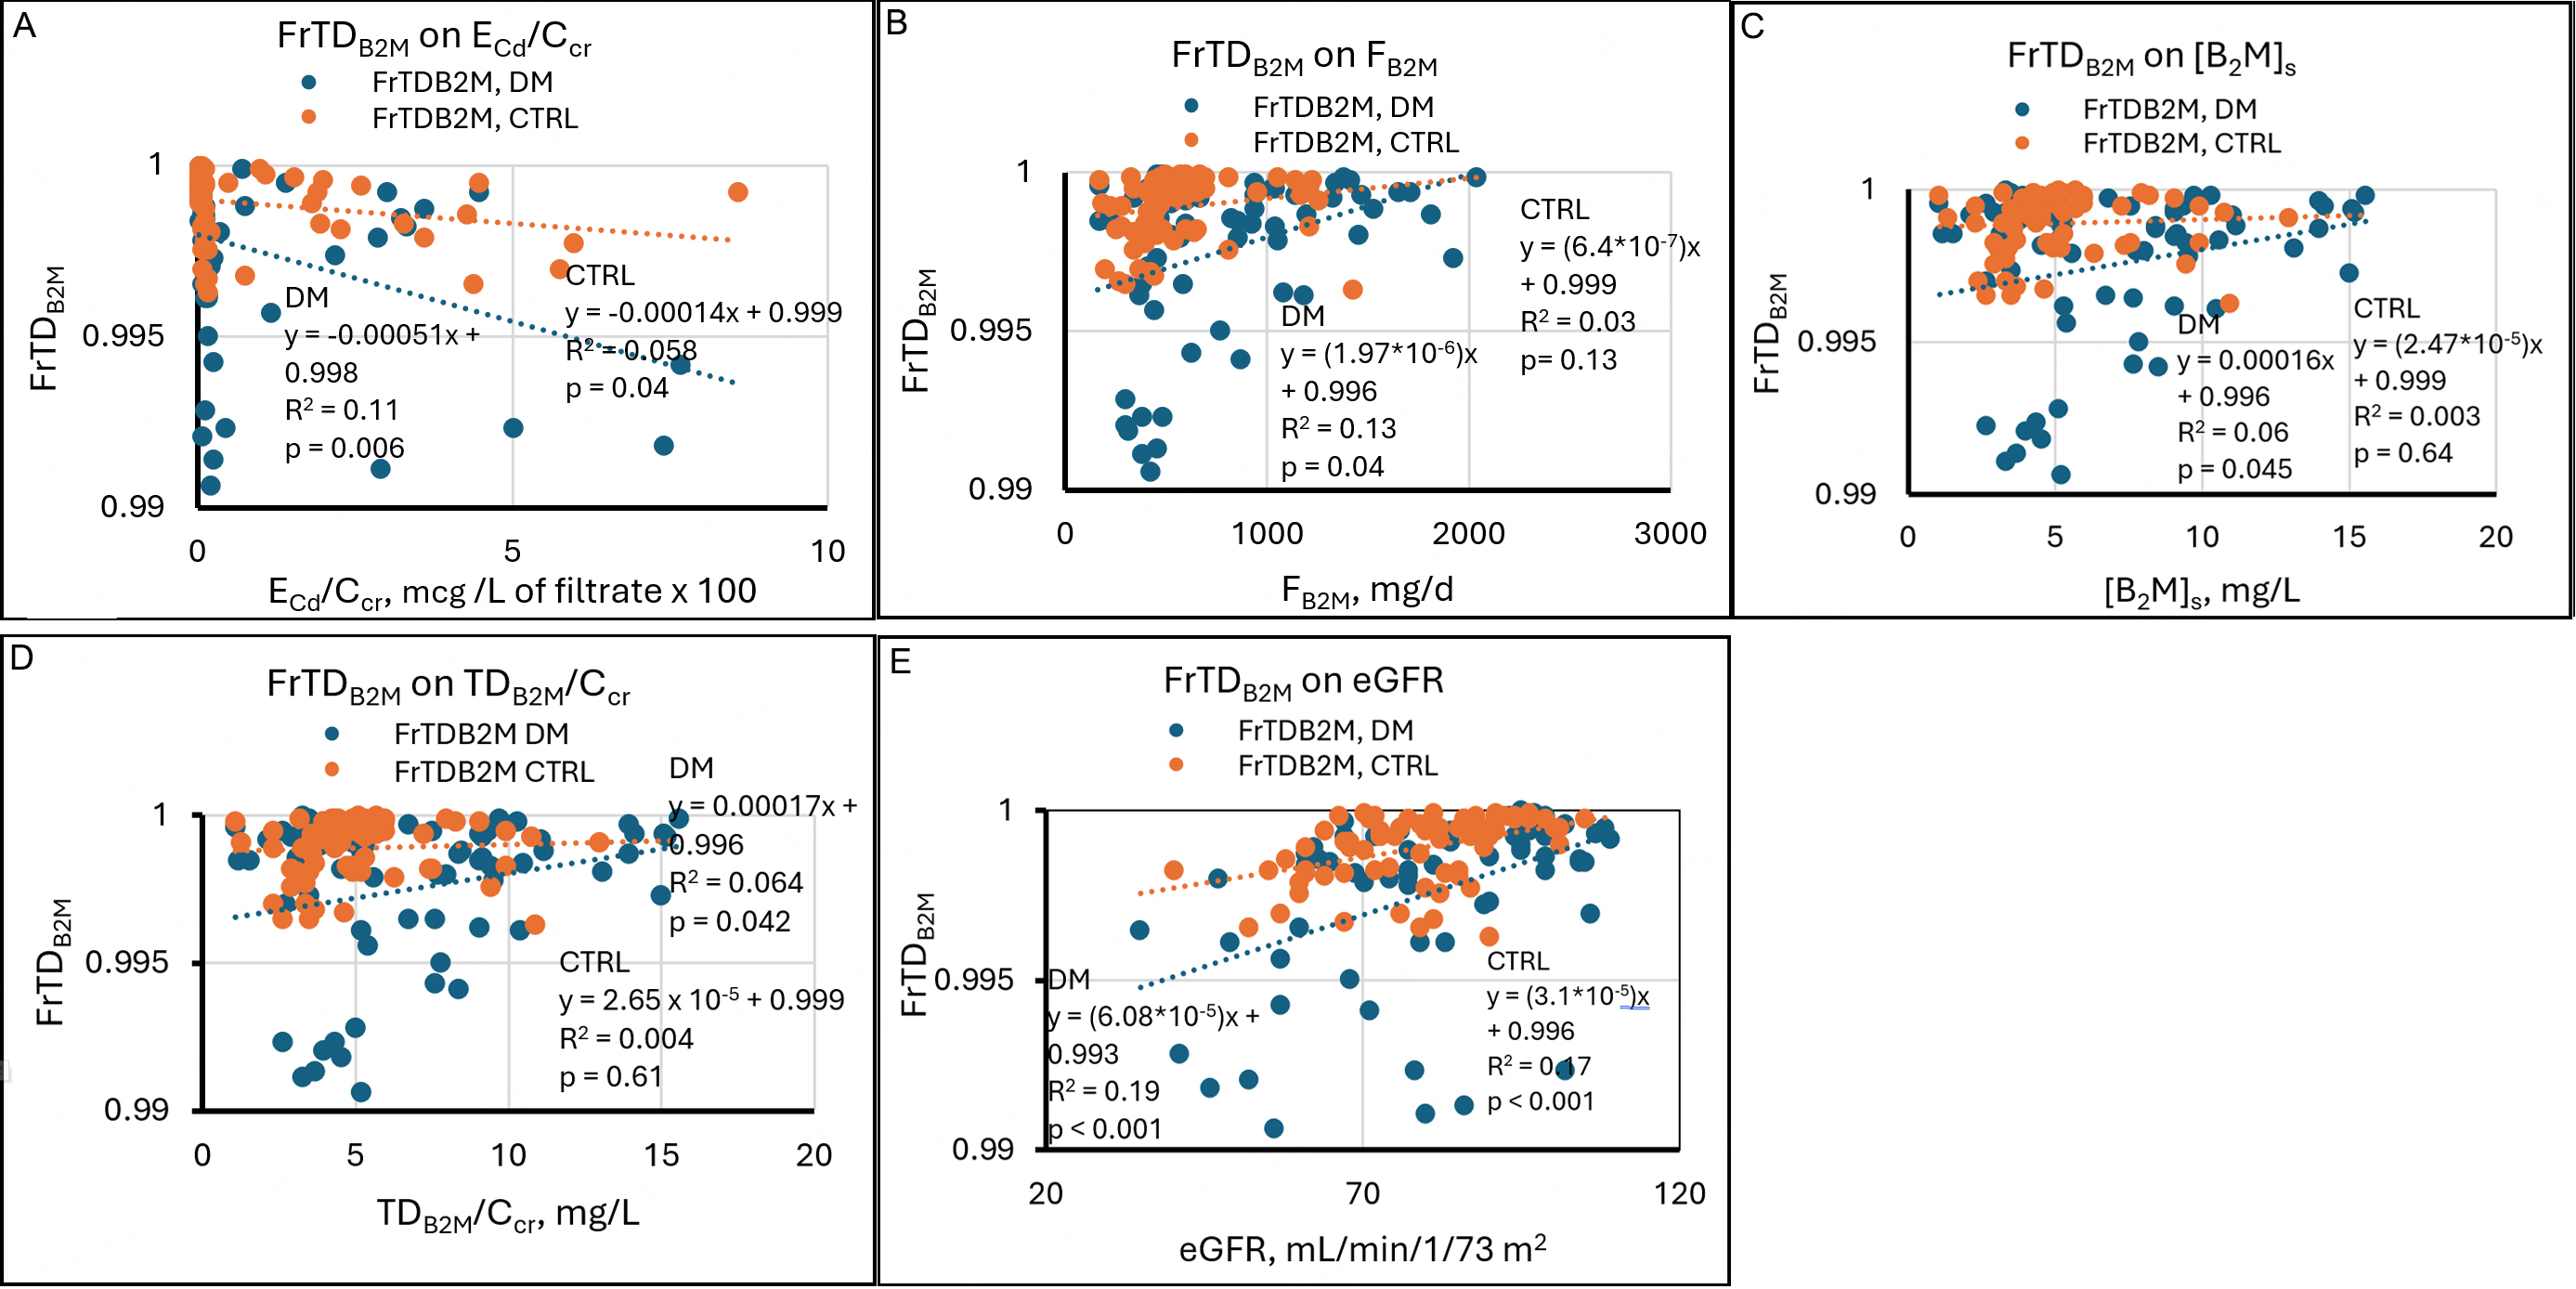
Figure 4. Linear regressions of FrTDβ2M on potential determinants. Scatter diagrams present data from diabetics (DM, blue) and non-diabetic controls (CTRL, orange). The graphs plot FrTDβ2M against (A) ECd/Ccr, (B) Fβ2M, (C) [β2M]s, (D) TDβ2M/Ccr, and (E) eGFR. Inverse relationships are evident in both groups in (A). In (B), a weak direct relationship is evident in DM, and no relationship is evident in CTRL. That pattern is repeated in (C) and (D). Direct relationships are evident in both groups in (E). Cd: Cadmium; cr: creatinine; β2M: β2-microglobulin; FrTDβ2M: fractional tubular degradation of filtered β2M; DM: group with diabetes mellitus; CTRL: control group without diabetes; ECd/Ccr: amount of Cd excreted per volume of glomerular filtrate; Fβ2M: rate of glomerular filtration of β2M; [β2M]s: serum concentration of β2M; TDβ2M/Ccr: amount of β2M undergoing tubular degradation per volume of glomerular filtrate; eGFR: estimated glomerular filtration rate.
FrTDβ2M varied directly with Fβ2M, [β2M]s, and TDβ2M/Ccr in DM but was not significantly related to these parameters in CTRL [Figure 4B-D]. The SLRs in CTRL make mathematical sense because the numerator and denominator of FrTDβ2M, TDβ2M/Ccr, and [β2M]s were virtually identical throughout their ranges, and Fβ2M was primarily a function of [β2M]s. A small cluster of diabetics with simultaneous reductions of
FrTDβ2M varied directly and significantly with eGFR in DM and CTRL [Figure 4E]; in other words, FrTDβ2M was lowest at low eGFR and highest at high eGFR in both groups. In SLRs, high ECd/Ccr, low eGFR, and DM appeared to reduce FrTDβ2M [Figure 4]; the effects of Cd and DM were sporadic, and the effect of eGFR was somewhat more uniform [Figure 4A and E]. In DM, an MLR showed persistent associations of FrTDβ2M with ECd/Ccr, Fβ2M, [β2M]s, and eGFR; in CTRL, an MLR showed continued association of FrTDβ2M with eGFR but not with ECd/Ccr [Table 4]. Thus, in CTRL, a relationship between eGFR and ECd/Ccr [Figure 1] explained the significant regression of FrTDβ2M on ECd/Ccr. In DM, ECd/Ccr persisted as an independent determinant of FrTDβ2M because Cd caused a miniscule but statistically significant reduction in FrTDβ2M in a few subjects [Figure 4A]. [β2M]s and its two determinants, Iβ2M (Fβ2M) and eGFR, retained independent effects on FrTDβ2M in DM [Table 4].
The relationships between FrTDβ2M and eGFR in the two groups were unexpected. Because TDβ2M/Ccr =
The relatively low values of R2 for MLRs in Figure 4 suggest that in both DM and CTRL, most of the variation of FrTDβ2M was driven by unidentified factors [Table 4]. Although this variation was discernible, we reiterate that it occurred within tenths of a percentage point in our sample. A multiple regression model in which age, body mass index, smoking, and gender were included provided no additional insight into determinants of FrTDβ2M (data not shown).
Regressions of TDβ2M/Ccr on its determinants
TDβ2M/Ccr quantifies the amount of β2M reabsorbed and degraded by proximal tubules per volume of filtrate. In theory, if a maximum capacity for β2M reabsorption exists, TDβ2M/Ccr reaches a plateau at sufficiently increased Fβ2M (Iβ2M), and Eβ2M/Ccr rises thereafter in parallel with Fβ2M. If a tubular maximum does not exist, or if it exceeds all Fβ2M, then TDβ2M/Ccr consistently rises in parallel with Fβ2M.
Because Cd injures proximal tubular cells, we speculated that TDβ2M/Ccr might reach a plateau in sufficiently intoxicated subjects. However, Figure 5A demonstrates that TDβ2M/Ccr was unrelated to ECd/Ccr in DM and CTRL. In both groups, the highest and lowest values of TDβ2M/Ccr were seen at the lowest values of ECd/Ccr, and intermediate values of TDβ2M/Ccr were seen at the highest values of ECd/Ccr. TDβ2M/Ccr rose linearly with Fβ2M and did not reach a plateau [Figure 5B]. TDβ2M/Ccr was virtually identical to [β2M]s at all values of [β2M]s [Figure 5C]; this finding resulted from the calculation of TDβ2M/Ccr as [β2M]s - Eβ2M/Ccr (equation 5), and from the fact that Eβ2M/Ccr was 0.01 to 0.001 of [β2M]s in all subjects.
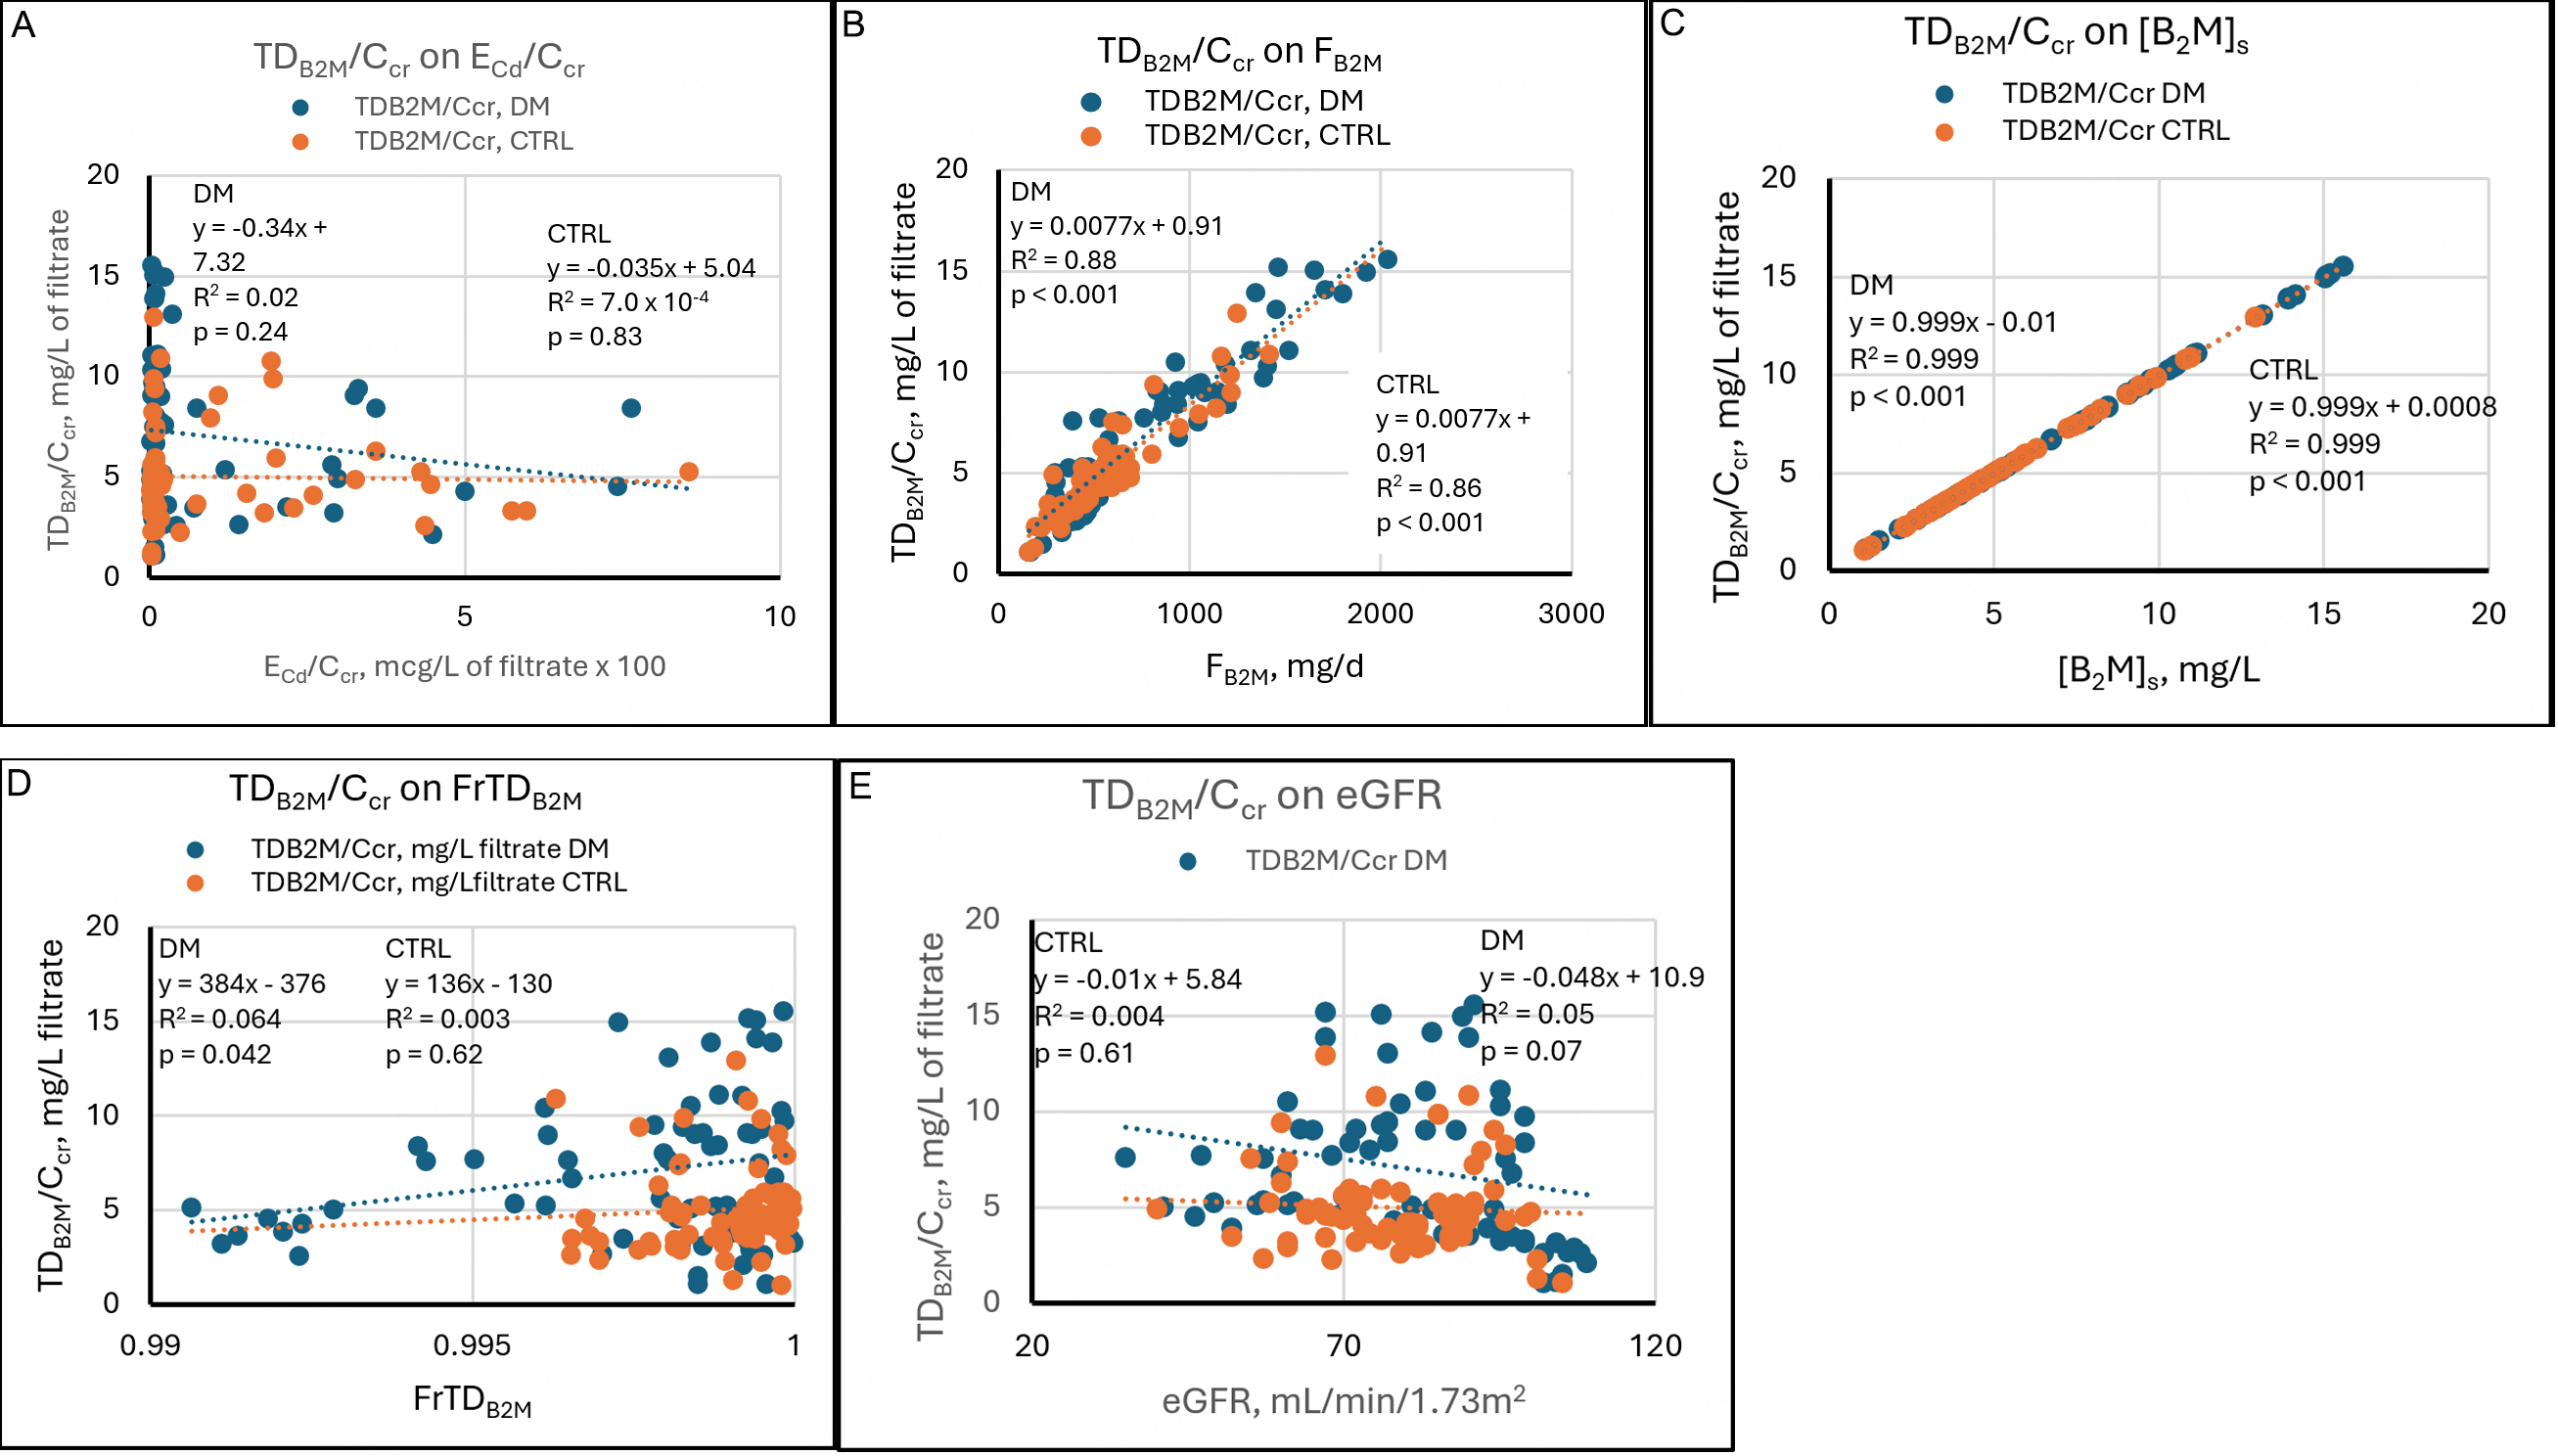
Figure 5. Linear regressions of TDβ2M/Ccr on potential determinants. Scatter diagrams present data from diabetics (DM, blue) and non-diabetic controls (CTRL, orange). The graphs plot TDβ2M/Ccr against (A) ECd/Ccr, (B) Fβ2M, (C) [β2M]s, (D) FrTDβ2M, and (E) eGFR. No relationships are evident in (A). Strong direct relationships are evident in both groups in (B) and (C). In (D), a direct relationship is evident in DM, and no relationship is evident in CTRL. In (E), a marginal inverse relationship is evident in DM, and no relationship is evident in CTRL. Cd: Cadmium; cr: creatinine; β2M: β2-microglobulin; TDβ2M/Ccr: amount of β2M undergoing tubular degradation per volume of glomerular filtrate; DM: group with diabetes mellitus; CTRL: control group without diabetes; ECd/Ccr: amount of Cd excreted per volume of glomerular filtrate; Fβ2M: rate of glomerular filtration of β2M; [β2M]s: serum concentration of β2M; FrTDβ2M: fractional tubular degradation of filtered β2M; eGFR: estimated glomerular filtration rate.
TDβ2M/Ccr was weakly related to FrTDβ2M in DM and unrelated to FrTDβ2M in CTRL [Figure 5D]. The relationship in DM was created by points from eight subjects with atypically low FrTDβ2M and TDβ2M/Ccr at the low end of the observed range. The weakness of the relationship in DM and its absence in CTRL were due to the primacy of Iβ2M in determining [β2M]s and TDβ2M/Ccr. TDβ2M/Ccr was weakly and inversely related to eGFR in DM and unrelated to eGFR in CTRL [Figure 5D]. We have no explanation for this difference.
In DM, SLRs showed that TDβ2M/Ccr was directly related to Fβ2M, [β2M]s, and FrTDβ2M [Figure 5]; in an MLR, [β2M]s and FrTDβ2M persisted as independent determinants of TDβ2M/Ccr, and Fβ2M did not [Table 4]. In CTRL, TDβ2M/Ccr was directly related to Fβ2M and [β2M]s but not FrTDβ2M; an MLR showed persistence of both associations, but the p-value for the association of TDβ2M/Ccr with [β2M]s was much lower (i.e., the association was more significant). In both groups, [β2M]s, the sum of Eβ2M/Ccr + TDβ2M/Ccr, was the predominant determinant of TDβ2M/Ccr because [β2M]s and TDβ2M/Ccr were virtually equal.
Regressions of Eβ2M/Ccr on its determinants
Figure 6 depicts the relationships between Eβ2M/Ccrv - the amount of β2M excreted per volume of filtrate - and relevant variables. While Eβ2M was clearly related to ECd in more severely intoxicated subjects[7,35], we found in the present study that EB2M/Ccr was weakly and directly related to ECd/Ccr in DM and unrelated to ECd/Ccr in CTRL [Figure 6A]. Eβ2M/Ccr was equally related to Fβ2M and [β2M]s in CTRL (R2 = 0.11 for both SLRs), but unrelated to those variables in DM [Figure 6B and C]. EB2M/Ccr rose with TDB2M/Ccr in CTRL and was unrelated to TDB2M/Ccr in DM [Figure 6E].
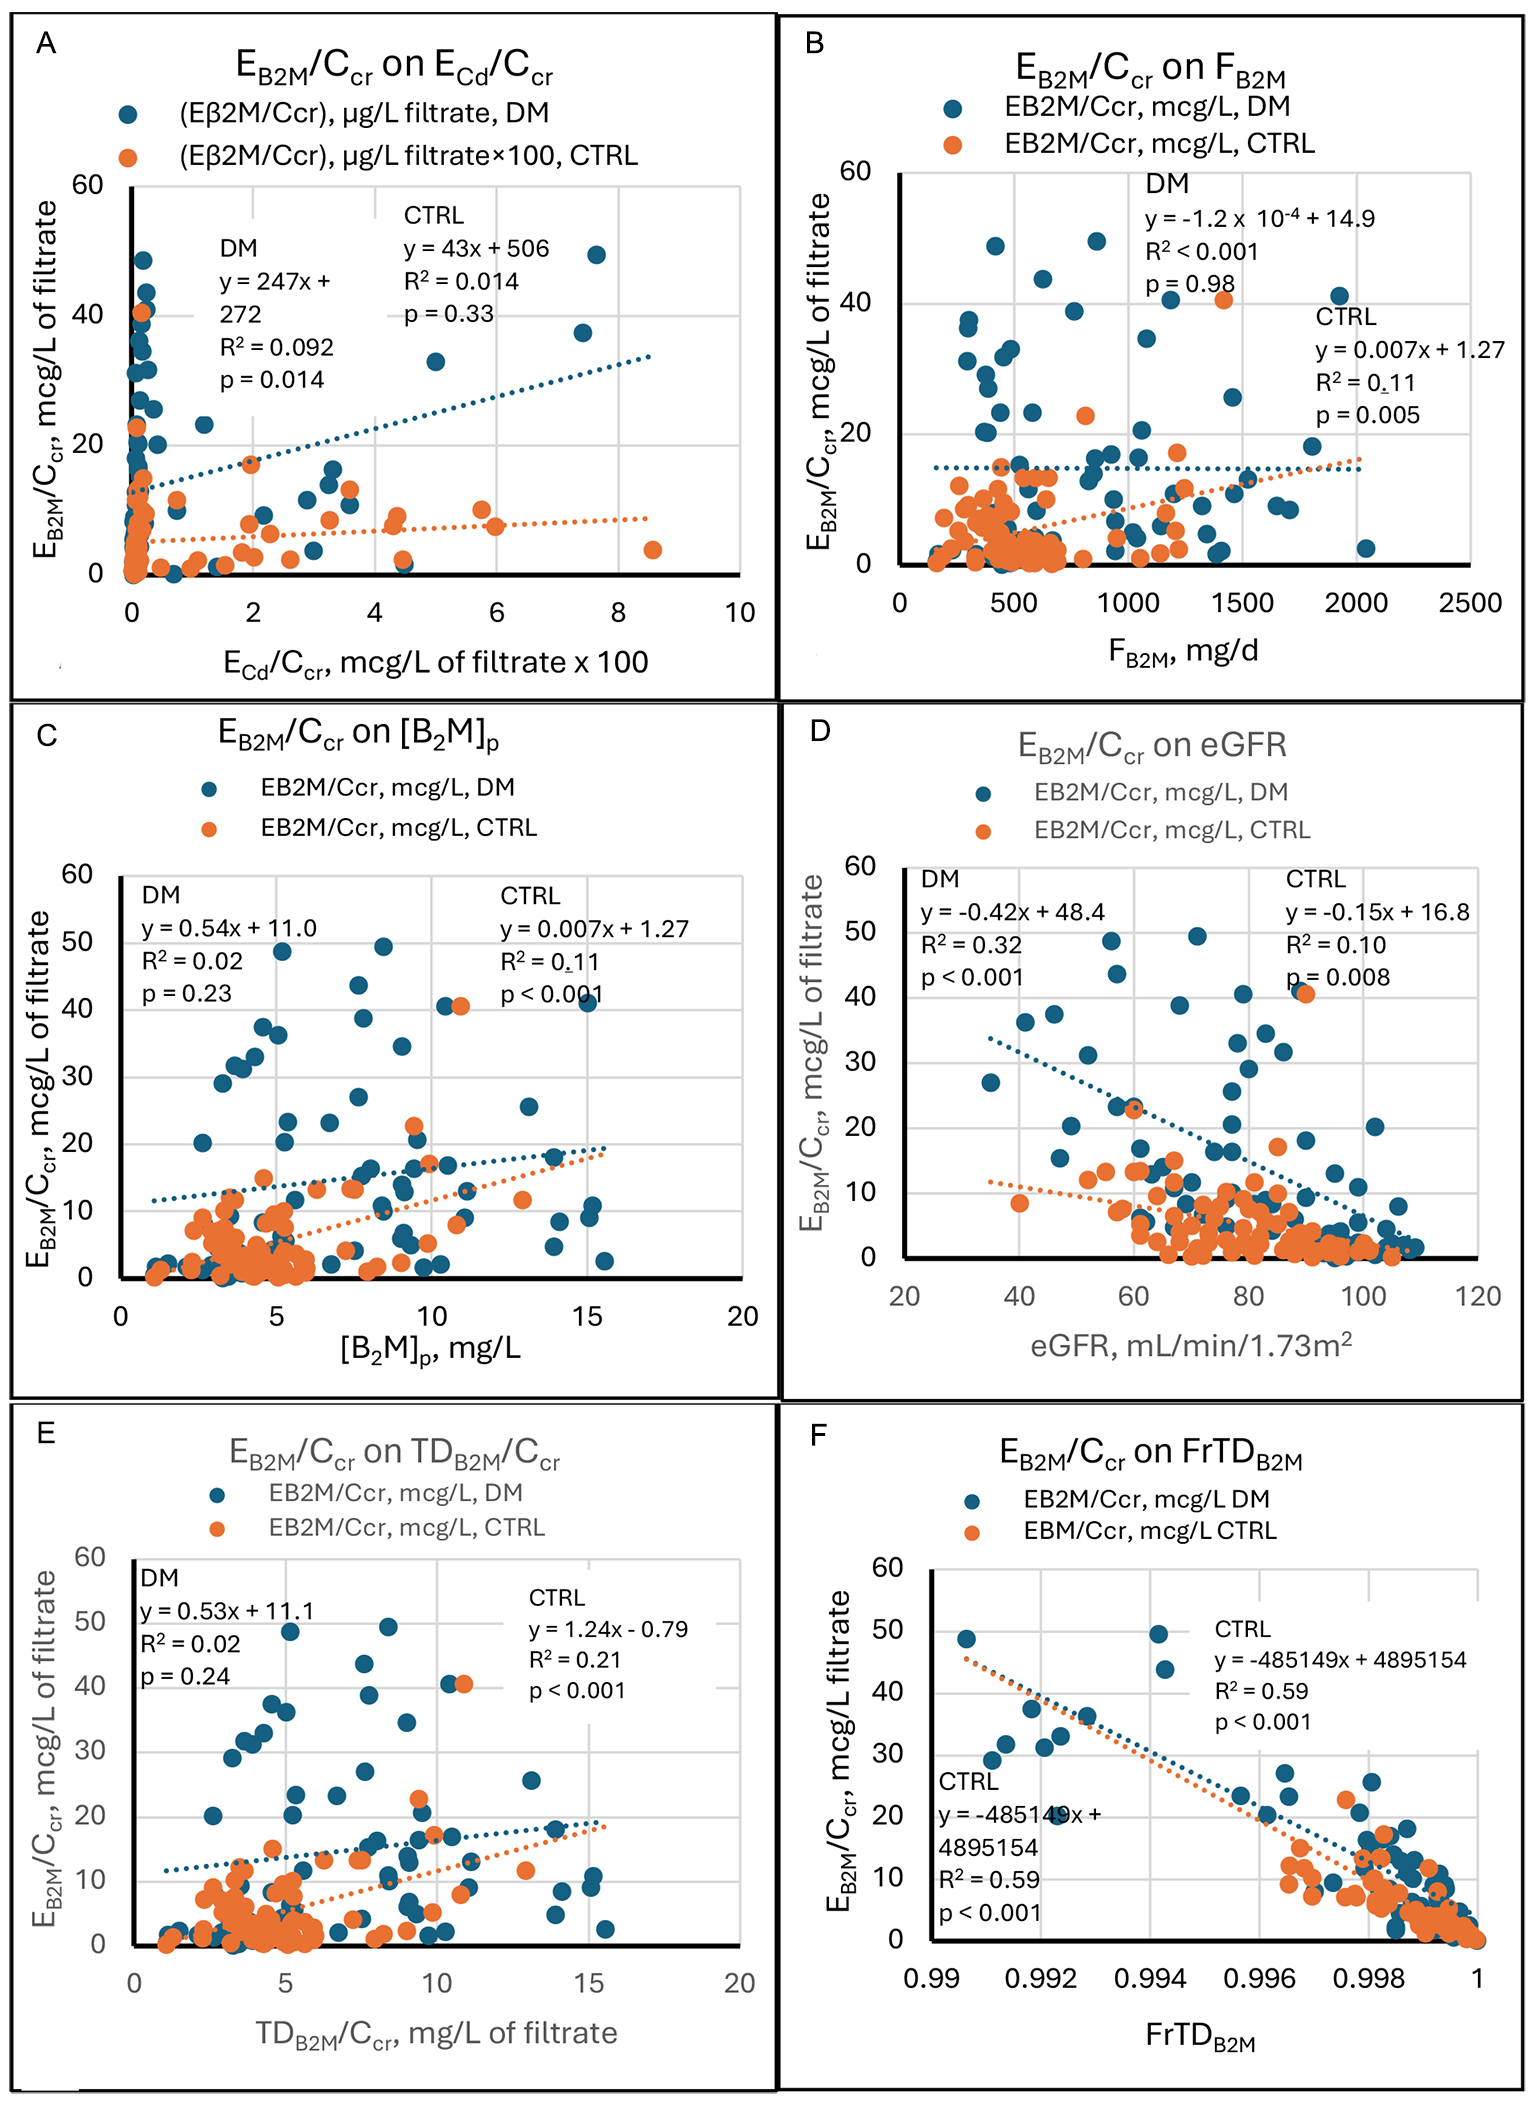
Figure 6. Linear regressions of Eβ2M/Ccr on potential determinants. Scatter diagrams present data from diabetics (DM, blue) and non-diabetic controls (CTRL, orange). The graphs plot Eβ2M/Ccr against (A) ECd/Ccr, (B) Fβ2M, (C) [β2M]s, (D) eGFR, (E) TDβ2M/Ccr, and (F)
At a constant FrTDβ2M, we expect both EB2M/Ccr and TDB2M/Ccr to rise as Fβ2M rises, as occurred in CTRL. Under this hypothetical condition, EB2M/Ccr should correlate with Fβ2M, the mathematical determinants of Fβ2M ([β2M]s and eGFR), and TDB2M/Ccr. SLRs demonstrated those relationships in CTRL but not DM. In an MLR, the relationship between EB2M/Ccr and TDB2M/Ccr persisted in CTRL, while the associations with Fβ2M and [β2M]s were no longer observed [Table 4].
EB2M/Ccr was inversely related to eGFR in DM (R2 = 0.32) and CTRL (R2 = 0.10), and the slope of the line relating the two variables was steeper in DM [Figure 6D]. Similarly, in DM and CTRL, Eβ2M/Ccr was strongly and inversely related to FrTDβ2M, which accounted respectively for 68% and 59% of variation in Eβ2M/Ccr [Figure 6F]. These observations can be understood from equation 9, which states that Eβ2M/Ccr = (1 - FrTDβ2M)[β2M]s. Eβ2M/Ccr falls as FrTDβ2M rises if [β2M]s remains constant; similarly, since [β2M]s = Iβ2M/GFR (equation 2), Eβ2M/Ccr varies inversely with GFR if FrTDβ2M and Iβ2M remain constant.
In DM, approximately 15% of subjects had FrTDβ2M ≤ 0.996; in all but one of these subjects, Eβ2M/Ccr was ≥
MLRs revised some relationships suggested by SLRs [Table 4]. In DM, the regression of Eβ2M/Ccr on ECd/Ccr disappeared, while the regression of Eβ2M/Ccr on eGFR persisted; variation in FrTDβ2M and eGFR then accounted for 73% of the variation in Eβ2M/Ccr. In CTRL, regressions of Eβ2M/Ccr on Fβ2M and [β2M]s disappeared, while the regression of Eβ2M/Ccr on TDβ2M/Ccr persisted; variation in FrTDβ2M, TDβ2M/Ccr, and eGFR then accounted for 85% of the variation in Eβ2M/Ccr. Thus, in MLRs, Eβ2M/Ccr was not related to ECd/Ccr in either group, but it was inversely related to eGFR and especially to FrTDβ2M in both groups, as equation 9 predicts.
Comparison of regressions in DM and CTRL
Table 5 shows that several physiologically important regressions were unaffected by diabetes. SLRs that were significant in both groups included Fβ2M on [β2M]s (and vice versa), FrTDβ2M on ECd/Ccr, FrTDβ2M on eGFR, TDβ2M/Ccr on Fβ2M, TDβ2M/Ccr on [β2M]s, Eβ2M/Ccr on eGFR (inverse), and Eβ2M/Ccr on FrTDβ2M (inverse). In CTRL, ECd/Ccr disappeared as a determinant of FrTDβ2M in an MLR, presumably because of a linkage between eGFR and ECd/Ccr [Figure 1], but all other associations common to the two groups persisted in MLRs [Table 4].
Comparison of simple linear regressions in DM and CTRL
| Regression | Relationship | Regression significant in | |||
| DM, not CTRL | CTRL, not DM | neither group | both groups | ||
| eGFR on ECd/Ccr | Inverse | x | |||
| Fβ2M on ECd/Ccr | None | x | |||
| Fβ2M on [β2M]s | Direct | x | |||
| Fβ2M on eGFR | None | x | |||
| [β2M]s on ECd/Ccr | None | x | |||
| [β2M]s on Fβ2M | Direct | x | |||
| [β2M]s on eGFR | None | x | |||
| FrTDβ2M on ECd/Ccr | Inverse | x | |||
| FrTDβ2M on Fβ2M | Direct | x | |||
| FrTDβ2M on [β2M]s | Direct | x | |||
| FrTDβ2M on eGFR | Direct | x | |||
| TDβ2M/Ccr on ECd/Ccr | None | x | |||
| TDβ2M/Ccr on Fβ2M | Direct | x | |||
| TDβ2M/Ccr on [β2M]s | Direct | x | |||
| TDβ2M/Ccr on FrTDβ2M | Direct | x | |||
| TDβ2M/Ccr on eGFR | None | x | |||
| Eβ2M/Ccr on ECd/Ccr | Direct | x | |||
| Eβ2M/Ccr on Fβ2M | Direct | x | |||
| Eβ2M/Ccr on [β2M]s | Direct | x | |||
| Eβ2M/Ccr on eGFR | Inverse | x | |||
| Eβ2M/Ccr on TDβ2M/Ccr | Direct | x | |||
| Eβ2M/Ccr on FrTDβ2M | Inverse | x | |||
Several notable SLRs were significant in neither group. They included regressions of [β2M]s and TDβ2M/Ccr on ECd/Ccr and eGFR, and the regression of Fβ2M on ECd/Ccr. SLRs of FrTDβ2M on Fβ2M and [β2M]s, TDβ2M/Ccr on FrTDβ2M, and Eβ2M/Ccr on ECd/Ccr were significant in DM but not CTRL. SLRs of eGFR on ECd/Ccr, Fβ2M on eGFR, and Eβ2M/Ccr on Fβ2M, [β2M]s, and TDβ2M/Ccr were significant in CTRL but not DM. These differences probably resulted from wider ranges and greater variability of Iβ2M and FrTDβ2M in DM.
Diabetes appears to have depressed FrTDβ2M in a significant minority of subjects [Figure 4A-E]. The 13 lowest values of FrTDβ2M were seen in DM, and they were not uniformly attributable to high ECd/Ccr or low eGFR. Eβ2M/Ccr rose accordingly in the same subjects [Figure 6F]; a tentative inference from these data is that in some patients, diabetes imposed a small but easily demonstrable limitation on tubular degradation of
Arguments as to whether diabetes enhances the nephrotoxicity of Cd, or vice versa, may be moot. Because GSCβ2M approaches 1[11,12], increased Eβ2M at a given Fβ2M is necessarily a consequence of proximal tubular dysfunction. Glomerular disease does not increase Eβ2M. However, diabetes, which indisputably affects glomeruli, may also impair tubular handling of β2M, and may do so in advance of any increase in albuminuria[22,41]. In non-diabetic subjects, glycosuria promoted β2M excretion acutely, and in diabetics, improvement of glycemic control (and therefore of glycosuria) gradually reduced Eβ2M[23].
Cd toxicity almost certainly causes albuminuria by interfering with the function of megalin, the brush border protein that mediates proximal tubular reabsorption of β2M[14]. A large body of research suggests that GSCalb is high enough, in the range of 10-2, to permit daily filtration of many grams of albumin. All but a few grams are retrieved by the process of fluid phase endocytosis, which is separate from megalin-mediated endocytosis, and returned to the circulation by transcytosis[42-45]. If a large amount of albumin is normally filtered each day, it seems unlikely that microalbuminuria in DM is due to increased permeability of the glomerular barrier[27]. A more logical inference is that β2-microglobulinuria and albuminuria are tubular phenomena in both Cd nephropathy and early diabetic nephropathy. In the present study, the 13 lowest values of FrTDβ2M were seen in DM, and most of the affected subjects exhibited minimal Cd excretion [Figure 4].
Comparison of regressions in women and men
Supplementary Table 1 presents correlations of Fβ2M, FrTDβ2M, and Eβ2M/Ccr with possible determinants in diabetic and control women and men. Fβ2M correlated more closely with eGFR in diabetic and control women than in their male counterparts. FrTDβ2M was less closely associated with ECd/Ccr and eGFR in control men than in diabetic women and men and control women. Eβ2M/Ccr correlated less strongly with eGFR in control men than in diabetic women and men and control women. Eβ2M/Ccr correlated with Fβ2M and TDβ2M/Ccr in control men only. We have no explanation for these gender-related differences.
Strengths and weaknesses
In the present study, we analyzed β2M homeostasis in diabetics and non-diabetics with modest Cd intoxication. To perform the analysis, we employed equations developed from the premise that plasma is normally in equilibrium with respect to β2M. In other words, we assumed that the entry of β2M into plasma is balanced by renal disposition of the protein through tubular degradation and urinary excretion. Equations that followed from this assumption provided guidance in the selection of regressions for examination, and the significant associations that we document confirmed the validity of the framework. To the best of our knowledge, our method for estimating Iβ2M has not been previously employed. We are providing new information concerning the effects of diabetes on β2M homeostasis, the apparent effect of eGFR on Iβ2M in CTRL, the superiority of FrTDβ2M as an indicator of β2M degradation, the clear effect of GFR on FrTDβ2M, the strong inverse relationships of Eβ2M/Ccr to eGFR and FrTDβ2M, and the inevitable inadequacy of excretion-based parameters for precise quantification of tubular β2M handling.
Attributes of the study sample limit the general applicability of our data. Most subjects were not seriously intoxicated with Cd, and documentation of FrTDβ2M > 99% in all participants suggests that tubular effects of Cd and GFR were modest. In contrast, a mean FrTDβ2M of 82.7% was documented in severely intoxicated women in Japan[34]. Although conclusions drawn from the present study may not be applicable to more seriously afflicted individuals, our methods are suitable for the investigation of such subjects.
CONCLUSIONS
Our data support the following conclusions. Flux of β2M from cells into plasma (Iβ2M) was highly variable in DM and CTRL, and the mean Iβ2M was higher in DM. Because Iβ2M strongly influenced other homeostatic parameters, Fβ2M, [β2M]s, TDβ2M/Ccr, and Eβ2M/Ccr were also variable in both groups and higher in DM. At our subjects’ level of Cd intoxication, FrTDβ2M was consistently > 99% and typically > 99.5%. Consequently,
We circumvented the limitations of TDβ2M/Ccr by determining FrTDβ2M (i.e., TDβ2M/Fβ2M, calculated as
In MLRs, Eβ2M/Ccr was unrelated to ECd/Ccr. Eβ2M/Ccr was inversely related to eGFR and especially to FrTDβ2M, but Eβ2M/Ccr varied substantially at a given FrTDβ2M. In an individual subject, Eβ2M/Ccr had no discernible quantitative relationship with FrTDβ2M, which was the least confounded and therefore the most useful descriptor of tubular β2M handling. For quantification of β2M degradation, we recommend FrTDβ2M rather than [β2M]u/[cr]u or Eβ2M/Ccr.
DECLARATIONS
Acknowledgments
The authors thank Dr. Aleksandar Cirovic for his assistance in creating the Graphical Abstract and Diagram 1. The work was supported with resources of Centre for Kidney Disease Research, Translational Research Institute, and Department of Kidney and Transplant Services, Princess Alexandra Hospital, QLD, Australia. It was also supported with resources of the Stratton Veterans Affairs Medical Center, Albany, NY, USA. Opinions expressed herein are those of the authors and do not represent the official position of the United States Department of Veterans Affairs.
Authors’ contributions
Conception and design of the study: Phelps, K. R.; Satarug, S.
Data acquisition: Yimthiang, S.; Pouyfung, P.; Khamphaya, T.
Data curation, analysis, visualization, and interpretation: Phelps, K. R.; Satarug, S.
Writing of the initial and subsequent drafts: Phelps, K. R.; Satarug, S.
Administrative, technical, and material support: Yimthiang, S.; Vesey, D. A.
Review and approval of the final draft: All authors.
Availability of data and materials
The data that support the findings of this study are available from the corresponding author upon reasonable request.
Financial support and sponsorship
None.
Conflicts of interest
Soisungwan Satarug is a Guest Editor for the Special Issue The Health Risks of Heavy Metal Exposure. Soisungwan Satarug was not involved in any steps of editorial processing, notably including reviewer selection, manuscript handling, or decision making. The other authors declared that there are no conflicts of interest.
Ethical approval and consent to participate
The present study was conducted following the principles outlined in the Declaration of Helsinki. Written informed consent to participate in the study was obtained from participants. The Human Research Ethics Committee of Walailak University approved the study protocol (Approval number WUEC-20-132-01, 28 May 2020).
Consent for publication
Not applicable.
Copyright
© The Author(s) 2025.
Supplementary Materials
REFERENCES
1. Watanabe, T.; Kataoka, Y.; Hayashi, K.; Matsuda, R.; Uneyama, C. Dietary exposure of the Japanese general population to elements: total diet study 2013-2018. Food. Saf. 2022, 10, 83-101.
2. Pokharel, A.; Wu, F. Dietary exposure to cadmium from six common foods in the United States. Food. Chem. Toxicol. 2023, 178, 113873.
3. Egger, A. E.; Grabmann, G.; Gollmann-Tepeköylü, C.; et al. Chemical imaging and assessment of cadmium distribution in the human body. Metallomics 2019, 11, 2010-9.
4. Almerud, P.; Zamaratskaia, G.; Lindroos, A. K.; et al. Cadmium, total mercury, and lead in blood and associations with diet, sociodemographic factors, and smoking in Swedish adolescents. Environ. Res. 2021, 197, 110991.
5. Hill, D. T.; Jandev, V.; Petroni, M.; et al. Airborne levels of cadmium are correlated with urinary cadmium concentrations among young children living in the New York state city of Syracuse, USA. Environ. Res. 2023, 223, 115450.
6. Johri, N.; Jacquillet, G.; Unwin, R. Heavy metal poisoning: the effects of cadmium on the kidney. Biometals 2010, 23, 783-92.
7. Satarug, S.; Vesey, D. A.; Ruangyuttikarn, W.; Nishijo, M.; Gobe, G. C.; Phelps, K. R. The source and pathophysiologic significance of excreted cadmium. Toxics 2019, 7, 55.
8. Phelps, K. R.; Gosmanova, E. O. A generic method for analysis of plasma concentrations. Clin. Nephrol. 2020, 94, 43-9.
9. Heymsfield, S. B.; Arteaga, C.; McManus, C.; Smith, J.; Moffitt, S. Measurement of muscle mass in humans: validity of the 24-hour urinary creatinine method. Am. J. Clin. Nutr. 1983, 37, 478-94.
10. Argyropoulos, C. P.; Chen, S. S.; Ng, Y. H.; et al. Rediscovering beta-2 microglobulin as a biomarker across the spectrum of kidney diseases. Front. Med. 2017, 4, 73.
11. Gauthier, C.; Nguyen-Simonnet, H.; Vincent, C.; Revillard, J. P.; Pellet, M. V. Renal tubular absorption of beta 2 microglobulin. Kidney. Int. 1984, 26, 170-5.
12. Norden, A. G.; Lapsley, M.; Lee, P. J.; et al. Glomerular protein sieving and implications for renal failure in Fanconi syndrome. Kidney. Int. 2001, 60, 1885-92.
13. Polesel, M.; Kaminska, M.; Haenni, D.; et al. Spatiotemporal organisation of protein processing in the kidney. Nat. Commun. 2022, 13, 5732.
14. Satarug, S.; Vesey, D. A.; Gobe, G. C.; Phelps, K. R. The pathogenesis of albuminuria in cadmium nephropathy. Curr. Res. Toxicol. 2024, 6, 100140.
15. Zavala-Guevara, I. P.; Ortega-Romero, M. S.; Narváez-Morales, J.; et al. Increased endocytosis of cadmium-metallothionein through the 24p3 receptor in an in vivo model with reduced proximal tubular activity. Int. J. Mol. Sci. 2021, 22, 7262.
16. Thévenod, F.; Herbrechter, R.; Schlabs, C.; et al. Role of the SLC22A17/lipocalin-2 receptor in renal endocytosis of proteins/metalloproteins: a focus on iron- and cadmium-binding proteins. Am. J. Physiol. Renal. Physiol. 2023, 325, F564-77.
17. Bernier, G. M.; Conrad, M. E. Catabolsm of human beta-2-microglobulin by the rat kidney. Am. J. Physiol. 1969, 217, 1359-62.
18. Karlsson, F. A.; Groth, T.; Sege, K.; Wibell, L.; Peterson, P. A. Turnover in humans of beta 2-microglobulin: the constant chain of HLA-antigens. Eur. J. Clin. Invest. 1980, 10, 293-300.
19. Sumpio, B. E.; Maack, T. Kinetics, competition, and selectivity of tubular absorption of proteins. Am. J. Physiol. 1982, 243, F379-92.
20. Peterson, P. A.; Evrin, P. E.; Berggård, I. Differentiation of glomerular, tubular, and normal proteinuria: determinations of urinary excretion of beta-2-macroglobulin, albumin, and total protein. J. Clin. Invest. 1969, 48, 1189-98.
21. Viberti, G. C.; Pickup, J. C.; Jarrett, R. J.; Keen, H. Effect of control of blood glucose on urinary excretion of albumin and beta2 microglobulin in insulin-dependent diabetes. N. Engl. J. Med. 1979, 300, 638-41.
22. Watts, G. F.; Powell, M.; Rowe, D. J.; Shaw, K. M. Low-molecular-weight proteinuria in insulin-dependent diabetes mellitus: a study of the urinary excretion of beta 2-microglobulin and retinol-binding protein in alkalinized patients with and without microalbuminuria. Diabetes. Res. 1989, 12, 31-6.
23. Groop, L.; Mäkipernaa, A.; Stenman, S.; DeFronzo, R. A.; Teppo, A. M. Urinary excretion of kappa light chains in patients with diabetes mellitus. Kidney. Int. 1990, 37, 1120-5.
24. Satarug, S.; Yimthiang, S.; Pouyfung, P.; Khamphaya, T.; Vesey, D. A. Cadmium-induced tubular dysfunction in type 2 diabetes: a population-based cross-sectional study. Toxics 2023, 11, 390.
25. Yimthiang, S.; Vesey, D. A.; Pouyfung, P.; Khamphaya, T.; Gobe, G. C.; Satarug, S. Chronic kidney disease induced by cadmium and diabetes: a quantitative case-control study. Int. J. Mol. Sci. 2023, 24, 9050.
26. Han, E.; Kim, M. K.; Lee, Y. H.; Kim, H. S.; Lee, B. W. Association between nonalbumin proteinuria and renal tubular damage of N-acetyl-β-d-glucosaminidase and its clinical relevance in patients with type 2 diabetes without albuminuria. J. Diabetes. Complications. 2019, 33, 255-60.
27. Thethi, T. K.; Batuman, V. Challenging the conventional wisdom on diabetic nephropathy: is microalbuminuria the earliest event? J. Diabetes. Complications. 2019, 33, 191-2.
28. Adokwe, J. B.; Waeyeng, D.; Suwan, K.; et al. Plant-based diet and glycemic control in type 2 diabetes: evidence from a Thai Health-Promoting Hospital. Nutrients 2024, 16, 619.
29. Xu, R.; Tan, X.; Li, T.; Liu, S.; Li, Y.; Li, H. Norepinephrine-induced AuPd aerogels with peroxidase- and glucose oxidase-like activity for colorimetric determination of glucose. Mikrochim. Acta. 2021, 188, 362.
30. Apple, F.; Bandt, C.; Prosch, A.; Erlandson, G.; Holmstrom, V.; Scholen, J.; Googins, M. Creatinine clearance: enzymatic vs Jaffé determinations of creatinine in plasma and urine. Clin. Chem. , 32, 388-90.
31. Trzcinka-Ochocka, M.; Brodzka, R.; Janasik, B. Useful and fast method for blood lead and cadmium determination using ICP-MS and GF-AAS; validation parameters. J. Clin. Lab. Anal. 2016, 30, 130-9.
32. Hornung, R. W.; Reed, L. D. Estimation of average concentration in the presence of nondetectable values. Appl. Occup. Environ. Hyg. 1990, 5, 46-51.
33. Levey, A. S.; Stevens, L. A.; Schmid, C. H.; et al.; CKD-EPI (Chronic Kidney Disease Epidemiology Collaboration). A new equation to estimate glomerular filtration rate. Ann. Intern. Med. 2009, 150, 604-12.
34. Hayashi, T.; Nogawa, K.; Watanabe, Y.; et al. Benchmark dose of urinary cadmium for assessing renal tubular and glomerular function in a cadmium-polluted area of Japan. Toxics 2024, 12, 836.
35. Satarug, S.; Vesey, D. A.; Nishijo, M.; Ruangyuttikarn, W.; Gobe, G. C.; Phelps, K. R. The effect of cadmium on GFR is clarified by normalization of excretion rates to creatinine clearance. Int. J. Mol. Sci. 2021, 22, 1762.
36. Portale, A. A.; Halloran, B. P.; Morris, R. C. Jr. Dietary intake of phosphorus modulates the circadian rhythm in serum concentration of phosphorus. Implications for the renal production of 1,25-dihydroxyvitamin D. J. Clin. Invest. 1987, 80, 1147-54.
37. Cappuccio, F. P.; Buchanan, L. A.; Ji, C.; Siani, A.; Miller, M. A. Systematic review and meta-analysis of randomised controlled trials on the effects of potassium supplements on serum potassium and creatinine. BMJ. Open. 2016, 6, e011716.
38. Satarug, S.; Phelps, K. R. Cadmium exposure and toxicity. Metal. Toxicology. Handbook. , CRC Press, 2020; pp 219-72.
39. Cheung, C. L.; Lam, K. S.; Cheung, B. M. Serum β-2 microglobulin predicts mortality in people with diabetes. Eur. J. Endocrinol. 2013, 169, 1-7.
40. Kim, M. K.; Yun, K. J.; Chun, H. J.; et al. Clinical utility of serum beta-2-microglobulin as a predictor of diabetic complications in patients with type 2 diabetes without renal impairment. Diabetes. Metab. 2014, 40, 459-65.
41. Poortmans, J.; Dorchy, H.; Toussaint, D. Urinary excretion of total proteins, albumin, and beta 2-microglobulin during rest and exercise in diabetic adolescents with and without retinopathy. Diabetes. Care. 1982, 5, 617-23.
42. Russo, L. M.; Sandoval, R. M.; McKee, M.; et al. The normal kidney filters nephrotic levels of albumin retrieved by proximal tubule cells: retrieval is disrupted in nephrotic states. Kidney. Int. 2007, 71, 504-13.
43. Dickson, L. E.; Wagner, M. C.; Sandoval, R. M.; Molitoris, B. A. The proximal tubule and albuminuria: really! J. Am. Soc. Nephrol. 2014, 25, 443-53.
44. Comper, W. D.; Vuchkova, J.; McCarthy, K. J. New insights into proteinuria/albuminuria. Front. Physiol. 2022, 13, 991756.
Cite This Article
How to Cite
Download Citation
Export Citation File:
Type of Import
Tips on Downloading Citation
Citation Manager File Format
Type of Import
Direct Import: When the Direct Import option is selected (the default state), a dialogue box will give you the option to Save or Open the downloaded citation data. Choosing Open will either launch your citation manager or give you a choice of applications with which to use the metadata. The Save option saves the file locally for later use.
Indirect Import: When the Indirect Import option is selected, the metadata is displayed and may be copied and pasted as needed.
About This Article
Special Issue
Copyright

Data & Comments
Data
0


Comments
Comments must be written in English. Spam, offensive content, impersonation, and private information will not be permitted. If any comment is reported and identified as inappropriate content by OAE staff, the comment will be removed without notice. If you have any queries or need any help, please contact us at [email protected].