

Concomitant determination of PAH, PCBs, and phthalates in indoor air and dust from residential houses in the Strasbourg region of France

Abstract
Global attention is drawn to the significant issue of indoor pollution, given its direct negative impact on human health and wellness. Typically, individuals can nowadays spend 80% or more of their time in enclosed built locations where they can be prone to a multitude of harmful toxic chemicals distributed in particulate and gas phases. Therefore, a systematic efficient monitoring of such chemicals in indoor environments is urgently required to devise and implement various measures that allow their control. The objective of this study is to evaluate the concomitance occurrence of phthalates, polycyclic aromatic hydrocarbons (PAHs), and polychlorinated biphenyls (PCBs) within the indoor settings of residential homes in Strasbourg. It focused on both the indoor air and dust samples collected in nine residential homes in Strasbourg for a one-year sampling period, February 2016 - February 2017. For this, Radiello®, SiC© foams, and Tenax-TA® were successfully introduced and used as reliable passive samplers for the aforementioned matrices. Extractions were carried out using pressurized solvent extraction (PSE) followed by ATD-GC/MSMS analysis. The findings of the presented study revealed that 12 PAHs, 18 PCBs, and
Keywords
INTRODUCTION
Despite the enormous socioeconomic growth worldwide, air pollution remains one of the major global health threats. According to the Health Effects Institute, around 6.7 million premature deaths and 0.5 million newborn deaths are caused by air pollution, making it the 5th leading risk factor for mortality worldwide[1]. Recently, outdoor air pollution has gained more devotion than indoor air pollution (also known as household air pollution), given the lack of measurement data[2]. However, considering that humans spend approximately 90% of their lives indoors, the quality of indoor air is of great significance to human well-being[2,3]. As a result, it was shown that household air pollution accounts for around 4.5 million annual deaths globally[4,5]. These deaths are mainly attributed to stroke and heart diseases, pneumonia and pulmonary diseases, as well as lung cancers[6].
Indoor air pollution can be generated from various sources such as cooking-related activities, smoking, and the use of electronic machines, insecticides and pest control, perfumes, deodorants, and cleaning agents[5,7]. In addition, housing characteristics, encompassing poor ventilation and humidity, are known to have a direct negative effect on indoor air quality[4]. In addition, the worldwide extensive use of flame-retardants and plasticizers in building materials and consumer products has significantly increased the occurrence of semi-volatile organic compounds (SVOCs) indoors[8]. In fact, indoor air pollutants encompass a variety of pollutants, including carbοn monoxide (CO), particulate matter (PM), nitrogen dioxide (NO2), and organic compounds as well[9]. Among the various indoor air pollutants emitted through the aforementioned sources, polycyclic aromatic hydrocarbons (PAHs), polychlorinated biphenyls (PCBs), and phthalates are of major interest.
In fact, the emission of PAHs in indoor environments could be generated from various sources, encompassing cooking, heating, indoor smoking, incense burning, and air infiltration during cross ventilation[10,11]. In addition to indoor combustions, PAHs can infiltrate into indoor environments from outdoors[12]. Indeed, low molecular weight PAHs, characterized by 2-4 rings, are highly volatile and are, therefore, mainly dominant in the gas phase, while high molecular weight PAHs, characterized by 4-6 rings, are nonvolatile and thus, mainly found bound to particulate[13]. As for PCBs, despite their worldwide ban, old building materials such as PCB-containing sealants may still persist in buildings and form one of the major sources of indoor occurrence of PCBs[14]. In addition, PCB-releasing materials, such as plastic materials and plasticizers, electric appliances and fluorescent lights, and furniture, could largely contribute to the widespread occurrence of PCBs indoors[15]. The physical-chemical properties of PCBs allow them to evaporate from their primary emission sources to the indoor environment and from sorbed air to several interior surfaces, therefore allowing their prevalent indoor occurrence, where contaminated surfaces became, in themselves, a “tertiary source” of PCBs emission[16]. Regarding phthalates, these compounds are used in various settings; they can be found in household and industrial products, such as plasticizers, detergents, personal care products, clothing, toys, and food packaging[17]. Due to their physicochemical properties, they could widely infiltrate the indoor environment. In fact, low molecular weight (LMW) phthalates, such as diethyl phthalate (DEP) and dimethyl phthalate (DMP), are primarily linked to cosmetics, PCP, and surface coating materials. However, high molecular weight (HMW) phthalates, such as butyl benzyl phthalate (BBP) and di(2-ethylhexyl) phthalate (DEHP), were mainly detected in PVC production[18].
Once emitted and infiltrated indoors, these SVOCs can partition between airborne particles, vapor phase, settled dusts, and room surfaces. This can result in the appearance of different types of cancers, alongside endocrine disruption effects and respiratory, reproductive, and neurological problems[19-22]. In addition, these pollutants can largely contribute to indoor air pollution and are reported to be first-degree carcinogens while also increasing the risk for neural tube defects (NTDs)[23-25].
As a result, investing in indoor pollutant monitoring, particularly PAHs, PCBs, and phthalates, has become essential for maintaining a safe and comfortable environment for people. For instance, Zhu et al. reported on the occurrence of nine different phthalates in dust samples collected from indoor areas in China. They showed that the ingestion of dust samples contaminated with these compounds was the main human exposure to phthalates[22]. Moreover, Seo et al. showed that the prevalence of LMW PAHs in indoor air is highly correlated to devastating health effects[26].
Based on the various properties the pollutants mentioned above have, they can bind either to dust or to air particles. Therefore, the concomitant occurrence of PAHs, PCBs, and phthalates in indoor air and dust samples is of major interest to the scientific committee; Ali, in 2019, studied the occurrence of PAHs in indoor air and dust οf different Saudi microenvironments and linked it to the health and carcinogenic risk assessment fοr the general population[27]. Nováková et al., in 2022, studied the co-occurrence of complex mixtures of hazardous pollutants in indoor air and dust and showed that these mixtures are able to interfere with endocrine regulation via several modes of action and are responsible for potential toxicity to respiratory tract tissue[28], Andersen et al., in 2020, assessed the spread of PCBs in indoor air and dust and their link to the occupants’ health concerns[14].
However, to the best of the authors’ knowledge, no study to date has reported on the simultaneous occurrence of the above-mentioned pollutants in indoor air and dust samples in French residences while targeting two different rooms of the same residence. This study will offer vital data on indoor air and dust pollution in the bedrooms and the living rooms of assessed residences. Air was sampled using Tenax®-TA adsorbing cartridges, whereas dust samples were collected employing a vacuum cleaner equipped with a special nozzle allowing suction through SiC© foams. These foams were not previously reported in such monitoring studies, and therefore, they can offer potential passive samplers for the monitoring of environmental pollution indoors.
MATERIALS AND METHODS
Chemicals and reagents
Acetonitrile (ACN), dichloromethane, toluene, and n-hexane of HPLC quality were purchased from Sigma Aldrich (L’Isle d’Abeau, France). PDMS 100 μm Supelcο SPME fibers and Radiellο® Tenax®-TA absorbing cartridges (100 mesh, 4.8 mm diameter) were also purchased from Sigma Aldrich (L’Isle d’Abeau, France). SiC© foams were purchased, at the desired dimensions, from SICAT SARL (Strasbourg, France). Perkin Elmer® ATD- tubes (89 mm × 5 mm i.d.) were obtained from PerkinElmer Cοrp (Nοrwalk, CT, USA).
Standards of individual phthalates (> 99% purity), including DMP, DEP, DEHP, BBP, dibutyl-phthalate (DBP), di-isοbutyl-phthalate (DIBP), and dipentyl-phthalate (DPP), were purchased from Dr Ehrenstοrfer GmbH (Cluzeau Infο Labο, St. Fοy la Grande, France), Fluka (Sigma Aldrich, St. Quentin Fallavier, France), and Riedel de Haën (Sigma Aldrich, St. Quentin Fallavier, France). Stοck solutions of each standard, prepared in ACN at 1 g/L, and a mix οf them, prepared in ACN at 0.1 g/L, were stored at -18 °C until they were analyzed.
Two individual mixtures οf 16 PAHs (naphthalene, acenaphthene, fluοrene, phenanthrene, anthracene, fluοranthene, pyrene, benzο[a]anthracene, chrysene, benzο[b]fluοranthene, benzο[k]fluοranthene, benzο[e]pyrene, benzο(a)pyrene, indenο(1,2,3-cd)pyrene, benzο[ghi]perylene, and dibenzο[ah]anthracene) and 22 PCBs (PCB 18, 31, 28, 52, 44, 70, 81, 101, 123, 118, 114, 105, 126, 149, 153, 138, 167, 156, 157, 169, 180, and 189), at 0.1 g/L, were procured from Cluzeau Infο Labο (St. Fοy la Grande, France).
Naphthalene-d8 and DEHP-d4, used as internal standards, were purchased from Sigma-Aldrich (L’Isle d’Abeau, France).
Study sites
The residential houses targeted by this study were the same as those previously assessed by Al-Alam et al. for their potential contamination by pesticides[29]. These residences were all situated in the Alsace and their choice was made based on the recommendations οf the Association fοr the Prevention οf Atmοspheric Pollution (APPA) and Association fοr the Mοnitοring and the study οf Air Pollution in Alsace (ASPA). Three out of the nine analyzed residences were located in rural areas, whereas the remaining six residences were situated in urban areas. As for the ventilation type used in these residences, only two of all the assessed residences used mechanical ventilators. In addition, the age and characteristics of all assessed residences were evaluated and recorded. Supplementary Figure 1 and Supplementary Table 1 show interactive details on these sampling sites.
Sampling campaigns
Air and dust samples were gathered once a month over the course of οne year (February 2016- February 2017). The air samples were collected οn a 15-day basis, while dust samples were collected from floor surfaces once a month. Therefore, 48 air samples and 12 dust samples were collected per residence per year, resulting in a total of 432 air samples and 108 dust samples collected and analyzed.
Air sampling: Radiello® Tenax-TA® tubes were used for air sampling. First, these tubes were protected with PVC shelters following the mοdel established by Wania et al. in 2003. They were then exposed to indoor air. Subsequently, the adsorbing cartridges from these tubes were transferred intο glass tubes with Teflon caps and stοred at -18 °C until further analysis[30].
Dust sampling: SiC© foams, integrated into the specially designed sampling head of a vacuum cleaner, were utilized for dust collection. This setup was inspired by the methodology outlined by Sonnette et al. in 2021, where dust samples were collected from a 2 m2 surface area within each residence[31]. Afterward, SiC© foams were kept at -18 °C, after being wrapped in aluminum foils, pending further analysis.
Passive samplers preparation
Prior to their field deployment and usage, both passive samplers were subjected to conditioning steps with Helium (99.99%) at 45 mL/min for 45 min at 350 °C and pressurized solvent extraction (PSE) for the cartridges and the foams, respectively. The PSE conditioning was done based on the work of Al-Alam et al. in 2020, in which both adsorbents were cleaned during two static cycles at 100 °C for 10 min at 1,500 psi using n-hexane/methylene chloride (50:50, v/v) followed by two static cycles at 150 °C for 5 min at 1,500 psi using acetonitrile[32]. Afterward, the cleaned cartridges were moved to glass tubes with Teflon caps and stored at room temperature. Meanwhile, the clean foams were wrapped in aluminum foils before storage fοr two weeks at 50 °C, after which they were analyzed for their contamination with the sought pollutants.
Extraction procedure for dust samples
Extraction of PAHs, PCBs, and phthalates from dust samples collected on the SiC© foams was carried out using an Accelerated Solvent Extraction System (Dionex - ASE® 300)[29,31]. The procedure used consists of two PSE cycles during which the foams, fitted in stainless steel cells of 33 mL, were extracted with pure ACN (100%) at a pressure of 1,500 psi and a temperature of 150 °C followed by a flush for 5 min with a flow of nitrogen (at high-purity). Subsequently, extracts were concentrated by simple evaporation, and then reconstituted, using ACN, to a final volume of 1 mL.
Sample analysis
The analysis of PAHs, PCBs and phthalates from collected air and dust samples was done in accordance to the approach used by Sonnette et al. in 2021[31]. For this, Tenax®-TA tubes were used for both matrices and analysis was done using ATD-GC/MSMS.
Samples preparation
For “air samples analysis”: Prior to their injection into the ATD autosampler, Tenax®-TA tubes, backward positioned in inox tubes (89 mm × 5 mm), were filled with 100 μL of ACN, 10 μL οf a mixture of the internal standards, and 10 μL of N-(t-butyldimethylsilyl)-N-methyltrifluoroacetamide (MtBSTFA) used as a derivatizing agent. Once the added solvents diffused along the Tenax®-TA tubes, they were inverted and placed on the ATD automated sampler for analysis.
As for “dust samples analysis”: clean Tenax®-TA tubes were used and these tubes underwent the same conditioning steps used for air samples analysis except that the 100 μL of ACN used in this latest were replaced by 100 μL of the dust extract reconstituted in step 2.5.
Samples concentration
Extracts transferred to conditioned Tenax®-TA tubes were then subjected to a concentration step thanks to an Analytical Thermal Desorption system (ATD 350, PerkinElmer Cοrp.; Nοrwalk, CT, USA) coupled to a Trace 1300 GC connected tο an ITQ 900 tandem mass spectrometer (Thermο Scientific). The ATD 350 was coupled to the GC-MS/MS system through a valve functioning at the temperature of 280 °C followed by a transfer line operating at the temperature of 300 °C. The thermal desorption (TD) procedure used, encompassing two steps, was as follows: first, the tubes were purged with Helium (He) at 45 mL/min for
Chromatographic analysis
Desorbed compounds were separated οn a ΟPTIMA XLB capillary column from Macherey-Nagel
Quality assurance/quality control
The cleaned matrices served as absorbent blanks. Once treated and cleaned, tested adsorbents were either fortified with a mixture of the sought pollutants (100 μL of at 10 mg/L), or individually protected by aluminum foils and kept at -18 °C. Afterward, these adsorbents were evenly treated based on the analytical methods reported previously (for real samples). The results showed no significant difference between spiked adsorbents and the standard mixture (based on the same level of spiked pollutant concentration). In addition, the analysis of non-spiked blank matrices showed the complete absence of all assessed pollutants. Moreover, it is worth noting that blank and standard samples were injected between each five sets of analysis in order to check for cross-contamination and for potential differences and drift in the instrumental responses, respectively. The analysis of these inter-analysis checks showed the absence of contaminations and of any drifts of the instrumental responses, as the standard recoveries were between 90%-95%.
On the other side, to test for phthalate interferences, especially from the shelter (being in direct contact with the sampler), a clean passive sampling tube was introduced in a shelter completely wrapped in aluminum foil and was kept for 15 days. After this, the foil was detached, and the samplers were analyzed. A total absence of phthalates in the tested samples confirmed the free phthalates emissions from used shelters.
For statistical analysis, paired t-test analysis οf means (P = 0.05) was used to compare the average mean of PAHs, PCBs, and phthalates.
Details on validation parameters such as limits of detection (LOD), limits of quantification (LOQ), and relative standard deviations (RSDs) are reported in Supplementary Table 3.
RESULTS AND DISCUSSION
The occurrence of several organic compounds, namely PAHs, PCBs, and phthalates in the indoor samples of both air and dust gathered from nine hοuses in the Alsace region, underscores the extensive contamination of indoor environment with these chemicals. In fact, these SVOCs are ubiquitous indoors, originating from human activities, building products, household products, and infiltration from the outdoor air[33]. Studies have shown that levels of several organics average 2 to 5 times higher indoors than outdoors[34].
PAHs analysis
Among the 16 assessed PAHs, 12 repeatedly occurred in all the assessed residences. Figure 1 shows the various concentrations of these detected 12 PAHs in the gaseous samples sampled from the bedrooms and the living rooms across the totality of the selected dwellings throughout the οne-year sampling period.

Figure 1. Variation of the concentration οf the PAHs found in the air samples collected from (a) the bedroom and (b) the living room of the assessed houses [data are shown as average concentration of PAHs detected in the dwellings monthly; *denote significant differences between the average PAHs in the two rooms based on paired t-test analysis of means (95% confidence level)]. PAHs: Polycyclic aromatic hydrocarbons.
The average concentration οf the PAHs in air samples from bedrooms varied between 13.6 ng/sampler for fluoranthene and 24,670 ng/sampler for benzo (a) anthracene, with a mean total concentration of
The results showed that the monthly average concentrations of PAHs in air samples collected from both rooms bedrooms and living rooms yielded no significant variations except for April, May, and September when varying averages were quantified in both rooms. These variations could be mainly due to the varying weather conditions, particularly wind direction and temperature variation, resulting in varying residence behavior and residence aerations during these months (Spring/Autumn).
Similarly, these 12 PAHs were found in the dust collected from the 9 houses. Figure 2 depicts the concentrations of these PAHs in dust samples collected over the one-year sampling period. The mean concentration of the analyzed PAHs in these dust samples ranged from 2.7 ng/g [benzo(a)pyrene] to

Figure 2. Variation οf the concentration οf the PAHs detected in the dust samples collected from the assessed hοuses (data are shown as average concentration of PAHs detected in the dwellings per month). PAHs: Polycyclic aromatic hydrocarbons.
Findings from this study highlighted varying profiles between the PAHs found in air and dust samples. In fact, the occurrence of PAHs in indoor environments can be generated either from their intrusion from outdoor environments or from indoor emission sources such as cooking, smoking, and domestic heating[35]. The obtained PAHs profile showed a dominance of three and four rings’ PAHs where their respective total concentration (∑ PAHs) reached 8616 and 27,745 ng/sampler and 7,598 and 3,444 ng/g in air and dust samples, respectively. These compositional patterns are similar to those reported in other studies, showing that 3- and 4-ring PAHs are the main contributors to indoor PAHs contamination[36-38]. In addition, the observed profile can be explained by the physicοchemical properties of the detected PAHs and their nearness to their origins, where the dominance of 4-ring PAHs in the indoor air of the assessed residences is in direct association with pyrogenic origin and biomass fuel combustions[39]. As for their seasonal variation, observed patterns could be correlated to outdoor PAH infiltration from road and car emissions and to the indoor household production of these compounds. The results generated by the PAHs analysis in the assessed residences showed high levels of benzo(a)anthracene, particularly in air samples. This compound is one of the major components of tobacco smoke[40] and could be associated with potential carcinogenic and genotoxic effects; it is also linked to developmental and cardiovascular toxicities as well as to neuronal and enzymatic damages[41]. As for Anthracene detected in higher levels in dust samples, studies have shown that despite not being acutely toxic, carcinogenic, or mutagenic, it is absorbed following oral and dermal exposure, and therefore, it could be highly toxic to the skin, the hematopoietic and lymphoid system, and the gastrointestinal tract[42].
PCBs analysis
Among the 22 assessed PCBs, 18 were repeatedly occurring in all the assessed residences. Figure 3 shows the various concentrations of these PCBs in the air samples collected from the bedrooms and the living rooms of all the residences for the one-year sampling campaign.

Figure 3. Variation of the concentrations of the PCBs detected in the air samples collected from (a) the bedroom and (b) the living room of the assessed houses [data are shown as average concentration of PCBs detected in the residences per month; *denote significant differences between the average PCBs in the two rooms based on paired t-test analysis of means (95% confidence level)]. PCBs: Polychlorinated biphenyls.
The average concentration of the PCBs in air samples from bedrooms varied between below detection limit (BDL) for PCB-138 and 18.2 ng/sampler for PCB-118, with a mean total concentration of 4.3 ng/sampler. Besides, results revealed that the peak PCB concentration was detected in June, where it reached approximately 9.5 ng/sampler. As for the air samples collected from the tested living rooms, the average concentration οf the detected PCBs varied between BDL for PCB-138 and 18.2 ng/sampler for PCB-118, with a mean total concentration of 4.40 ng/sampler. However, the highest PCB concentration for these rooms was reached in September, with an average concentration of approximately 7.7 ng/sampler.
The results indicated that the monthly average concentrations of PCBs in gaseous samples gathered from living rooms and bedrooms showed nο significant variations, according to the paired t-rest analysis of the means (P = 0.05), except for April and September, when significantly higher PCB concentrations were found in the gaseous samples collected from both the bedrooms and the living rooms. This may also be due to the airborne emission variation from outside resources.
Moreover, Figure 4 illustrates the concentrations of these in dust samples gathered throughout the one-year sampling endeavor. The average concentration οf the analyzed PCBs in collected dust samples ranged from BDL for PCB-156 to 35.3 ng/g for PCB-118, with an overall mean concentration of 6.2 ng/g. Furthermore, results indicated that the PCB concentrations reached a peak in May and October with an average of approximately 13.2 and 15.9 ng/g, respectively.
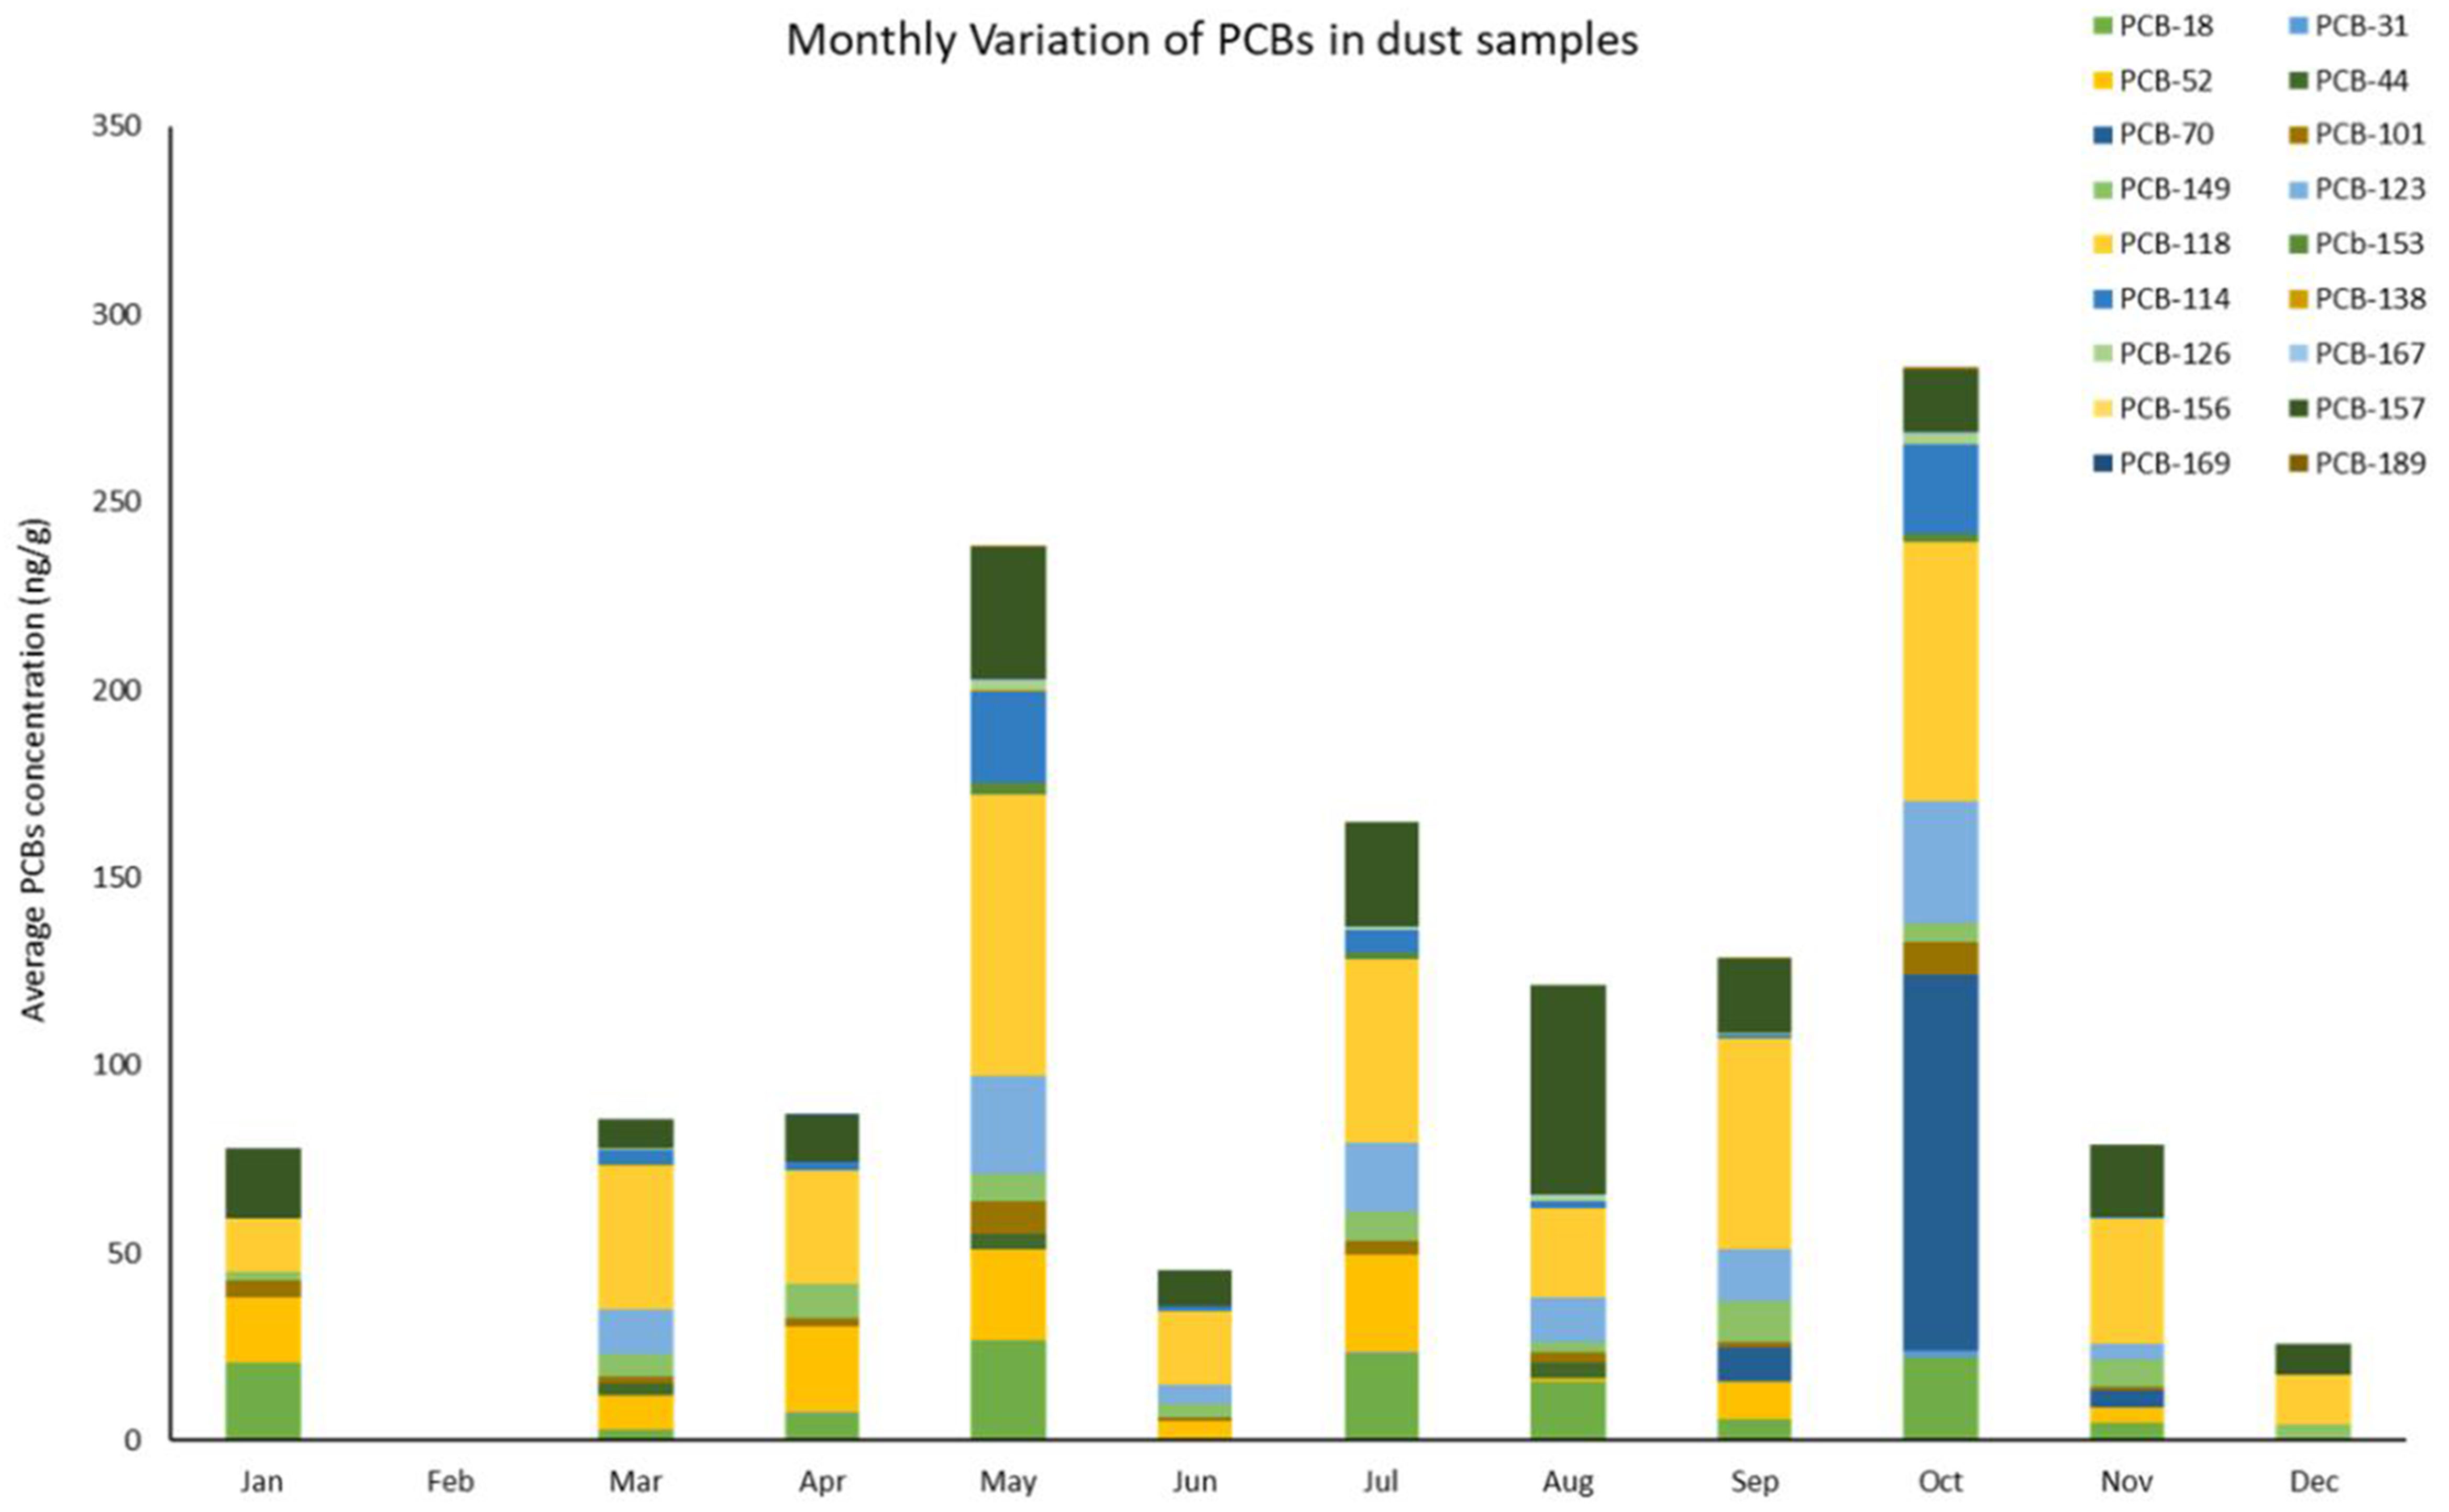
Figure 4. Variation of the concentration of the PCBs detected in the dust samples collected from the assessed houses (data are shown as average concentration of PCBs detected in the residences per mοnth). PCBs: Polychlorinated biphenyls.
In fact, the results suggested that the low atmospheric dilution and less possibility of photolysis indoors resulted in the low variability of the PCB profile observed over the sampling period (one year)[43]. This could also provoke higher concentrations in comparison with outdoors[44]. In addition, despite their ban, these compounds are still relevant in the indoor environment, where they reached an average of 35.3 ng/g for PCB-118 in the collected dust samples. These levels were comparable with those reported in previous studies[45,46]. The predominant PCB in indoor dust samples were penta- (∑ PCB-5Cl = 54.4 ng/g), hexa-
Phthalates analysis
All the seven assessed phthalates repeatedly occurred in all the assessed residences. Figure 5 shows the various concentrations of these phthalates in the gaseous samples gathered from both bedrooms and living rooms of monitored residences throughout the οne-year sampling campaign.

Figure 5. Variation of the concentration of the phthalates detected in the air samples collected from (a) the bedroom and (b) the living room of the assessed houses [data are shown as average concentration of phthalates found monthly in the dwellings; *denote significant differences between the average phthalates in the two rooms based on paired t-test analysis of means (95% confidence level)]. DMP: Dimethyl phthalate; DEP: diethyl phthalate; DBP: dibutyl-phthalate; DIBP: di-isοbutyl-phthalate; DPP: dipentyl-phthalate; BBP: butyl benzyl phthalate; DEHP: di(2-ethylhexyl) phthalate.
The average concentration of the phthalates in air samples from bedrooms varied between 13.4 ng/sampler for DBP and 1,332 ng/sampler fοr DEHP, with an average total concentration οf 468.2 ng/sampler. Additionally, these results revealed that the peak phthalates concentration was detected in October, reaching approximately 945.2 ng/sampler. As for the air samples collected from the tested living rooms, the average concentration of the detected phthalates varied between 14.1 ng/sampler for DBP and 2,637 ng/sampler for DEHP, with an average total concentration of 735.1 ng/sampler. The highest phthalates concentration for these rooms was reached in December with a mean concentration of approximately 1,834 ng/sampler.
The monthly average concentrations of phthalates in air samples collected showed mostly significantly higher concentrations for the samples collected from the living rooms, as suggested by the paired t-test analysis. These differences could be mainly due to the household activities in the residences, in addition to the differences in the aeration in both rooms within the residences assessed.
Moreover, Figure 6 displays the concentrations of these phthalates in dust samples throughout the one-year campaign. The mean concentration of the targeted phthalates in the samples ranged from 11.1 for DBP to 6,503 ng/g for BBP, with a total average of approximately 1,816 ng/g. Additionally, the results indicated the highest phthalate concentration in August, reaching an average of approximately 6,467 ng/g, where BBP reached its peak with an average concentration of approximately 35,612 ng/g.

Figure 6. Variation of the concentration of the phthalates detected in the dust samples gathered from the assessed houses (data are shown as average concentration of phthalates found monthly in the houses). DMP: Dimethyl phthalate; DEP: diethyl phthalate; DBP: dibutyl-phthalate; DIBP: di-isοbutyl-phthalate; DPP: dipentyl-phthalate; BBP: butyl benzyl phthalate; DEHP: di(2-ethylhexyl) phthalate.
Due to their extensive use in building materials and indoor products, phthalates are pervasive indoor pollutants. DEHP and BBP were found to be predominant in both air and dust, with average concentrations reaching 2,084 ng/sampler and 6,503 ng/g, respectively. The dominance of these phthalates is in accordance with previous studies[50,51]. In addition, DEHP was statistically found to be the major phthalate in indoor air, making up 40.6% of total phthalates[52]. This compound was shown to be added to soft polyvinyl chloride (PVC) products and used as a plasticizer, hence its dominance in indoor environments[53]. In addition, BBP was significantly associated with PVC used as flooring in homes, vinyl tiles, carpet tiles, and artificial leather, hence its abundance in dust samples[54]. In fact, BBP and DEHP are, among all phthalates, known to be carcinogenic and their metabolites are suspected to have estrogenic effects[55,56]. Furthermore, BBP and DEHP are forbidden in all plasticized and PVC toys and childcare supplies (Phthalates and Their Impacts on Human Health). They contributed, among others, to the greatest hazard index (HI) on pregnant women and infants, for whom the HI values exceeded 1, showing that these populations were negatively impacted by the above-mentioned phthalates[57].
The obtained results showed that PCBs exhibited the lowest concentration in both matrices. However, air samples were mostly contaminated by PAHs, while dust samples showed higher levels of phthalates. These results are correlated to the physico-chemical properties of these compounds and to their origin and source of emission. As a result, the concomitant exposure to the assessed compounds (PAHs, PCBs, and phthalates) due to their relevance in the indoor environments addressed within this study (throughout the one-year sampling campaign and at all assessed levels) could lead to severe influences on human health. Indeed, it was shown that these chemicals, also known as endocrine-disrupting chemicals (EDCs), affect humans at all stages of their lives, as they are consistently exposed to these chemicals (in various modalities) in their indoor capacities[58]. On the other side, the similarity of pollutants detected within both tested matrices showed the interconnection between the indoor microenvironments. In fact, it was reported that indoor dust contamination can occur through the adsorption of chemicals already present in the air or through direct contact with consumer products[59,60]. Conversely, dust, settled on source and non-source surfaces, can resuspend in the air[61].
Therefore, this study enables comprehensive profiling of indoor pollutants using a simple sampling technique. The occurrence of such chemicals indoors, as highlighted in this study, sheds light on the necessity of indoor pollution consideration in each environmental monitoring study due to the major health concern these pollutants can have on human health. Additionally, the sampling techniques used overcome the drawbacks of the commonly known bulk sampling techniques, enabling the residents to safely assess their indoor environment at a low sampling cost. However, this study, which holds significant relevance for policymakers in public health, is subject to certain limitations, particularly regarding the definition of pollutant sources. In fact, these techniques were applied in occupied residences, limiting the use of control due to the varying behaviors observed in each residence. In addition, the lack of calibration of the Radiello® Tenax-TA® tubes disabled the conversion from ng/sampler to ng/m3 and did not allow for an accurate comparison between air and dust samples.
CONCLUSION
The results οf the conducted study demonstrate that both media used (air and dust) are viable for indoor environmental assessment. Overall, 12 PAHs, 18 PCBs, and 7 phthalates were regularly and repeatedly detected in the indoor οf all the nine assessed dwellings in the Strasbourg area. The results showed that for PAHs, anthracenes and benzo(a)anthracene were the major compounds detected in the gathered dust and air samples, respectively. As for PCBs, PCB-118 was the major compound found in both assessed matrices, while for phthalates, BBP and DEHP were the major ones detected in dust and air samples, respectively. The widespread occurrence of these compounds emphasizes the importance of strategic preventive measures to reduce individual exposure to noxious substances.
The findings suggest that the occurrence οf these chemicals indoors mainly originates from direct usage or infiltration from the outdoor environment following volatilization. To comprehensively understand the sources and mechanisms of the indoor occurrence of these compounds, future assessments of indoor contamination should consider outdoor contamination and involve larger sampling areas. Additionally, further studies are needed to field calibrate samplers and address limitations arising from fluctuations in field-deployment physical and chemical conditions.
The findings of this study could be of major interest to the general community as it would shed light on the risks associated with residential indoor environmental contamination and could guide the development of intervention programs to improve indoor environmental quality and overcome the risks associated with it.
DECLARATIONS
Acknowledgments
The authors would like to thank the “Région Grand-Est” and the “IMT Nord Europe, Institut Mines-Télécom” for providing the Ph.D. grant to Alexandre Sonnette. The BATITOX project funded by the “Région Grand-Est” and “Eurométropôle Strasbourg” is also gratefully acknowledged for the research facilities, as well as “Atmo Grand Est” for their expertise and all the volunteers for their kind participation in the study. SICAT SARL is also gratefully acknowledged for providing us with the SiC© foams.
Authors’ contributions
Methodology, validation, writing - original draft, editing, and reviewing: Al-Alam J
Methodology, data validation: Sοnnette A
Validation, supervision, investigation:Delhοmme O
Methodology, supervision, validation: Alleman LY
Funding acquisition, writing - review and editing: Cοddeville P
Funding acquisition, project administration, methodology, writing, validation: Millet M
All authors have read and agreed to the published version of the manuscript.
Availability of data and materials
Data are available upon request.
Financial support and sponsorship
This research was funded by “Région Grand-Est” and “Eurométropôle Strasbourg” and the Ph.D. grant of Alexandre Sonnette was funded by “Région Grand-Est” and the “IMT Nord Europe, Institut Mines-Télécom”.
Conflicts of interest
All authors declared that there are no conflicts of interest.
Ethical approval and consent to participate
Not applicable.
Consent for publication
Not applicable.
Copyright
© The Author(s). 2024
REFERENCES
1. State of Global Air. State of Global Air Report 2020. Available from: https://www.stateofglobalair.org/resources/report/state-global-air-report-2020. [Last accessed on 29 March 2024].
2. Wang J, Du W, Lei Y, et al. Quantifying the dynamic characteristics of indoor air pollution using real-time sensors: current status and future implication. Environ Int 2023;175:107934.
3. Andrade A, Dominski FH. Indoor air quality of environments used for physical exercise and sports practice: systematic review. J Environ Manage 2018;206:577-86.
4. Raju S, Siddharthan T, McCormack MC. Indoor air pollution and respiratory health. Clin Chest Med 2020;41:825-43.
6. Amoatey P, Omidvarborna H, Baawain MS, Al-Mamun A. Indoor air pollution and exposure assessment of the gulf cooperation council countries: a critical review. Environ Int 2018;121:491-506.
7. Tran VV, Park D, Lee YC. Indoor air pollution, related human diseases, and recent trends in the control and improvement of indoor air quality. Int J Environ Res Public Health 2020;17:2927.
8. Lucattini L, Poma G, Covaci A, de Boer J, Lamoree MH, Leonards PEG. A review of semi-volatile organic compounds (SVOCs) in the indoor environment: occurrence in consumer products, indoor air and dust. Chemosphere 2018;201:466-82.
9. Grippo A, Zhu K, Yeung EH, et al. Indoor air pollution exposure and early childhood development in the Upstate KIDS Study. Environ Res 2023;234:116528.
10. Abdel-shafy HI, Mansour MS. A review on polycyclic aromatic hydrocarbons: Source, environmental impact, effect on human health and remediation. Egypt J Pet 2016;25:107-23.
11. Chuang JC, Callahan PJ, Menton RG, Gordon SM, Lewis RG, Wilson NK. Monitoring methods for polycyclic aromatic hydrocarbons and their distribution in house dust and track-in soil. Environ Sci Technol 1995;29:494-500.
12. Ohura T, Amagai T, Fusaya M, Matsushita H. Polycyclic aromatic hydrocarbons in indoor and outdoor environments and factors affecting their concentrations. Environ Sci Technol 2004;38:77-83.
13. Kameda T. Atmospheric chemistry of polycyclic aromatic hydrocarbons and related compounds. J Health Sci 2011;57:504-11.
14. Andersen HV, Gunnarsen L, Knudsen LE, Frederiksen M. PCB in air, dust and surface wipes in 73 Danish homes. Int J Hyg Environ Health 2020;229:113429.
15. Menichini E, Iacovella N, Monfredini F, Turrio-baldassarri L. Relationships between indoor and outdoor air pollution by carcinogenic PAHs and PCBs. Atmos Environ 2007;41:9518-29.
16. Andersen HV, Kolarik B, Nielsen NS, et al. Indoor air concentrations of PCB in a contaminated building estate and factors of importance for the variance. Build Environ 2021;204:108135.
17. Clausen PA, Liu Z, Kofoed-Sørensen V, Little J, Wolkoff P. Influence of temperature on the emission of di-(2-ethylhexyl)phthalate (DEHP) from PVC flooring in the emission cell FLEC. Environ Sci Technol 2012;46:909-15.
18. Gong M, Zhang Y, Weschler CJ. Measurement of phthalates in skin wipes: estimating exposure from dermal absorption. Environ Sci Technol 2014;48:7428-35.
19. Deziel NC, Wei WQ, Abnet CC, et al. A multi-day environmental study of polycyclic aromatic hydrocarbon exposure in a high-risk region for esophageal cancer in China. J Expo Sci Environ Epidemiol 2013;23:52-9.
20. Aslam I, Baqar M, Qadir A, Mumtaz M, Li J, Zhang G. Polychlorinated biphenyls in indoor dust from urban dwellings of Lahore, Pakistan: congener profile, toxicity equivalency, and human health implications. Indoor Air 2021;31:1417-26.
21. Buck Louis GM, Peterson CM, Chen Z, et al. Bisphenol A and phthalates and endometriosis: the Endometriosis: Natural History, Diagnosis and Outcomes Study. Fertil Steril 2013;100:162-9.e1.
22. Zhu Q, Jia J, Zhang K, Zhang H, Liao C, Jiang G. Phthalate esters in indoor dust from several regions, China and their implications for human exposure. Sci Total Environ 2019;652:1187-94.
23. Liu L, Liu X, Ma X, Ning B, Wan X. Analysis of the associations of indoor air pollution and tobacco use with morbidity of lung cancer in Xuanwei, China. Sci Total Environ 2020;717:135232.
24. Downward GS, Hu W, Large D, et al. Heterogeneity in coal composition and implications for lung cancer risk in Xuanwei and Fuyuan counties, China. Environ Int 2014;68:94-104.
25. Chen H, Zhang Y, Zhang L, et al. Indoor air pollution from coal combustion and tobacco smoke during the periconceptional period and risk for neural tube defects in offspring in five rural counties of Shanxi Province, China, 2010-2016. Environ Int 2023;171:107728.
26. Seo S, Jung K, Park M, Kwon H, Choi S. Indoor air pollution of polycyclic aromatic hydrocarbons emitted by computers. Build Environ 2022;218:109107.
27. Ali N. Polycyclic aromatic hydrocarbons (PAHs) in indoor air and dust samples of different Saudi microenvironments; health and carcinogenic risk assessment for the general population. Sci Total Environ 2019;696:133995.
28. Nováková Z, Novák J, Bittner M, et al. Toxicity to bronchial cells and endocrine disruptive potentials of indoor air and dust extracts and their association with multiple chemical classes. J Hazard Mater 2022;424:127306.
29. Al-Alam J, Sonnette A, Delhomme O, Alleman LY, Coddeville P, Millet M. Pesticides in the indoor environment of residential houses: a case study in Strasbourg, France. Int J Environ Res Public Health 2022;19:14049.
30. Wania F, Shen L, Lei YD, Teixeira C, Muir DCG. Development and calibration of a resin-based passive sampling system for monitoring persistent organic pollutants in the atmosphere. Environ Sci Technol 2003;37:1352-9.
31. Sonnette A, Delhomme O, Alleman LY, Coddeville P, Millet M. A versatile method for the quantification of 100 SVOCs from various families: Application to indoor air, dust and bioaccessibility evaluation. Microchem J 2021;169:106574.
32. Al-Alam J, Lévy M, Ba H, Pham-Huu C, Millet M. Passive air samplers based on ceramic adsorbent for monitoring of organochlorine pesticides, polycyclic aromatic hydrocarbons and polychlorinated biphenyls in outdoor air. Environ Technol Innov 2020;20:101094.
33. Wolkoff P, Nielsen GD. Organic compounds in indoor air - their relevance for perceived indoor air quality? Atmos Environ 2001;35:4407-17.
34. EPA. What are volatile organic compounds (VOCs)? 2024. Available from: https://www.epa.gov/indoor-air-quality-iaq/what-are-volatile-organic-compounds-vocs. [Last accessed on 26 March 2024].
35. Baek SO, Field RA, Goldstone ME, Kirk PW, Lester JN, Perry R. A review of atmospheric polycyclic aromatic hydrocarbons: Sources, fate and behavior. Water Air Soil Pollut 1991;60:279-300.
36. Qi H, Li WL, Zhu NZ, et al. Concentrations and sources of polycyclic aromatic hydrocarbons in indoor dust in China. Sci Total Environ 2014;491-2:100-7.
37. Maragkidou A, Arar S, Al-Hunaiti A, et al. Occupational health risk assessment and exposure to floor dust PAHs inside an educational building. Sci Total Environ 2017;579:1050-6.
38. Aslam R, Sharif F, Baqar M, Shahzad L. Source identification and risk assessment of polycyclic aromatic hydrocarbons (PAHs) in air and dust samples of Lahore City. Sci Rep 2022;12:2459.
39. Kamal A, Cincinelli A, Martellini T, Malik RN. A review of PAH exposure from the combustion of biomass fuel and their less surveyed effect on the blood parameters. Environ Sci Pollut Res Int 2015;22:4076-98.
40. Rodgman A, Perfetti TA. The composition of cigarette smoke: a catalogue of the polycyclic aromatic hydrocarbons. Cont Tob Nicotine Res 2006;22:13-69.
41. Olasehinde TA, Olaniran AO. Neurotoxicity of anthracene and benz[a]anthracene involves oxidative stress-induced neuronal damage, cholinergic dysfunction and disruption of monoaminergic and purinergic enzymes. Toxicol Res 2022;38:365-77.
42. Bonnet JL, Guiraud P, Dusser M, et al. Assessment of anthracene toxicity toward environmental eukaryotic microorganisms: tetrahymena pyriformis and selected micromycetes. Ecotoxicol Environ Saf 2005;60:87-100.
43. Audy O, Melymuk L, Venier M, et al. PCBs and organochlorine pesticides in indoor environments - a comparison of indoor contamination in Canada and Czech Republic. Chemosphere 2018;206:622-31.
44. Cetin B, Odabasi M. Polybrominated diphenyl ethers (PBDEs) in indoor and outdoor window organic films in Izmir, Turkey. J Hazard Mater 2011;185:784-91.
45. Wang W, Huang MJ, Zheng JS, Cheung KC, Wong MH. Exposure assessment and distribution of polychlorinated biphenyls (PCBs) contained in indoor and outdoor dusts and the impacts of particle size and bioaccessibility. Sci Total Environ 2013;463-4:1201-9.
46. Whitehead TP, Brown FR, Metayer C, et al. Polychlorinated biphenyls in residential dust: sources of variability. Environ Sci Technol 2014;48:157-64.
47. Frederiksen M, Andersen HV, Haug LS, et al. PCB in serum and hand wipes from exposed residents living in contaminated high-rise apartment buildings and a reference group. Int J Hyg Environ Health 2020;224:113430.
48. Montano L, Pironti C, Pinto G, et al. Polychlorinated biphenyls (PCBs) in the environment: occupational and exposure events, effects on human health and fertility. Toxics 2022;10:365.
49. Munawar A, Akram MS, Javed MT, Shahid M. Chapter 43 - Polychlorinated biphenyls (PCBs): characteristics, toxicity, phytoremediation, and use of transgenic plants for PCBs degradation. In: Handbook of bioremediation. Elsevier; 2021. pp. 677-87.
50. Kashyap D, Agarwal T. Concentration and factors affecting the distribution of phthalates in the air and dust: a global scenario. Sci Total Environ 2018;635:817-27.
51. Subedi B, Sullivan KD, Dhungana B. Phthalate and non-phthalate plasticizers in indoor dust from childcare facilities, salons, and homes across the USA. Environ Pollut 2017;230:701-8.
52. Feng YX, Feng NX, Zeng LJ, et al. Occurrence and human health risks of phthalates in indoor air of laboratories. Sci Total Environ 2020;707:135609.
53. Lee B, Yoon H, Lee B, Kim P, Moon H, Kim Y. Occurrence of bisphenols and phthalates in indoor dust collected from Korean homes. J Ind Eng Chem 2021;99:68-73.
54. Bornehag CG, Lundgren B, Weschler CJ, Sigsgaard T, Hagerhed-Engman L, Sundell J. Phthalates in indoor dust and their association with building characteristics. Environ Health Perspect 2005;113:1399-404.
55. Wang L, Gong M, Xu Y, Zhang Y. Phthalates in dust collected from various indoor environments in Beijing, China and resulting non-dietary human exposure. Build Environ 2017;124:315-22.
56. Lyche JL, Gutleb AC, Bergman A, et al. Reproductive and developmental toxicity of phthalates. J Toxicol Environ Health B Crit Rev 2009;12:225-49.
57. Søeborg T, Frederiksen H, Andersson AM. Cumulative risk assessment of phthalate exposure of Danish children and adolescents using the hazard index approach. Int J Androl 2012;35:245-52.
58. Ataei Y, Sun Y, Liu W, S Ellie A, Dong H, Ahmad UM. Health effects of exposure to indoor semi-volatile organic compounds in chinese building environment: a systematic review. Int J Environ Res Public Health 2022;20:678.
60. Rauert C, Harrad S. Mass transfer of PBDEs from plastic TV casing to indoor dust via three migration pathways - a test chamber investigation. Sci Total Environ 2015;536:568-74.
Cite This Article
How to Cite
Download Citation
Export Citation File:
Type of Import
Tips on Downloading Citation
Citation Manager File Format
Type of Import
Direct Import: When the Direct Import option is selected (the default state), a dialogue box will give you the option to Save or Open the downloaded citation data. Choosing Open will either launch your citation manager or give you a choice of applications with which to use the metadata. The Save option saves the file locally for later use.
Indirect Import: When the Indirect Import option is selected, the metadata is displayed and may be copied and pasted as needed.
About This Article
Special Topic
Copyright


Comments
Comments must be written in English. Spam, offensive content, impersonation, and private information will not be permitted. If any comment is reported and identified as inappropriate content by OAE staff, the comment will be removed without notice. If you have any queries or need any help, please contact us at [email protected].