


The difference between cystatin C- and creatinine-based estimated glomerular filtration rate and risk of hypertension: a population-based study in middle-aged and elderly Chinese
 0
0 Abstract
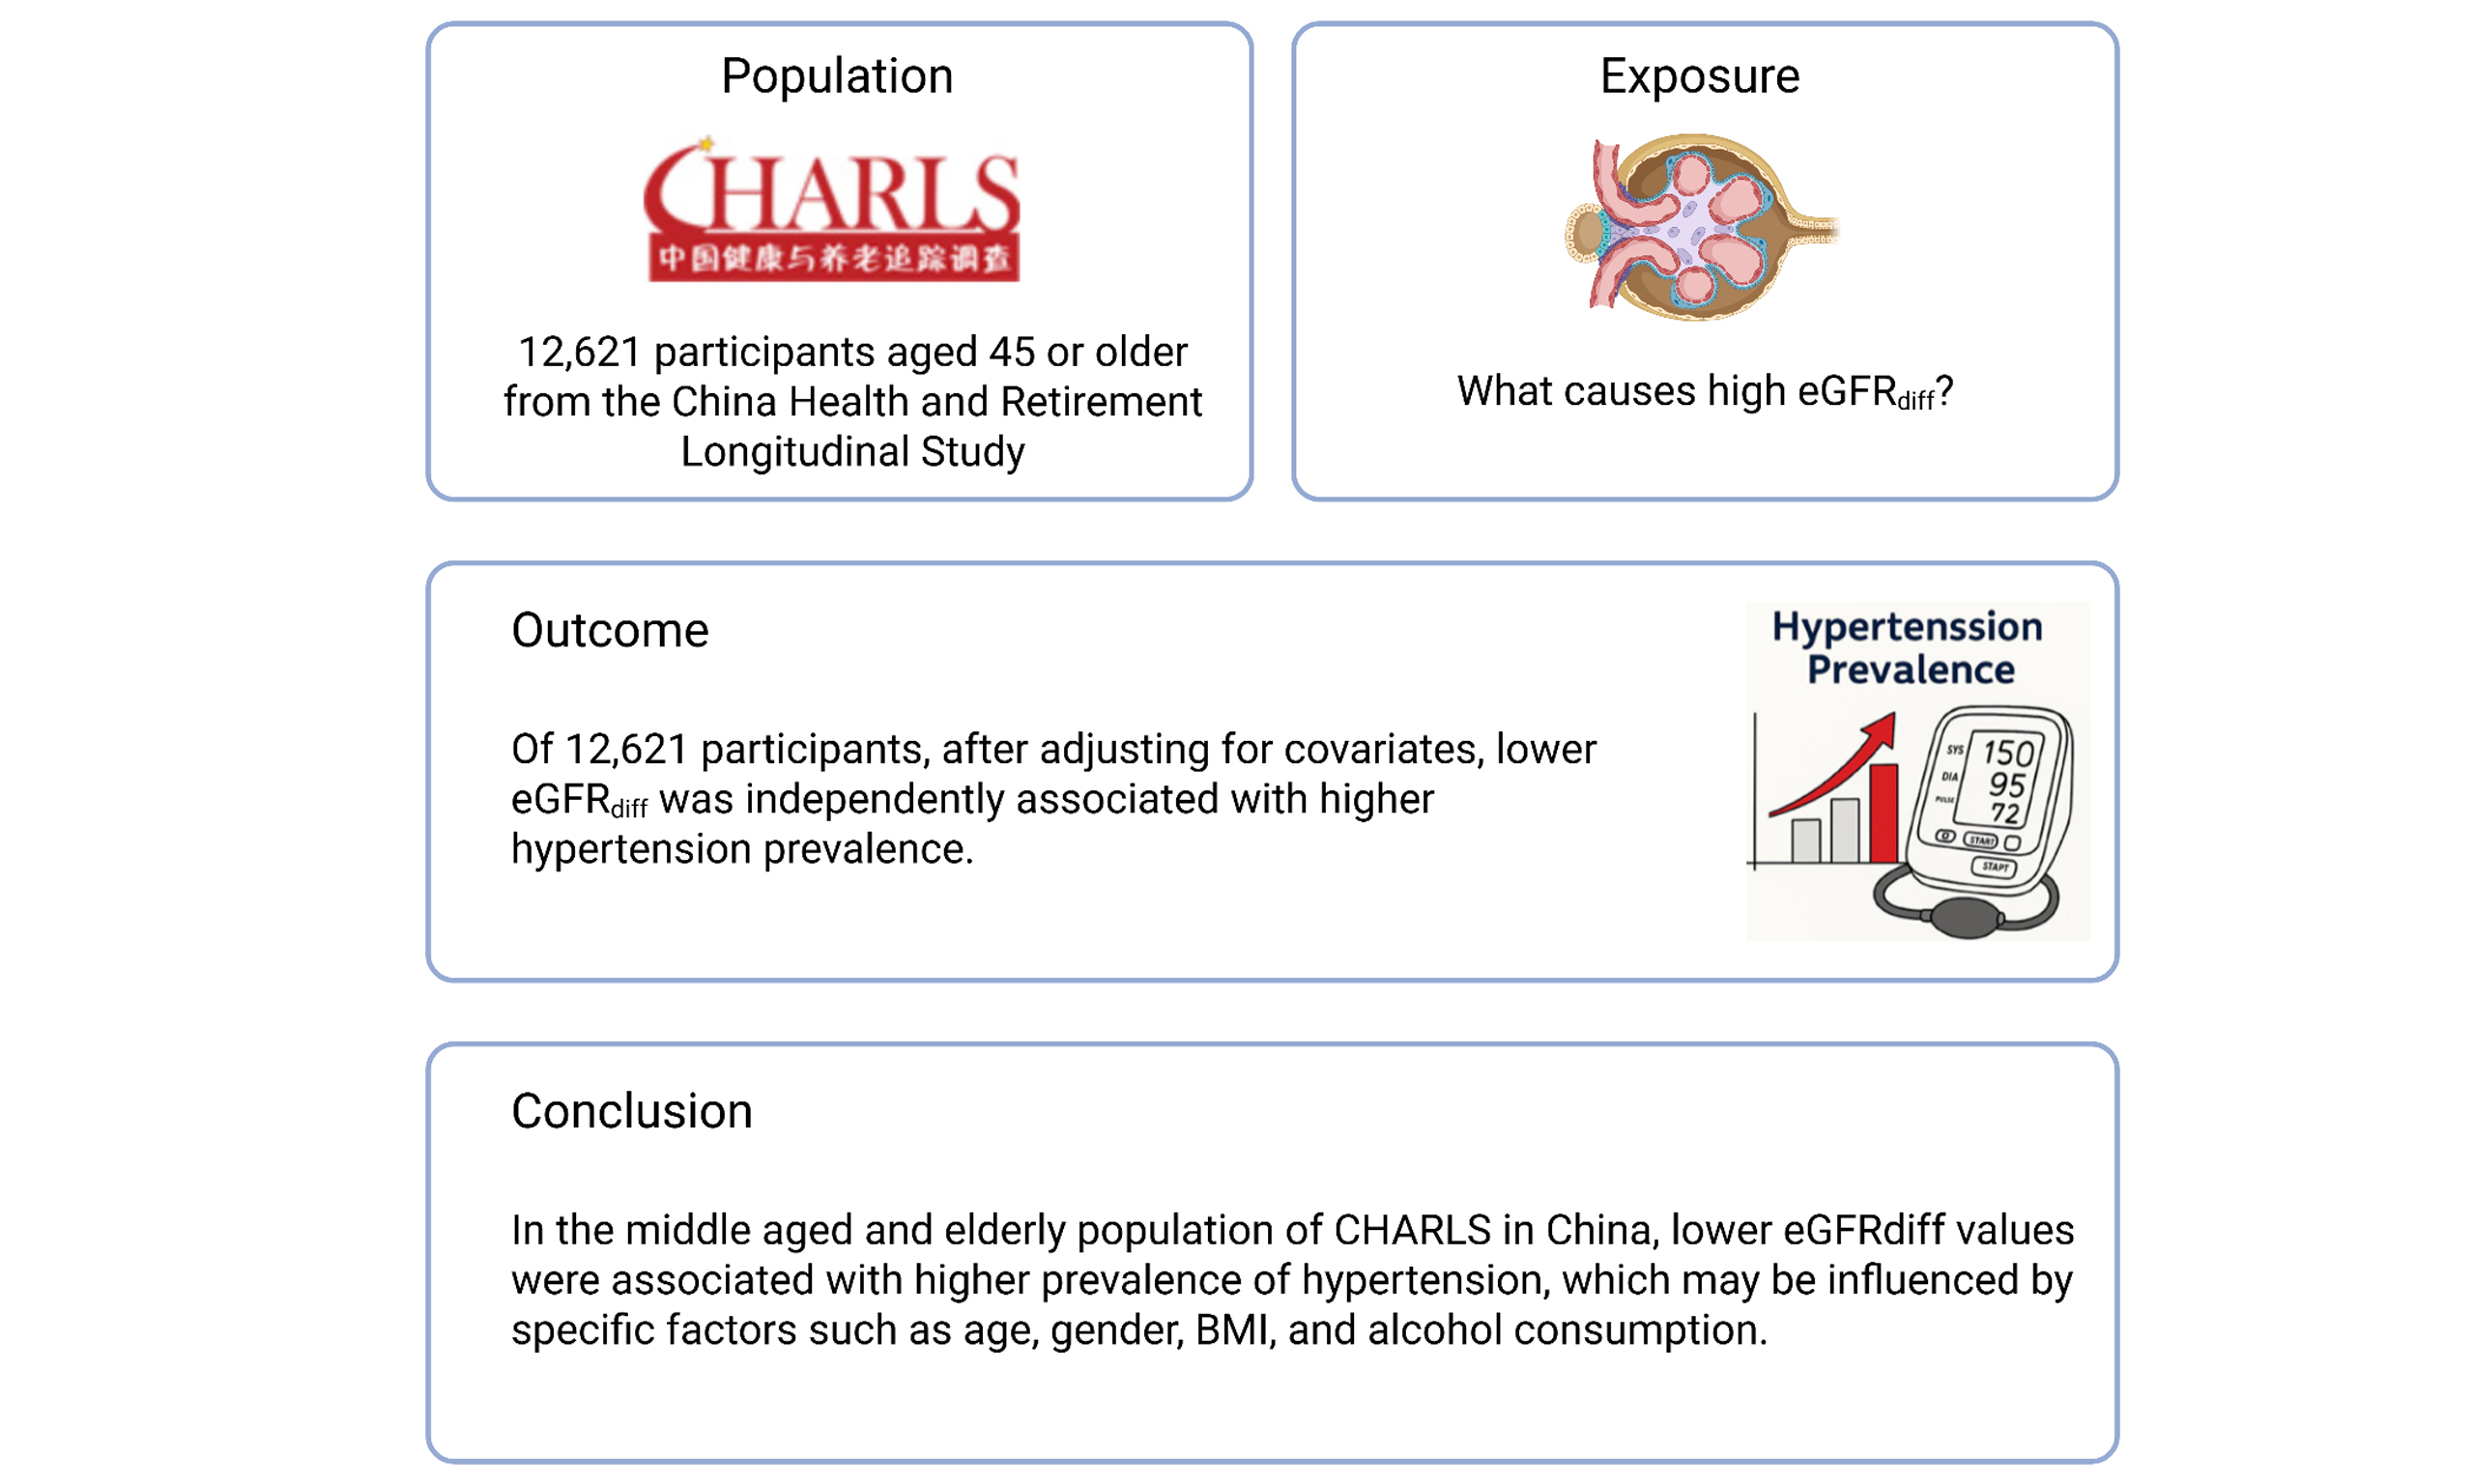
Aim: The difference between cystatin C-based and creatinine-based estimated glomerular filtration rate (eGFRdiff) has been suggested to reflect factors distinct from kidney function that are associated with cardiovascular risk. This study aims to investigate the association between eGFRdiff and hypertension (HP) among the middle-aged and elderly population in China.
Methods: This study utilized a cross-sectional design based on retrospective data from the China Health and Retirement Longitudinal Study (CHARLS) cohort. We conducted a cross-sectional analysis of CHARLS data collected from 2011 to 2020. Hypertension was identified through self-reports or the use of antihypertensive medications. Participants younger than 45 years, those with kidney diseases, or individuals missing data on eGFRdiff, hypertension records, or baseline information were excluded from the study. Participants were categorized into three groups based on eGFRdiff: negative (< -15 mL/min/1.73 m2), midrange (-15 to 15 mL/min/1.73 m2), and positive (≥ 15 mL/min/1.73 m2). The primary outcome of interest was the prevalence of HP. We employed weighted multivariable-adjusted logistic regression to examine the association between eGFRdiff and HP.
Results: Among 12,621 participants, after adjusting for covariates, a lower eGFRdiff was found to be independently associated with a higher prevalence of hypertension. In comparison to the negative eGFRdiff group, the midrange group exhibited an odds ratio (OR) of 0.79 (95%CI, 0.70-0.90; P < 0.001), while the positive group demonstrated an OR of 0.52 (95%CI, 0.44-0.61; P < 0.001). Our findings further underscore the significance of specific factors, such as age, gender, body mass index (BMI), and alcohol consumption, in influencing the association between eGFRdiff and hypertension prevalence.
Conclusion: In the middle-aged and elderly population of CHARLS in China, lower eGFRdiff values were associated with a higher prevalence of hypertension, which may be influenced by specific factors such as age, gender, BMI, and alcohol consumption. These findings may have implications for the risk management of hypertension in the middle-aged and elderly population.
Keywords
INTRODUCTION
Hypertension, which affects approximately 50 million individuals globally, is one of the most prevalent cardiovascular conditions and represents a significant public health concern[1-4]. Although aging, inflammation, diabetes, and valvular heart disease are recognized as traditional risk factors for hypertension, the specific contributors and underlying mechanisms involved in its development are still not fully understood[5-8].
Renal dysfunction is considered another possible contributor to hypertension[9]. Studies on the association between hypertension and kidney function have yielded inconsistent findings, primarily due to variations in the methods used to estimate glomerular filtration rate (eGFR). Many investigations have highlighted discrepancies between two commonly used kidney function indicators: creatinine-based eGFR (eGFRcr) and cystatin C-based eGFR (eGFRcys), in their association with the risk of developing hypertension[10-13]. A significant link has been identified between eGFRcys and the onset of hypertension[14,15], whereas the association with eGFRcr was found to be less robust[16]. These inconsistencies might be explained by the influence of non-renal factors on eGFRcr, such as advanced age, sarcopenia, and reduced physical activity, all of which are associated with an elevated risk of hypertension[17]. In contrast, eGFRcys is less affected by these non-renal factors[18], providing a more accurate assessment of kidney function in relation to hypertension risk. An elevated eGFRcr could suggest effective kidney function; however, it might also reflect factors that can heighten the likelihood of hypertension. This underscores the importance of a more thorough assessment when examining the relationship between kidney function and hypertension.
Recent research has identified kidney dysfunction as a potential risk factor for hypertension[19-24]. A novel metric, known as the eGFR difference (eGFRdiff), has been introduced as a valuable indicator of overall health status and frailty[25]. Defined as the discrepancy between eGFRcys and eGFRcr, the eGFRdiff metric is thought to capture the varying impacts of non-renal factors on creatinine and cystatin C levels[26]. Research has shown that a negative eGFRdiff is associated with poor cardiovascular outcomes, including heart failure, atherosclerotic cardiovascular events, and increased mortality[27,28]. Although some associations have been reported, prior studies have not specifically explored the link between hypertension and eGFRdiff. This research aims to investigate the relationship between eGFRdiff and the onset of hypertension using data from CHARLS, a cohort study involving middle-aged and older adults in China.
Since eGFRdiff indicates overall health beyond just kidney function, and its negative values correlate with cardiovascular incidents such as heart failure and death, exploring its relationship with hypertension could provide a new prognostic indicator for clinical applications.
METHODS
Data source and study population
The nationally representative China Health and Retirement Longitudinal Study (CHARLS) focuses on the middle-aged and elderly population of China[29]. It includes Chinese adults aged 45 and older living in urban and rural areas throughout the country[30]. The design, methodologies, and protocols of the study have been thoroughly outlined in earlier publications. The first national baseline survey took place during 2011-2012, succeeded by another wave in 2013, and the third wave was primarily completed in 2015. In Waves 1 and 3, blood samples were collected from participants, with 17,705 and 21,095 individuals interviewed, leading to the collection of 8,487 and 12,778 blood samples, respectively[31]. Baseline measurements were taken for serum creatinine and cystatin C levels. To explore the connection between eGFRdiff and the risk of hypertension, only participants without existing disease reports were selected for the study, while those with kidney disease diagnoses were excluded due to the associated risk of renal hypertension. To tackle the issue of missing data regarding smoking frequency, drinking frequency, waist circumference, and body mass index (BMI), multiple imputations were utilized, thereby increasing both the sample size and the accuracy of statistical inferences. Data collected from waves 1 and 3 were combined, ensuring that only the 2011 data for participants who had been interviewed in both waves were retained. This process resulted in a final dataset comprising 12,621 participants, all of whom had relevant baseline characteristics for the research [Figure 1].
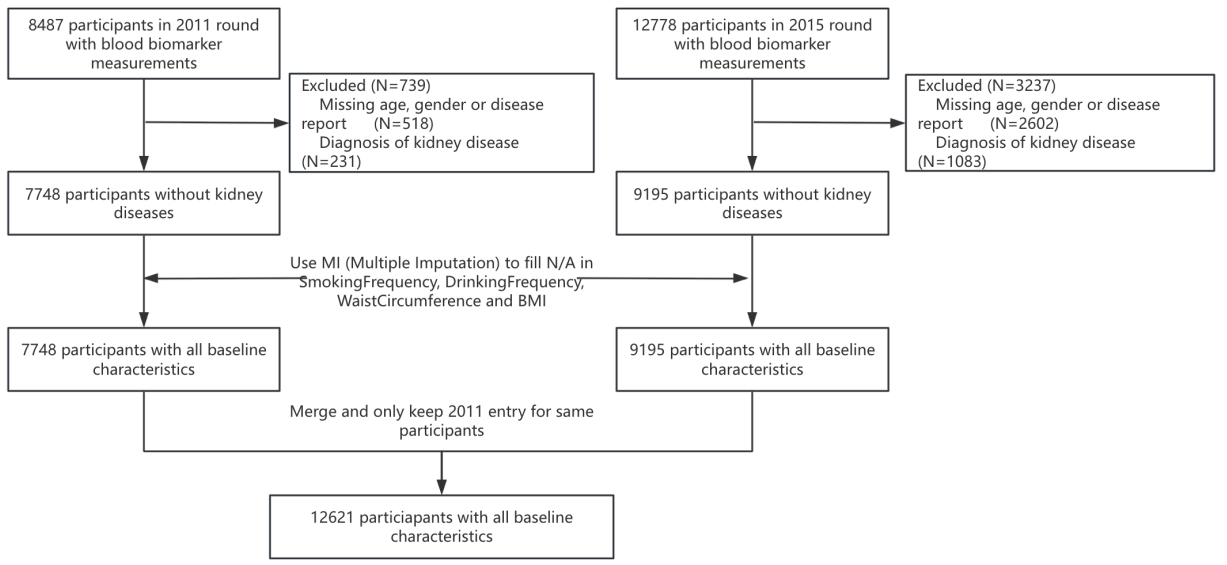
Figure 1. Flowchart of participant selection for analysis.
Data collection and measurement
In 2011, and again during the follow-up in 2015, every participant filled out a questionnaire that incorporated self-reports and interviews to collect data on sociodemographic factors, lifestyle choices, and medical history. Details concerning hypertension and associated conditions, including diabetes and kidney ailments, were gathered through participants’ self-reported prior diagnoses. Furthermore, the drinking behaviors of participants were divided into five groups according to their daily alcohol intake, while their smoking status was classified as either smoker or non-smoker.
In the county-level interviews, the interviewers utilized the appropriate tools to assess different dimensions of health functioning and performance within the households of the respondents. The measurements taken comprised height, weight, waist circumference, lung capacity, and blood pressure. In this context, calculating the BMI was crucial, entailing the division of weight (in kilograms) by the square of height (in meters squared).
In our research, KingMed Diagnostics Laboratory, located in Tianjin, China, conducts the measurement of blood biomarkers. The levels of creatine are determined through the Picric acid method, while the immunoturbidimetric assay is used for cystatin C measurement. We opted for the race-free CKD-EPI equation to estimate the glomerular filtration rate (GFR) due to its enhanced accuracy in the Asian demographic compared to the Modification of Diet in Renal Disease (MDRD) equation. Following this, eGFRcr was calculated using the CKD-EPI 2009 equation, and eGFRcys was derived using the CKD-EPI 2012 equation. Ultimately, eGFRdiff was calculated by taking the difference between eGFRcys and eGFRcr.
Definition of hypertension
Hypertension diagnosis follows well-established medical guidelines. In particular, a person who is not taking antihypertensive drugs is considered hypertensive if their systolic blood pressure (SBP) measurements reach or exceed 140 mmHg and/or their diastolic blood pressure (DBP) readings are at least 90 mmHg on three different instances[32-34]. Analyses of sensitivity that focus exclusively on participants with recorded SBP of 140 mmHg or higher, or DBP of 90 mmHg or more, would aid in evaluating robustness. In this research, the status of hypertension is regarded as a binary variable, signifying either its presence or lack thereof.
Hypertension is characterized by satisfying at least one of these conditions: (1) an affirmative response to the question “Has a doctor ever diagnosed you with hypertension?” or (2) an affirmative response to the question “Are you presently undergoing any treatments to manage or control your hypertension, including Traditional Chinese Medicine or Western medicine?”
Main exposure and study outcome
In this research, subjects were categorized according to an important exposure metric referred to as baseline eGFRdiff. This metric, derived from the difference between eGFRcys and eGFRcr, classified the participants into three distinct groups: negative (< -15 mL/min/1.73 m2), midrange (-15 to 15 mL/min/1.73 m2), and positive (≥ 15 mL/min/1.73 m2)[35]. Additionally, the analysis utilized eGFRdiff as a continuous variable, specifically examining changes of 10 mL/min/1.73 m2 increments in eGFRdiff. For the sensitivity analysis, the primary exposure variable employed by the researchers was race-free eGFRdiff. This variable is characterized as the difference between eGFRcys and race-free eGFRcr.
Statistical analysis
All statistical analyses were conducted utilizing Zstats and R software version 4.3.2, with a P value of less than 0.05 deemed statistically significant. In our cross-sectional study, participants were divided into three categories based on their eGFRdiff levels. Quantitative data were reported as medians alongside 95% confidence intervals (CIs), and the differences among eGFRdiff groups were evaluated through the
Limitations
While omitting participants with diagnosed kidney diseases aided in identifying the non-renal factors influencing hypertension, it could also lead to selection bias by leaving out individuals at an elevated risk for cardiovascular issues.
RESULTS
Baseline characteristics
The cross-sectional study included 12,621 participants. Table 1 displays the baseline characteristics
Association between eGFRdiff levels and prevalence of hypertension
| Characteristic | Overall, N = 12,621 | eGFRdiff negative | eGFRdiff midrange | eGFRdiff positive | P-value2 |
| Age | 59 (52, 67) | 62 (54, 70) | 59 (52, 67) | 57 (50, 63) | < 0.001 |
| Gender | < 0.001 | ||||
| Male | 5,850 (46%) | 838 (35%) | 2,974 (43%) | 2,038 (61%) | |
| Female | 6,771 (54%) | 1,531 (65%) | 3,934 (57%) | 1,306 (39%) | |
| Hypertension | 3,544 (28%) | 679 (29%) | 2,019 (29%) | 846 (25%) | < 0.001 |
| Taking antihypertensive drugs | 2,615 (21%) | 491 (21%) | 1,518 (22%) | 606 (18%) | < 0.001 |
| Diabetes | 926 (7.3%) | 141 (6.0%) | 517 (7.5%) | 268 (8.0%) | 0.010 |
| Smoking frequency | 0 (0, 1) | 0 (0, 0) | 0 (0, 0) | 0 (0, 10) | < 0.001 |
| Drinking frequency | < 0.001 | ||||
| 0 | 8,707 (69%) | 1,839 (78%) | 4,957 (72%) | 1,911 (57%) | |
| 1 | 2,380 (19%) | 332 (14%) | 1,197 (17%) | 851 (25%) | |
| 2 | 856 (6.8%) | 112 (4.7%) | 422 (6.1%) | 322 (9.6%) | |
| 3 | 505 (4.0%) | 60 (2.5%) | 252 (3.6%) | 193 (5.8%) | |
| 4 | 173 (1.4%) | 26 (1.1%) | 80 (1.2%) | 67 (2.0%) | |
| Vigorous activity frequency | 0.012 | ||||
| 0 | 8,055 (64%) | 1,504 (63%) | 4,439 (64%) | 2,112 (63%) | |
| 1 | 218 (1.7%) | 31 (1.3%) | 123 (1.8%) | 64 (1.9%) | |
| 2 | 361 (2.9%) | 58 (2.4%) | 180 (2.6%) | 123 (3.7%) | |
| 3 | 458 (3.6%) | 76 (3.2%) | 247 (3.6%) | 135 (4.0%) | |
| 4 | 353 (2.8%) | 57 (2.4%) | 198 (2.9%) | 98 (2.9%) | |
| 5 | 368 (2.9%) | 67 (2.8%) | 201 (2.9%) | 100 (3.0%) | |
| 6 | 175 (1.4%) | 45 (1.9%) | 91 (1.3%) | 39 (1.2%) | |
| 7 | 2,633 (21%) | 531 (22%) | 1,429 (21%) | 673 (20%) | |
| Moderate activity frequency | < 0.001 | ||||
| 0 | 5,369 (43%) | 1,053 (44%) | 2,955 (43%) | 1,361 (41%) | |
| 1 | 206 (1.6%) | 23 (1.0%) | 105 (1.5%) | 78 (2.3%) | |
| 2 | 443 (3.5%) | 67 (2.8%) | 226 (3.3%) | 150 (4.5%) | |
| 3 | 557 (4.4%) | 79 (3.3%) | 297 (4.3%) | 181 (5.4%) | |
| 4 | 319 (2.5%) | 44 (1.9%) | 170 (2.5%) | 105 (3.1%) | |
| 5 | 435 (3.4%) | 93 (3.9%) | 217 (3.1%) | 125 (3.7%) | |
| 6 | 169 (1.3%) | 32 (1.4%) | 96 (1.4%) | 41 (1.2%) | |
| 7 | 5,123 (41%) | 978 (41%) | 2,842 (41%) | 1,303 (39%) | |
| Light activity frequency | 0.087 | ||||
| 0 | 2,684 (21%) | 529 (22%) | 1,490 (22%) | 665 (20%) | |
| 1 | 144 (1.1%) | 29 (1.2%) | 69 (1.0%) | 46 (1.4%) | |
| 2 | 245 (1.9%) | 38 (1.6%) | 127 (1.8%) | 80 (2.4%) | |
| 3 | 319 (2.5%) | 44 (1.9%) | 183 (2.6%) | 92 (2.8%) | |
| 4 | 163 (1.3%) | 30 (1.3%) | 83 (1.2%) | 50 (1.5%) | |
| 5 | 331 (2.6%) | 66 (2.8%) | 174 (2.5%) | 91 (2.7%) | |
| 6 | 104 (0.8%) | 15 (0.6%) | 61 (0.9%) | 28 (0.8%) | |
| 7 | 8,631 (68%) | 1,618 (68%) | 4,721 (68%) | 2,292 (69%) | |
| BMI | 23.4 (21.0, 26.1) | 22.7 (20.1, 25.6) | 23.4 (21.1, 26.2) | 23.7 (21.4, 26.2) | < 0.001 |
| Waist circumference | 85 (78, 93) | 84 (77, 93) | 85 (78, 93) | 86 (79, 93) | < 0.001 |
| Blood weight | 33,491 (24,852, 46,828) | 33,088 (24,742, 44,848) | 33,446 (24,936, 46,100) | 33,920 (24,933, 50,201) | 0.007 |
| Fasting | < 0.001 | ||||
| 1 | 11,257 (89%) | 2,198 (93%) | 6,182 (89%) | 2,877 (86%) | |
| 2 | 1,364 (11%) | 171 (7.2%) | 726 (11%) | 467 (14%) | |
| White blood cell in thousands | 5.90 (4.90, 7.10) | 5.90 (4.87, 7.20) | 5.90 (4.90, 7.10) | 5.85 (4.86, 7.00) | 0.20 |
| MCV | 92 (87, 96) | 91 (87, 96) | 92 (87, 96) | 92 (88, 96) | 0.14 |
| Platelets | 204 (161, 250) | 201 (155, 251) | 207 (162, 252) | 203 (162, 246) | 0.027 |
| Blood urea nitrogen (BUN) (mg/dL) | 15.0 (12.5, 18.1) | 15.1 (12.6, 18.2) | 15.0 (12.5, 18.1) | 15.1 (12.6, 17.9) | 0.57 |
| Glucose (mg/dL) | 100 (92, 112) | 101 (93, 110) | 101 (92, 112) | 99 (90, 111) | < 0.001 |
| Creatinine (mg/dL) | 0.76 (0.65, 0.88) | 0.69 (0.61, 0.78) | 0.75 (0.64, 0.87) | 0.84 (0.72, 0.97) | < 0.001 |
| Total cholesterol (mg/dL) | 187 (164, 212) | 184 (162, 211) | 188 (165, 213) | 186 (165, 211) | 0.006 |
| Triglycerides (mg/dL) | 109 (78, 160) | 102 (74, 141) | 109 (79, 160) | 115 (81, 177) | < 0.001 |
| Hdl cholesterol (mg/dL) | 50 (42, 59) | 51 (42, 61) | 49 (41, 59) | 50 (42, 58) | < 0.001 |
| Ldl cholesterol (mg/dL) | 109 (88, 131) | 111 (88, 134) | 110 (90, 132) | 105 (86, 126) | < 0.001 |
| C-reactive protein (CRP) (mg/L) | 1.20 (0.60, 2.40) | 1.27 (0.64, 2.87) | 1.19 (0.60, 2.40) | 1.18 (0.60, 2.20) | < 0.001 |
| Glycated hemoglobin (%) | 5.40 (5.00, 5.80) | 5.20 (4.90, 5.50) | 5.30 (5.00, 5.80) | 5.60 (5.30, 6.00) | < 0.001 |
| Uric acid (mg/dL) | 4.49 (3.70, 5.40) | 4.23 (3.57, 5.00) | 4.40 (3.64, 5.30) | 4.85 (3.99, 5.80) | < 0.001 |
| Hematocrit | 41.5 (38.0, 45.0) | 40.6 (36.9, 44.2) | 41.3 (38.0, 44.7) | 42.5 (38.9, 46.0) | < 0.001 |
| Hemoglobin (g/dL) | 14.00 (12.80, 15.20) | 13.80 (12.60, 15.10) | 13.90 (12.80, 15.20) | 14.30 (13.00, 15.50) | < 0.001 |
| Cystatin C | 0.92 (0.79, 1.06) | 1.11 (1.02, 1.23) | 0.91 (0.82, 1.03) | 0.75 (0.66, 0.88) | < 0.001 |
| GFRdiff | 3 (-11, 16) | -23 (-29, -19) | 1 (-7, 8) | 23 (19, 32) | < 0.001 |
Association between eGFRdiff and hypertension prevalence
To examine the relationship between eGFRdiff and the prevalence of hypertension, we conducted a multivariate logistic regression analysis utilizing two waves of cross-sectional data from 2011 and 2015, as presented in Table 2. Our investigation revealed that, across all three models, a lower eGFRdiff value correlated with a higher prevalence of hypertension. Notably, after adjusting for relevant covariates, the prevalence of hypertension was significantly reduced in participants belonging to the midrange eGFRdiff group (OR: 0.79, 95%CI: 0.70-0.90, P < 0.001) and the positive group (OR: 0.52, 95%CI: 0.44-0.61, P < 0.001) compared to those in the negative eGFRdiff group.
Multivariate logistic regression analysis between eGFRdiff groups and hypertension prevalence
| Variable | Model 1 | Model 2 | Model 3 | |||
| OR (95%CI) | P value | OR (95%CI) | P value | OR (95%CI) | P value | |
| eGFRdiff negative | Ref. | Ref. | Ref. | |||
| eGFRdiff midrange | 0.72 (0.64, 0.81) | < 0.001 | 0.81 (0.72, 0.92) | < 0.001 | 0.79 (0.70, 0.90) | < 0.001 |
| eGFRdiff positive | 0.41 (0.36, 0.47) | < 0.001 | 0.52 (0.45, 0.61) | < 0.001 | 0.52 (0.44, 0.61) | < 0.001 |
Subgroup analysis
Subgroup analyses indicated notable variability in the relationship between eGFRdiff and hypertension across different population subgroups (see Figure 2). The strongest associations were identified in individuals older than 60 years (midrange eGFRdiff OR: 1.32, 95%CI: 1.15-1.51; positive eGFRdiff OR: 1.08, 95%CI: 0.91-1.28) and in males (midrange OR: 1.42, 95%CI: 1.19-1.70; positive OR: 1.31, 95%CI: 1.08-1.58), accompanied by significant interactions (P < 0.001 for both age and sex). In contrast, women exhibiting positive eGFRdiff presented a diminished risk of hypertension (OR: 0.74, 95%CI: 0.63-0.78). Additionally, significant modifications were observed regarding BMI (P = 0.003 for BMI > 24), waist circumference (P = 0.019 for
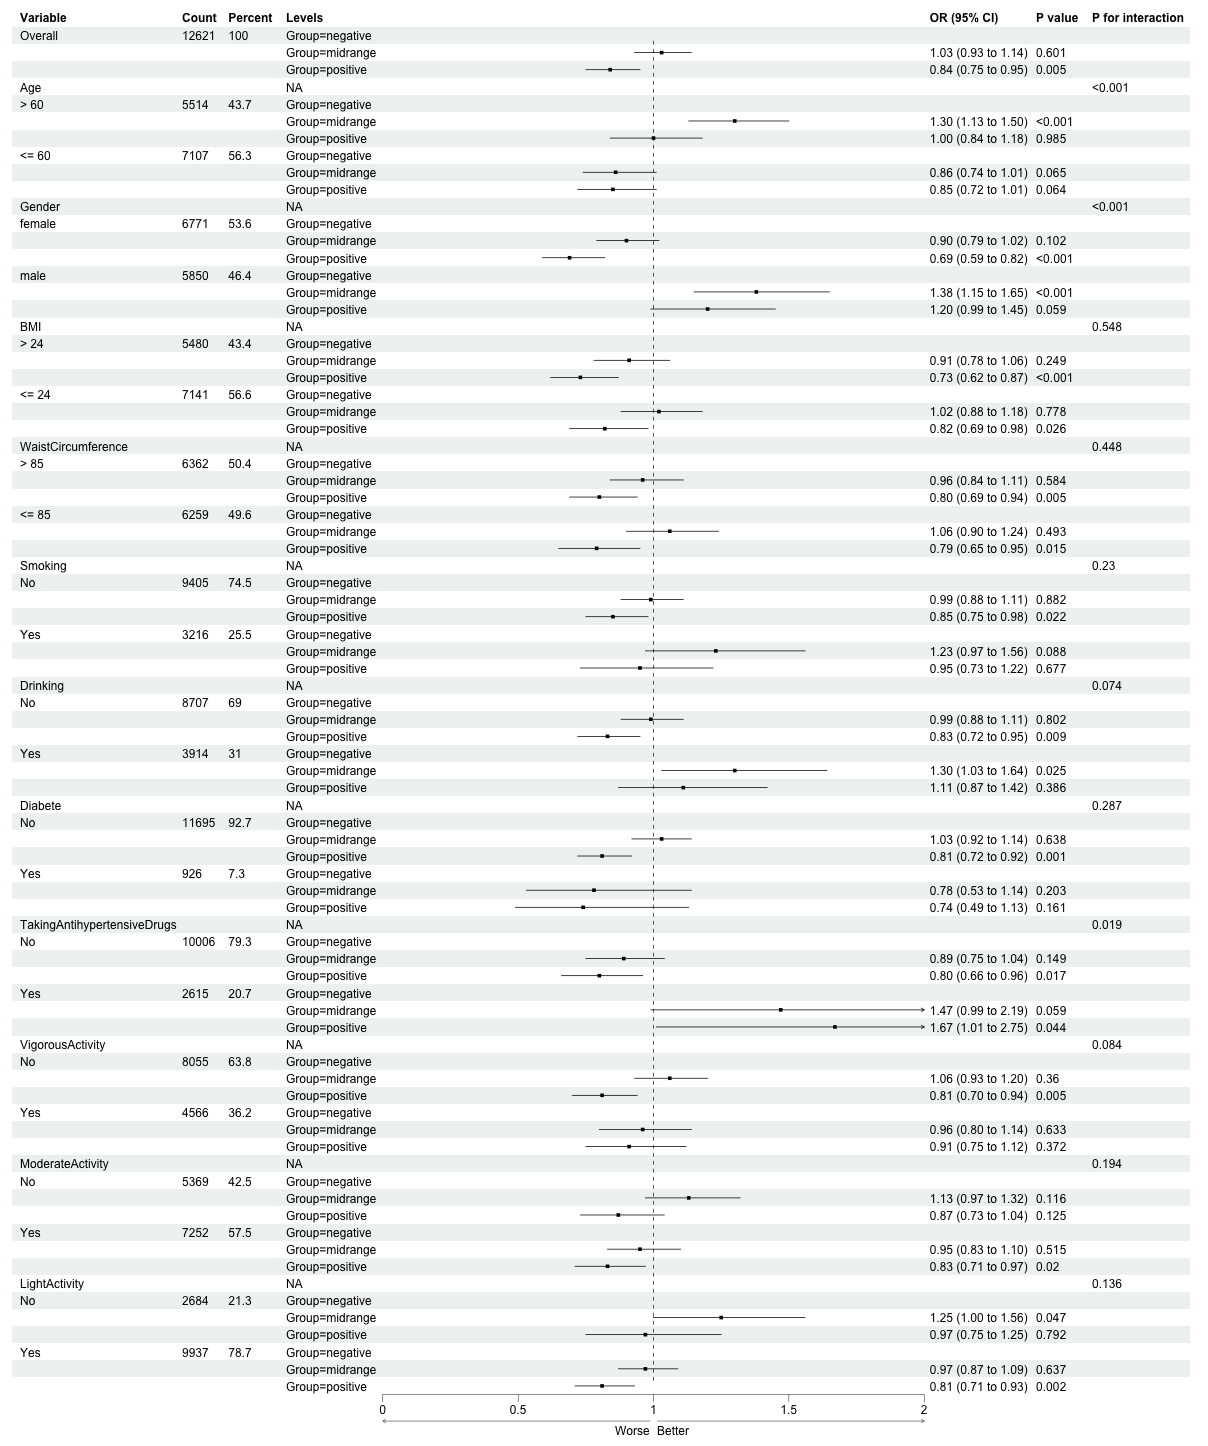
Figure 2. Subgroup analysis of the association between eGFRdiff groups and hypertension prevalence.
The variability noted in subgroup analyses-like the contrasting patterns observed in participants aged over 60, males, and drinkers in relation to the primary findings-could be due to multiple factors. One example is the decrease in muscle mass that occurs with aging, which can influence serum creatinine levels (an essential element of eGFRcr), resulting in modified calculations for eGFRdiff[36,37]. Males typically have higher muscle mass, potentially contributing to differential creatinine production and thus influencing the discrepancy between eGFRcys and eGFRcr[38]. Additionally, measurement bias or unmeasured confounders (e.g., alcohol-induced metabolic changes in drinkers) might further drive these contradictions.
Cautious interpretation of interaction terms is crucial, since differences among subgroups may result from chance or residual confounding, especially in light of the substantial sample size. Therefore, it is necessary to replicate these findings in specific cohorts to confirm the identified patterns.
DISCUSSION
The research we conducted examined 12,621 nationally representative participants from China who were middle-aged and elderly, aiming to investigate the connection between eGFRdiff and the incidence of hypertension. Our analysis revealed an inverse relationship between eGFRdiff values and the risk of developing hypertension.
Our findings align with the growing recognition that eGFRdiff captures nuances of systemic health beyond traditional renal function markers, offering insights into hypertension risk. Specifically, the observed negative association between eGFRdiff and hypertension prevalence may reflect differential sensitivity of cystatin C and creatinine to non-renal factors-such as muscle mass, metabolic status, or subclinical inflammation-that also influence blood pressure regulation[39,40]. For instance, participants with lower eGFRdiff (indicating eGFRcys < eGFRcr) might exhibit unmeasured traits (e.g., sarcopenia or altered creatinine metabolism) that independently raise hypertension risk, whereas higher eGFRdiff could signal a more favorable metabolic profile[38,41].
Notably, our subgroup analyses revealed that these associations vary by age, gender, and lifestyle factors (e.g., alcohol consumption), highlighting the need to consider demographic and behavioral modifiers when interpreting eGFRdiff in clinical settings.
To further elaborate on the biological underpinnings of subgroup differences, we hypothesize several mechanisms. In participants over 60 years of age, age-related sarcopenia (loss of muscle mass) may reduce creatinine production, leading to artificially higher eGFRcr relative to eGFRcys (lower eGFRdiff)[42]. This could mask underlying renal or vascular dysfunction, thereby altering the observed association with hypertension[38]. For male participants, higher baseline muscle mass (and thus greater creatinine synthesis) might exaggerate eGFRcr, creating a larger discrepancy between eGFRcys and eGFRcr that interacts differently with hypertension risk compared to females[43]. Sex-related metabolic differences may also play a role: females often exhibit distinct patterns of adiposity and inflammatory markers, which could modify how cystatin C and creatinine reflect vascular health[44]. In drinkers, chronic alcohol consumption may impair renal tubular function or increase oxidative stress, altering cystatin C clearance and disrupting the balance between eGFRcys and eGFRcr-thereby reversing the direction of association observed in non-drinkers[45]. Additionally, in participants with BMI > 24 or waist circumference > 85 cm, excess adiposity may drive systemic inflammation, which is known to elevate cystatin C levels (lowering eGFRcys) and contribute to hypertension[46]. This could strengthen the inverse relationship between eGFRdiff and hypertension in these subgroups, as observed in our analysis.
As a measure that reflects variations in kidney filtration capacity, eGFRdiff demonstrates an inverse relationship with the occurrence of hypertension, likely influenced by a range of factors. These factors encompass the pivotal function of the kidneys in regulating blood pressure, the differing sensitivities of cystatin C and creatinine as biomarkers, the complex interplay between kidney impairment and blood pressure levels, as well as personal variations in genetics, lifestyle choices, and overall health. Furthermore, additional biological or environmental aspects that are not yet completely understood may affect both eGFRdiff and the development of hypertension. Consequently, while a negative correlation between eGFRdiff and hypertension has been identified, further investigation is needed to clarify the precise mechanisms involved.
Although research on hypertension itself is limited, several studies have identified a link between eGFRdiff and cardiovascular outcomes, which are known risk factors for hypertension[47-49]. In the Chronic Renal Insufficiency Cohort Study, which included 4,512 patients with CKD, baseline negative eGFRdiff was associated with a higher risk of developing heart failure[50]. Furthermore, when eGFRcys was subtracted from eGFRcr, the resulting larger difference correlated with increased risk of major adverse cardiovascular events and faster progression of coronary artery calcification in patients with CKD[50]. Similar results were observed across the general population, regardless of CKD prevalence, where positive eGFRdiff was linked to decreased cardiovascular events and mortality among 9,092 hypertensive participants from the SPRINT cohort[51]. A recent investigation within a Swedish general healthcare cohort similarly demonstrated that eGFRcys values below eGFRcr were associated with worse cardiovascular outcomes and reduced hypertension prevalence[52]. Other indicators, including the ratio of eGFRcys to eGFRcr, have demonstrated correlations with cardiovascular morbidity and mortality among elderly individuals.
In a cohort that represents a cross-section of middle-aged and older individuals in China, we found that the eGFRdiff value had a negative correlation with the prevalence of hypertension. This suggests that eGFRdiff, representing both kidney function and non-renal factors, may serve as a valuable indicator for identifying individuals with elevated hypertension risk. Given the cross-sectional design of this research, additional prospective cohort studies are required to establish causal relationships.
This research exhibits several important strengths. To begin with, we utilized data obtained from the CHARLS, a substantial cohort representative of middle-aged and older adults in China, which improves the applicability of our results to the general population. Additionally, we measured serum creatinine and cystatin C directly, facilitating a precise calculation of eGFRdiff-a metric that synthesizes both biomarkers to reflect aspects of systemic health that extend beyond conventional evaluations of renal function. Furthermore, our analyses accounted for numerous covariates and included subgroup assessments to investigate potential effect modification, thereby reinforcing the reliability of the associations observed.
Despite these advantages, it is important to recognize several limitations. The cross-sectional nature of the design prevents the establishment of causality between eGFRdiff and hypertension, and the possibility of reverse causation (for instance, chronic hypertension influencing renal biomarker levels) cannot be dismissed. Furthermore, the CHARLS dataset does not provide information regarding some potential confounders, such as the duration of hypertension, comprehensive medication histories (like diuretics that could affect markers of renal function), and direct measurements of muscle mass. There are also measurement limitations, including dependency on single baseline evaluations of creatinine and cystatin C (which may not accurately reflect long-term variability) and reliance on self-reported hypertension diagnoses (which introduces potential classification bias). Nevertheless, sensitivity analyses conducted exclusively with participants exhibiting measured SBP ≥ 140 mmHg or DBP ≥ 9 0 mmHg demonstrated consistent findings, indicating robustness. Lastly, the exclusion of individuals with self-reported kidney disease may have introduced selection bias, thereby restricting applicability to those with pre-existing renal issues.
DECLARATIONS
Acknowledgments
The authors sincerely thank the CHARLS team for providing the data used in this study.
Authors’ contribution
Writing - review and editing, writing - original draft, validation, supervision, project administration, methodology: Liu J, Li Y
Writing - review and editing, writing - original draft, visualization, validation, investigation, formal analysis: Yi X
Writing - review and editing, Writing - original draft, formal analysis, data curation, conceptualization: Wang X
Writing - review and editing, writing - original draft, resources, project administration, formal analysis, data curation, conceptualization: Zhou B
Availability of data and materials
The CHARLS data that support the findings of this study are openly available at https://charls.pku.edu.cn/.
Financial support and sponsorship
This work was supported by the National Natural Science Foundation of China (22208188), the National Undergraduate Training Program for Innovation and Entrepreneurship & Student Research Training Program (S202410003143), the Student Research Training program of Tsinghua University (2511T0682), and Beijing Municipal Health Commission (2024-3-034).
Conflicts of interest
Zhou B is a Youth Editorial Board member of The Journal of Cardiovascular Aging. Zhou B was not involved in any steps of editorial processing, notably including reviewer selection, manuscript handling, or decision making. The other authors declared that there are no conflicts of interest.
Ethical approval and consent to participate
The CHARLS study was approved by the Biomedical Ethics Review Committee of Peking University (IRB00001052-11014) and the Institutional Review Board at the National School of Development, Peking University (IRB00001052-11015). Written informed consent was obtained from all CHARLS participants at the time of data collection. The present study is a secondary analysis of de-identified, publicly available data from CHARLS (http://charls.pku.edu.cn/en), and therefore did not require additional ethical approval.
Consent for publication
Not applicable.
Copyright
© The Author(s) 2025.
REFERENCES
1. Daviglus ML, Talavera GA, Avilés-Santa ML, et al. Prevalence of major cardiovascular risk factors and cardiovascular diseases among Hispanic/Latino individuals of diverse backgrounds in the United States. JAMA. 2012;308:1775-84.
2. Ferdinand KC. Primordial prevention of cardiovascular disease in childhood: the time is now. J Am Coll Cardiol. 2019;73:2022-4.
3. Ramos AR, Weng J, Wallace DM, et al. Sleep patterns and hypertension using actigraphy in the Hispanic community health study/study of Latinos. Chest. 2018;153:87-93.
4. Pan A, Lin X, Hemler E, Hu FB. Diet and cardiovascular disease: advances and challenges in population-based studies. Cell Metab. 2018;27:489-96.
6. Batista VRG, Correia RR, Fernandes VS, et al. High-intensity interval training minimizes the deleterious effects of arterial hypertension on the urinary bladder of spontaneously hypertensive rats. Oxid Med Cell Longev. 2023;2023:9979397.
7. Johnson RK, Lichtenstein AH, Anderson CAM, et al; American Heart Association Nutrition Committee of the Council on Lifestyle and Cardiometabolic Health; Council on Cardiovascular and Stroke Nursing; Council on Clinical Cardiology; Council on Quality of Care and Outcomes Research; and Stroke Council. Low-calorie sweetened beverages and cardiometabolic health: a science advisory from the American Heart Association. Circulation. 2018;138:e126-40.
8. Khosravi A, Emamian MH, Hashemi H, Fotouhi A. Pre-hypertension and the risk of diabetes mellitus incidence using a marginal structural model in an Iranian prospective cohort study. Epidemiol Health. 2018;40:e2018026.
9. Joosten LAB, Crişan TO, Bjornstad P, Johnson RJ. Asymptomatic hyperuricaemia: a silent activator of the innate immune system. Nat Rev Rheumatol. 2020;16:75-86.
10. Tsai CW, Grams ME, Inker LA, Coresh J, Selvin E. Cystatin C- and creatinine-based estimated glomerular filtration rate, vascular disease, and mortality in persons with diabetes in the U.S. Diabetes Care. 2014;37:1002-8.
11. of the heart failure 2017 and the 4th world congress on acute heart Failure, Paris, France, 29 April - 2 May 2017. Eur J Heart Fail. 2017;19 Suppl 1:5-601.
12. Skranes JB, Claggett BL, Myhre PL, et al. Current smoking is associated with lower concentrations of high-sensitivity cardiac troponin t in patients with stable coronary artery disease: the PEACE trial. Circulation. 2019;140:2044-6.
13. Kanaya AM, Adler N, Moffet HH, et al. Heterogeneity of diabetes outcomes among asians and pacific islanders in the US: the diabetes study of northern california (DISTANCE). Diabetes Care. 2011;34:930-7.
14. Bjornstad P, Laffel L, Lynch J, et al; TODAY Study Group. Elevated serum uric acid is associated with greater risk for hypertension and diabetic kidney diseases in obese adolescents with type 2 diabetes: an observational analysis from the treatment options for type 2 diabetes in adolescents and youth (TODAY) study. Diabetes Care. 2019;42:1120-8.
15. Kestenbaum B, Rudser KD, de Boer IH, et al. Differences in kidney function and incident hypertension: the multi-ethnic study of atherosclerosis. Ann Intern Med. 2008;148:501-8.
16. Kadian-Dodov D, Gornik HL, Gu X, et al. Dissection and aneurysm in patients with fibromuscular dysplasia: findings from the U.S. registry for FMD. J Am Coll Cardiol. 2016;68:176-85.
17. Schneider MP, Hilgers KF, Schmid M, et al; GCKD Study Investigators. Blood pressure control in chronic kidney disease: A cross-sectional analysis from the German chronic kidney disease (GCKD) study. PLoS One. 2018;13:e0202604.
18. Rule AD, Cornell LD, Poggio ED. Senile nephrosclerosis-does it explain the decline in glomerular filtration rate with aging? Nephron Physiol. 2011;119 Suppl 1:p6-11.
19. Shen W, Alshehri M, Desale S, Wilcox C. The effect of amiloride on proteinuria in patients with proteinuric kidney disease. Am J Nephrol. 2021;52:368-77.
20. Feng L, de Silva HA, Jehan I, et al. Regional variation in chronic kidney disease and associated factors in hypertensive individuals in rural South Asia: findings from control of blood pressure and risk attenuation-Bangladesh, Pakistan and Sri Lanka. Nephrol Dial Transplant. 2019;34:1723-30.
21. Papacocea RI, Timofte D, Tanasescu MD, et al. Kidney aging process and the management of the elderly patient with renal impairment (Review). Exp Ther Med. 2021;21:266.
22. Msemo OA, Schmiegelow C, Nielsen BB, et al. Risk factors of pre-hypertension and hypertension among non-pregnant women of reproductive age in northeastern Tanzania: a community based cross-sectional study. Trop Med Int Health. 2018;23:1176-87.
23. Pan G, Zhou X, Zhao J. Effect of telmisartan on atrial fibrillation recurrences in patients with hypertension: a systematic review and meta-analysis. Cardiovasc Ther. 2014;32:184-8.
24. Marraffa M, Perfetti S, Morbio R, et al. The nerve fibre layer in ocular hypertention. Preliminary results. Acta Ophthalmol Scand. 1998;76(S227):29-30.
25. van Raalte DH, Bjornstad P, Persson F, et al. The impact of sotagliflozin on renal function, albuminuria, blood pressure, and hematocrit in adults with type 1 diabetes. Diabetes Care. 2019;42:1921-9.
26. Beier K, Eppanapally S, Bazick HS, et al. Elevation of blood urea nitrogen is predictive of long-term mortality in critically ill patients independent of “normal” creatinine. Crit Care Med. 2011;39:305-13.
27. Kamper AL, Strandgaard S. Long-term effects of high-protein diets on renal function. Annu Rev Nutr. 2017;37:347-69.
28. Vosoughi R, Goghari ZS, Jafari AH. Modelling system of two insulin-glucose delays to achieve the dynamics of glucose changes. J Biomed Phys Eng. 2022;12:189-204.
29. Dai HX, Zhao ZY, Xia Y, Wu QJ, Zhao YH. Higher levels of high-sensitivity C-reactive protein is positively associated with the incidence of hyperuricemia in Chinese population: a report from the China health and retirement longitudinal study. Mediators Inflamm. 2020;2020:3854982.
30. Liu J, Hou B, Ma XW, Liao H. Solid fuel use for cooking and its health effects on the elderly in rural China. Environ Sci Pollut Res Int. 2018;25:3669-80.
31. Lie E, Li Y, Kim R, Kim E. SALM/Lrfn family synaptic adhesion molecules. Front Mol Neurosci. 2018;11:105.
32. Perk J, De Backer G, Gohlke H, et al; European Association for Cardiovascular Prevention & Rehabilitation (EACPR). European Guidelines on cardiovascular disease prevention in clinical practice (version 2012). The Fifth Joint Task Force of the European Society of Cardiology and Other Societies on Cardiovascular Disease Prevention in Clinical Practice (constituted by representatives of nine societies and by invited experts). Eur Heart J. 2012;33:1635-701.
33. Tschanz CMP, Cushman WC, Harrell CTE, Berlowitz DR, Sall JL. Synopsis of the 2020 U.S. Department of Veterans Affairs/U.S. Department of Defense Clinical Practice Guideline: the diagnosis and management of hypertension in the primary care setting. Ann Intern Med. 2020;173:904-13.
34. Whelton PK, Carey RM, Aronow WS, et al. 2017 ACC/AHA/AAPA/ABC/ACPM/AGS/APhA/ASH/ASPC/NMA/PCNA Guideline for the Prevention, Detection, Evaluation, and Management of High Blood Pressure in Adults: Executive Summary: a report of the American College of Cardiology/American Heart Association Task Force on Clinical Practice Guidelines. Circulation. 2018;138:e426-83.
35. Heo GY, Koh HB, Jung CY, et al. Difference between estimated GFR based on cystatin C versus creatinine and incident atrial fibrillation: a cohort study of the UK biobank. Am J Kidney Dis. 2024;83:729-738.e1.
36. Tang J, Zhang C, Hu W, Qu W. Evaluation of six eGFR equations in predicting acute kidney injury in patients after off-pump coronary artery bypass grafting: a case control study. Rev Cardiovasc Med. 2024;25:120.
37. Yim J, Son NH, Kyong T, et al. Muscle mass has a greater impact on serum creatinine levels in older males than in females. Heliyon. 2023;9:e21866.
38. Groothof D, Post A, Polinder-Bos HA, et al. Muscle mass and estimates of renal function: a longitudinal cohort study. J Cachexia Sarcopenia Muscle. 2022;13:2031-43.
39. Pattaro C, Riegler P, Stifter G, Modenese M, Minelli C, Pramstaller PP. Estimating the glomerular filtration rate in the general population using different equations: effects on classification and association. Nephron Clin Pract. 2013;123:102-11.
40. Knol WG, Thuijs DJFM, Odink AE, et al. Preoperative chest computed tomography screening for coronavirus disease 2019 in asymptomatic patients undergoing cardiac surgery. Semin Thorac Cardiovasc Surg. 2021;33:417-24.
41. Li Z, Liu R, Gao X, et al. The correlation between hepatic controlled attenuation parameter (CAP) value and insulin resistance (IR) was stronger than that between body mass index, visceral fat area and IR. Diabetol Metab Syndr. 2024;16:153.
42. Nankivell BJ, Nankivell LFJ, Elder GJ, Gruenewald SM. How unmeasured muscle mass affects estimated GFR and diagnostic inaccuracy. EClinicalMedicine. 2020;29-30:100662.
43. Athreya DS, Saczynski JS, Gurwitz JH, et al. Cognitive impairment and treatment strategy for atrial fibrillation in older adults: the SAGE-AF study. J Am Geriatr Soc. 2024;72:2082-90.
44. Kammerlander AA, Lyass A, Mahoney TF, et al. Sex differences in the associations of visceral adipose tissue and cardiometabolic and cardiovascular disease risk: the Framingham heart study. J Am Heart Assoc. 2021;10:e019968.
45. Cheungpasitporn W, Thongprayoon C, Kittanamongkolchai W, et al. High alcohol consumption and the risk of renal damage: a systematic review and meta-analysis. QJM. 2015;108:539-48.
46. Schlecht I, Fischer B, Behrens G, Leitzmann MF. Relations of visceral and abdominal subcutaneous adipose tissue, body mass index, and waist circumference to serum concentrations of parameters of chronic inflammation. Obes Facts. 2016;9:144-57.
47. Sato Y, Ouchi K, Funase Y, Yamauchi K, Aizawa T. Relationship between metformin use, vitamin B12 deficiency, hyperhomocysteinemia and vascular complications in patients with type 2 diabetes. Endocr J. 2013;60:1275-80.
48. Park SK, Kim MH, Ha E, et al. The risk for incident ischemic heart disease according to estimated glomerular filtration rate in a Korean population. J Atheroscler Thromb. 2020;27:461-70.
49. Tracy A, Subramanian A, Adderley NJ, et al. Cardiovascular, thromboembolic and renal outcomes in IgA vasculitis (Henoch-Schönlein purpura): a retrospective cohort study using routinely collected primary care data. Ann Rheum Dis. 2019;78:261-9.
50. Denker M, Boyle S, Anderson AH, et al; Chronic renal insufficiency cohort study investigators. chronic renal insufficiency cohort study (CRIC): overview and summary of selected findings. Clin J Am Soc Nephrol. 2015;10:2073-83.
51. Covic A, Apetrii M, Goldsmith D, Kanbay M. SPRINT: the study nephrologists might take with a grain of salt. J Clin Hypertens. 2016;18:1185-8.
Cite This Article
How to Cite
Download Citation
Export Citation File:
Type of Import
Tips on Downloading Citation
Citation Manager File Format
Type of Import
Direct Import: When the Direct Import option is selected (the default state), a dialogue box will give you the option to Save or Open the downloaded citation data. Choosing Open will either launch your citation manager or give you a choice of applications with which to use the metadata. The Save option saves the file locally for later use.
Indirect Import: When the Indirect Import option is selected, the metadata is displayed and may be copied and pasted as needed.
About This Article
Copyright

Data & Comments
Data
0


Comments
Comments must be written in English. Spam, offensive content, impersonation, and private information will not be permitted. If any comment is reported and identified as inappropriate content by OAE staff, the comment will be removed without notice. If you have any queries or need any help, please contact us at [email protected].